
Morningstar Equity Analyst Report | Report as of 15 Jul 2021 15:25, UTC | Reporting Currency: USD | Trading Currency: USD | Exchange: NASDAQ
Page 1 of 19
© Morningstar 2021. All Rights Reserved. Unless otherwise provided in a separate agreement, you may use this report only in the country in which its original distributor is based. The information, data, analyses and
opinions presented herein do not constitute investment advice; are provided solely for informational purposes and therefore are not an offer to buy or sell a security; and are not warranted to be correct, complete or
accurate. The opinions expressed are as of the date written and are subject to change without notice. Except as otherwise required by law, Morningstar shall not be responsible for any trading decisions, damages or
other losses resulting from, or related to, the information, data, analyses or opinions or their use. The information contained herein is the proprietary property of Morningstar and may not be reproduced, in whole or in
part, or used in any manner, without the prior written consent of Morningstar. Investment research is produced and issued by subsidiaries of Morningstar, Inc. including, but not limited to, Morningstar Research
Services LLC, registered with and governed by the U.S. Securities and Exchange Commission. To order reprints, call +1 312-696-6100. To license the research, call +1 312-696-6869. Please see important disclosures at
the end of this report.
ß
®
Apple Inc
AAPL
QQ
14 Jul 2021 21:18, UTC
Last Price Fair Value Estimate Price/FVE Market Cap Economic Moat
TM
Moat Trend
TM
Uncertainty Capital Allocation ESG Risk Rating Assessment
1
149.15 USD
14 Jul 2021
115.00 USD
29 Apr 2021 02:24, UTC
1.30
2.49 USD Tril
14 Jul 2021
Narrow Stable High Standard
;;;;;
7 Jul 2021 05:00, UTC
Price vs. Fair Value
0
50
100
150
200
Last Close: 149.15
Fair Value: 115.00
29 Apr 2021 02:24, UTC
Over Valued
Under Valued
2016 2017 2018 2019 2020 YTD
0.87 1.04 0.79 1.33 1.56 1.30 Price/Fair Value
12.15 48.24 -5.12 88.09 81.85 12.73 Total Return %
Morningstar Rating
Total Return % as of 14 Jul 2021. Last Close as of 14 Jul 2021. Fair Value as of 29 Apr 2021 02:24, UTC.
Contents
Business Description
Business Strategy & Outlook (30 Oct 2020)
Bulls Say / Bears Say (28 Apr 2021)
Economic Moat (29 Oct 2020)
Fair Value and Profit Drivers (28 Apr 2021)
Risk and Uncertainty (29 Oct 2020)
Capital Allocation (4 Nov 2020)
Analyst Notes Archive
Financials
Research Methodology for Valuing Companies
Important Disclosure
The conduct of Morningstar’s analysts is governed by Code of Ethics/Code of
Conduct Policy, Personal Security Trading Policy (or an equivalent of), and
Investment Research Policy. For information regarding conflicts of interest, please
visit: http://global.morningstar.com/equitydisclosures.
The primary analyst covering this company does not own its stock.
1
The ESG Risk Rating Assessment is a representation of Sustainalytics’ ESG Risk
Rating.
Apple’s March Quarter Sales Driven to New Highs by Broad-
Based Strength, Especially iPhone and Mac
Business Strategy & Outlook Abhinav Davuluri, CFA, Sector Strategist, 30 Oct 2020
Apple’s competitive advantage stems from its ability to package hardware, software, services, and third-
party applications into sleek, intuitive, and appealing devices. This expertise enables the firm to capture
a premium on its hardware, unlike most of its peers. Despite its admirable reputation, loyal customer
base, and unique products, the consumer hardware space can be unforgiving to firms unable to
consistently satiate the customer’s appetite for more features. Given the short product cycles of Apple’s
products and army of firms targeting its dominance, we do not believe Apple has a wide economic
moat.
Switching costs and intangible assets support Apple's narrow moat. The firm enjoys stellar returns on its
devices by offering a unique user experience with its iOS ecosystem. Contrary to its peers in PCs and
smartphones that rely on open operating systems, Windows and Android, respectively, Apple’s walled
garden approach for its popular iOS allows it to charge a premium for relatively commoditized hardware
not too different from that sold by Samsung, Dell, and others. Customer switching costs are elevated for
Apple users as a non-Apple iOS experience does not exist, unlike computing platforms for the Windows
or Android ecosystems that boast PCs and smartphones from a multitude of firms.
We view the iPhone as a revolutionary product that created the smartphone ecosystem and transitioned

Morningstar Equity Analyst Report | Report as of 15 Jul 2021 15:25, UTC | Reporting Currency: USD | Trading Currency: USD | Exchange: NASDAQ
Page 2 of 19
© Morningstar 2021. All Rights Reserved. Unless otherwise provided in a separate agreement, you may use this report only in the country in which its original distributor is based. The information, data, analyses and
opinions presented herein do not constitute investment advice; are provided solely for informational purposes and therefore are not an offer to buy or sell a security; and are not warranted to be correct, complete or
accurate. The opinions expressed are as of the date written and are subject to change without notice. Except as otherwise required by law, Morningstar shall not be responsible for any trading decisions, damages or
other losses resulting from, or related to, the information, data, analyses or opinions or their use. The information contained herein is the proprietary property of Morningstar and may not be reproduced, in whole or in
part, or used in any manner, without the prior written consent of Morningstar. Investment research is produced and issued by subsidiaries of Morningstar, Inc. including, but not limited to, Morningstar Research
Services LLC, registered with and governed by the U.S. Securities and Exchange Commission. To order reprints, call +1 312-696-6100. To license the research, call +1 312-696-6869. Please see important disclosures at
the end of this report.
ß
®
Apple Inc
AAPL
QQ
14 Jul 2021 21:18, UTC
Last Price Fair Value Estimate Price/FVE Market Cap Economic Moat
TM
Moat Trend
TM
Uncertainty Capital Allocation ESG Risk Rating Assessment
1
149.15 USD
14 Jul 2021
115.00 USD
29 Apr 2021 02:24, UTC
1.30
2.49 USD Tril
14 Jul 2021
Narrow Stable High Standard
;;;;;
7 Jul 2021 05:00, UTC
computing habits away from the PC. The robust app store helped foster iPhone adoption and grow
Apple’s user base, with applications ranging from productivity, social media, gaming, music, and so on.
We foresee Apple's ongoing business coming from existing customers versus new smartphone
adopters. With hardware becoming increasingly commoditized and replacement cycles potentially
elongating in the long term, we expect Apple to focus on newer software and services to augment the
user experience and retain customers. The firm’s additional products and services (Apple Watch, iCloud,
Apple TV+, AirPods, Apple Pay) act as both supplemental revenue opportunities and, more importantly,
critical enhancements to the iOS ecosystem that support Apple’s crown jewel: the iPhone.
Bulls Say Abhinav Davuluri, CFA, Sector Strategist, 28 Apr 2021
u
Between greater smartphone penetration in emerging markets and repeat sales to current customers,
Apple has plenty of opportunity to reap the rewards of its iPhone business.
u
Apple's iPhone and iOS operating system have consistently been rated at the head of the pack in terms
of customer loyalty, engagement, and security, which bodes well for long-term customer retention.
u
We think Apple is still innovating with introductions of Apple Pay, Apple Watch, Apple TV, and AirPods;
each of these could drive incremental revenue, but more crucially help to retain iPhone users over time.
Bears Say Abhinav Davuluri, CFA, Sector Strategist, 28 Apr 2021
u
Apple’s decisions to maintain a premium pricing strategy may help fend off gross margin compression
but could limit unit sales growth, as devices may be unaffordable for many customers.
u
If Apple were to ever launch a buggy software update or subpar services, it could diminish the firm's
reputation for building products that "just work."
u
Apple is believed to be behind firms like Google and Amazon in artificial intelligence, or AI, development
(notably Siri voice recognition), which could be problematic as tech firms look to integrate AI in order to
deliver premium services to customers.
Economic Moat Abhinav Davuluri, CFA, Sector Strategist, 29 Oct 2020
We assign a narrow economic moat rating for Apple that stems from the combination of switching costs
and intangible assets. We think the firm's primary moat source is customer switching costs, as Apple
bolsters the user experience with a cohort of auxiliary products such as iPad, Apple TV, Apple Watch,
AirPods, and so on, and services (iMessage, FaceTime, Apple Pay) that augment Apple's sphere of
influence on the consumer. As current iPhone users are familiar with the iOS environment (Apple-centric
apps, services, and so on), it may take multiple subpar product releases to warrant an exodus to an
Android OS, as these customers are likely loath to leave Apple's seemingly superior walled garden.
Regarding intangible assets, Apple's differentiated user experience via iOS coupled with its expertise in
both hardware and software design allows the firm to more seamlessly build integrated products. We
see no other technology titan with comparable expertise in both hardware and software. In turn, we
Sector Industry
a Technology
Consumer Electronics
Business Description
Apple designs a wide variety of consumer electronic
devices, including smartphones (iPhone), tablets (iPad),
PCs (Mac), smartwatches (Apple Watch), and TV boxes
(Apple TV), among others. The iPhone makes up the
majority of Apple’s total revenue. In addition, Apple
offers its customers a variety of services such as Apple
Music, iCloud, Apple Care, Apple TV+, Apple Arcade,
Apple Card, and Apple Pay, among others. Apple's
products run internally developed software and
semiconductors, and the firm is well known for its
integration of hardware, software and services. Apple's
products are distributed online as well as through
company-owned stores and third-party retailers. The
company generates roughly 40% of its revenue from the
Americas, with the remainder earned internationally.
Morningstar Equity Analyst Report | Report as of 15 Jul 2021 15:25, UTC | Reporting Currency: USD | Trading Currency: USD | Exchange: NASDAQ
Page 3 of 19
© Morningstar 2021. All Rights Reserved. Unless otherwise provided in a separate agreement, you may use this report only in the country in which its original distributor is based. The information, data, analyses and
opinions presented herein do not constitute investment advice; are provided solely for informational purposes and therefore are not an offer to buy or sell a security; and are not warranted to be correct, complete or
accurate. The opinions expressed are as of the date written and are subject to change without notice. Except as otherwise required by law, Morningstar shall not be responsible for any trading decisions, damages or
other losses resulting from, or related to, the information, data, analyses or opinions or their use. The information contained herein is the proprietary property of Morningstar and may not be reproduced, in whole or in
part, or used in any manner, without the prior written consent of Morningstar. Investment research is produced and issued by subsidiaries of Morningstar, Inc. including, but not limited to, Morningstar Research
Services LLC, registered with and governed by the U.S. Securities and Exchange Commission. To order reprints, call +1 312-696-6100. To license the research, call +1 312-696-6869. Please see important disclosures at
the end of this report.
ß
®
Apple Inc
AAPL
QQ
14 Jul 2021 21:18, UTC
Last Price Fair Value Estimate Price/FVE Market Cap Economic Moat
TM
Moat Trend
TM
Uncertainty Capital Allocation ESG Risk Rating Assessment
1
149.15 USD
14 Jul 2021
115.00 USD
29 Apr 2021 02:24, UTC
1.30
2.49 USD Tril
14 Jul 2021
Narrow Stable High Standard
;;;;;
7 Jul 2021 05:00, UTC
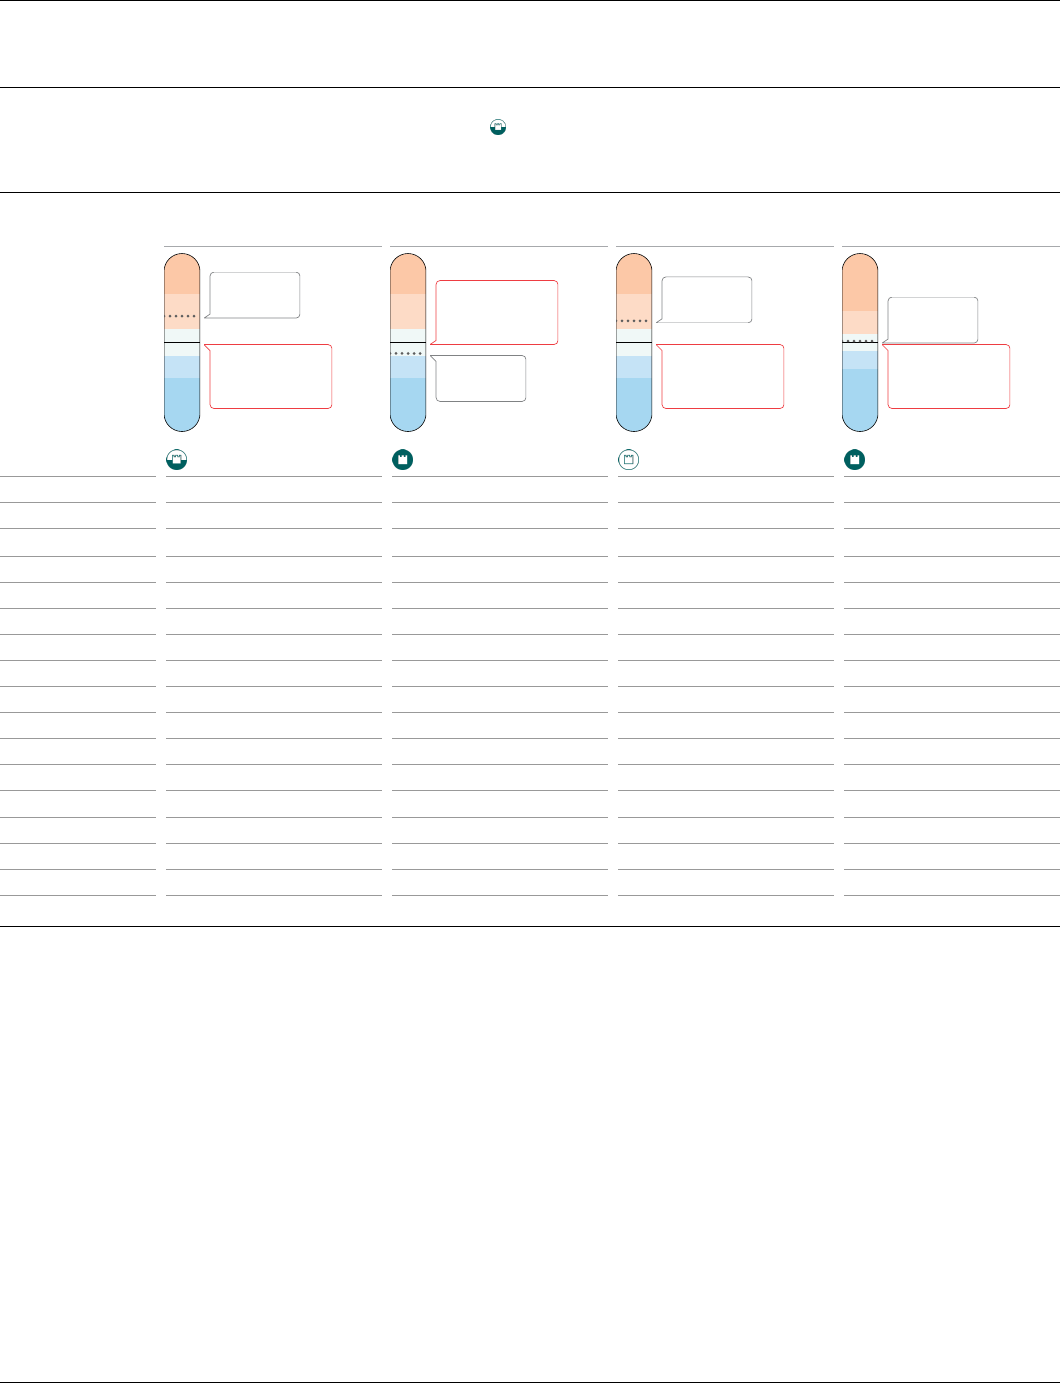
Competitors
Apple Inc AAPL Alphabet Inc Class A GOOGL HP Inc HPQ Microsoft Corp MSFT
Fair Value
115.00
Uncertainty : High
Last Close
149.15
Fair Value
2,925.00
Uncertainty : High
Last Close
2,564.74
Fair Value
23.00
Uncertainty : High
Last Close
28.59
Fair Value
278.00
Uncertainty : Medium
Last Close
282.51
Economic Moat Narrow Wide None Wide
Moat Trend Stable Stable Negative Stable
Currency USD USD USD USD
Fair Value 115.00 29 Apr 2021 02:24, UTC 2,925.00 28 Apr 2021 01:40, UTC 23.00 26 Feb 2021 05:50, UTC 278.00 28 Apr 2021 02:29, UTC
1-Star Price 178.25 4,533.75 35.65 375.30
5-Star Price 69.00 1,755.00 13.80 194.60
Assessment Over Valued 14 Jul 2021 Under Valued 14 Jul 2021 Over Valued 14 Jul 2021 Fairly Valued 14 Jul 2021
Morningstar Rating
QQ
14 Jul 2021 21:18, UTC
QQQQ
14 Jul 2021 21:18, UTC
QQ
14 Jul 2021 21:18, UTC
QQQ
14 Jul 2021 21:18, UTC
Analyst Abhinav Davuluri, Sector Strategist Ali Mogharabi, Senior Equity Analyst Mark Cash, Senior Equity Analyst Dan Romanoff, Equity Analyst
Capital Allocation Standard Standard Standard Exemplary
Price/Fair Value 1.30 0.88 1.24 1.02
Price/Sales 7.87 9.53 0.62 13.47
Price/Book 35.98 7.47 — 15.82
Price/Earning 33.37 34.18 10.14 38.49
Dividend Yield 0.56% — 2.65% 0.78%
Market Cap 2,488.96 Bil 1,743.68 Bil 34.34 Bil 2,127.75 Bil
52-Week Range 89.15—149.57 1,402.15—2,586.53 16.66—36.00 196.25—283.66
Investment Style Large Core Large Growth Mid Value Large Growth
believe this integration allows Apple to build industry-leading devices that command industry-leading
average selling prices, most notably the firm's crown jewel: the iPhone.
Recent survey data shows that iPhone customers are not even contemplating switching brands today.
In a December 2018 survey by Kantar, 90% of U.S.-based iPhone users said they planned to remain loyal
to future Apple devices. A recent survey (as of October 2020) from 451 Research indicates iPhone
customer satisfaction of 98% for iPhone 11, 11 Pro, and 11 Pro Max combined. Also, users of ancillary
products (especially the Watch and AirPods) lose significant functionality when paired with a
smartphone other than the iPhone. Ultimately, we believe that existing iPhone users are relatively
locked in to the iOS ecosystem and interface.
While the Android cohort has attempted to replicate a similar feel of apps, app stores, and integrated
experience, the fragmentation of its key players will likely prevent many loyal iOS users from switching,
at least over a few product cycles. Competitors such as Samsung (Galaxy smartphone) and Google
(Android OS) specialize in hardware and software, respectively, with Samsung boasting leadership in

Morningstar Equity Analyst Report | Report as of 15 Jul 2021 15:25, UTC | Reporting Currency: USD | Trading Currency: USD | Exchange: NASDAQ
Page 4 of 19
© Morningstar 2021. All Rights Reserved. Unless otherwise provided in a separate agreement, you may use this report only in the country in which its original distributor is based. The information, data, analyses and
opinions presented herein do not constitute investment advice; are provided solely for informational purposes and therefore are not an offer to buy or sell a security; and are not warranted to be correct, complete or
accurate. The opinions expressed are as of the date written and are subject to change without notice. Except as otherwise required by law, Morningstar shall not be responsible for any trading decisions, damages or
other losses resulting from, or related to, the information, data, analyses or opinions or their use. The information contained herein is the proprietary property of Morningstar and may not be reproduced, in whole or in
part, or used in any manner, without the prior written consent of Morningstar. Investment research is produced and issued by subsidiaries of Morningstar, Inc. including, but not limited to, Morningstar Research
Services LLC, registered with and governed by the U.S. Securities and Exchange Commission. To order reprints, call +1 312-696-6100. To license the research, call +1 312-696-6869. Please see important disclosures at
the end of this report.
ß
®
Apple Inc
AAPL
QQ
14 Jul 2021 21:18, UTC
Last Price Fair Value Estimate Price/FVE Market Cap Economic Moat
TM
Moat Trend
TM
Uncertainty Capital Allocation ESG Risk Rating Assessment
1
149.15 USD
14 Jul 2021
115.00 USD
29 Apr 2021 02:24, UTC
1.30
2.49 USD Tril
14 Jul 2021
Narrow Stable High Standard
;;;;;
7 Jul 2021 05:00, UTC
mobile device units and Google's Android OS serving as the pervasive smartphone OS. Although Apple's
low-double-digit market share in the smartphone space doesn't seem excessive, the firm does enjoy the
lion's share of industry profits. Neither Samsung nor Google has been able to offer a comprehensive and
integrated product like the iPhone, though both have attempted to develop software/operating systems
(Samsung's Tizen OS) and hardware (Google's Pixel smartphone), with mixed results. We believe Apple's
expertise in both hardware and software represents an intangible asset that even the strongest of tech
firms have struggled to replicate.
Although Apple's brand tends to be associated with premium technology gadgets, we don't think it can
support an economic moat in isolation. Specifically, Apple's brand strength is a consequence of its
differentiated hardware and software design, not the cause. We don't think Apple can charge twice the
price of a similar set of hardware solely by sticking an Apple logo on it. Similarly, we suspect that
Apple's brand equity will wane if the firm's products were technologically inferior to competitors over an
extended period of time. As evidence, Nokia was the eighth-most-valuable brand in the world as
recently as 2010, according to Interbrand, before succumbing to the rise of the smartphone.
The active installed base of Apple devices reached 1.5 billion at the end of 2019, up from 1.4 billion a
year prior, showing the strong stickiness Apple has created. However, these switching costs are not
insurmountable, illustrated by the rise and fall of former mobile device titans such as Nokia, Motorola,
and BlackBerry, all of which failed to keep up with smartphone innovation. The short product cycles for
phones and the inability of these firms to sufficiently innovate left each one struggling after the debut of
Apple's iPhone and its subsequent proliferation. Apple is not immune to these pitfalls, as consumer
sentiment for technology gadgets can be unforgiving, with one buggy or subpar product potentially
driving customers to other companies' offerings, which have been increasingly competitive. We have
often seen innovative features arise in the Android ecosystem before Apple, such as OLED screens and
3D sense. These industry dynamics prevent us from assigning a wide moat rating for Apple.
At this point, we do not consider network effects to be a key source of Apple's moat. We acknowledge
that Apple's iOS users gravitate to the App Store to purchase new applications, and the size of Apple's
installed base attracts developers to build new apps for iOS. Apple's integration of hardware and
software also supports its developer networks, as Apple knows that iOS will be loaded on to only a
handful of screen sizes or iPhone models, versus the hundreds of devices and manufacturers that
support Android. This leads to a more fragmented Android ecosystem, which we believe is relatively
harder for developers to support. Apple consistently touts when the majority of its user base is on the
latest operating system, which in turn allows developers to build for the latest version of iOS and know
that their apps are optimized for most of Apple's user base. Nonetheless, the Google Play store that
supports the Android user base also achieves a similar network effect. Ultimately, we view the
hardware and software (device and iOS) as the key differentiators for Apple's moat sources (switching

Morningstar Equity Analyst Report | Report as of 15 Jul 2021 15:25, UTC | Reporting Currency: USD | Trading Currency: USD | Exchange: NASDAQ
Page 5 of 19
© Morningstar 2021. All Rights Reserved. Unless otherwise provided in a separate agreement, you may use this report only in the country in which its original distributor is based. The information, data, analyses and
opinions presented herein do not constitute investment advice; are provided solely for informational purposes and therefore are not an offer to buy or sell a security; and are not warranted to be correct, complete or
accurate. The opinions expressed are as of the date written and are subject to change without notice. Except as otherwise required by law, Morningstar shall not be responsible for any trading decisions, damages or
other losses resulting from, or related to, the information, data, analyses or opinions or their use. The information contained herein is the proprietary property of Morningstar and may not be reproduced, in whole or in
part, or used in any manner, without the prior written consent of Morningstar. Investment research is produced and issued by subsidiaries of Morningstar, Inc. including, but not limited to, Morningstar Research
Services LLC, registered with and governed by the U.S. Securities and Exchange Commission. To order reprints, call +1 312-696-6100. To license the research, call +1 312-696-6869. Please see important disclosures at
the end of this report.
ß
®
Apple Inc
AAPL
QQ
14 Jul 2021 21:18, UTC
Last Price Fair Value Estimate Price/FVE Market Cap Economic Moat
TM
Moat Trend
TM
Uncertainty Capital Allocation ESG Risk Rating Assessment
1
149.15 USD
14 Jul 2021
115.00 USD
29 Apr 2021 02:24, UTC
1.30
2.49 USD Tril
14 Jul 2021
Narrow Stable High Standard
;;;;;
7 Jul 2021 05:00, UTC
costs and intangible assets), since the lion's share of applications used by smartphone users are
platform-agnostic, in our view. Even for apps built for iOS first before Android (with the popular video
game Fortnite being one recent example), mobile apps are ultimately built for both platforms in short
order.
Finally, Apple may boast some cost advantages associated with its supply chain, such as pressuring
suppliers or making massive purchases of memory, flash storage, and other key components. However,
these advantages are predicated on the immense forecast volume of Apple's products, and we surmise
these advantages would evaporate if Apple's device production were to diminish. Apple likely could not
build the lowest cost phone in the industry as it has to build iOS, rather than use Android for free. More
important, this is likely a moot point as we think Apple will play at the high end of the market with best-
of-breed components for the foreseeable future—it's been doing so with the Mac for 40 years and
counting.
Fair Value and Profit Drivers Abhinav Davuluri, CFA, Sector Strategist, 28 Apr 2021
Our fair value estimate is $115 per share. Our estimate implies a forward GAAP P/E ratio of 22 times. In
fiscal 2021, we expect total revenue to be up 31% thanks to strength in Mac and iPad sales related to
work- and learning-from-home trends and the 5G iPhone 12 launch. With the iPhone 12 coming out in
October 2020 (fiscal first-quarter 2021) instead of September 2020 (fiscal fourth-quarter 2020), we think
Apple is poised for strong iPhone sales in the first half of fiscal 2021. We expect services to grow at a
11% CAGR over the next five years, while wearables also maintains strong double-digit growth.
Following a robust growth year in fiscal 2021, we believe iPhone sales will record modest growth, with
double-digit services growth driving total revenue growth in the mid-single digits.
We expect gross margins to remain in the high-30s, thanks to Apple’s exceptional premium pricing
strategy and stable iPhone margins. The firm recently began disclosing product and services gross
margins, and we anticipate product gross margins tracking in the low-30s and services gross margins
hovering around 65%. Although we think the higher-margin services segment will grow nicely, we
foresee lower-margin other products, such as the Apple Watch, serving as an offset. However, these
other products remain vital to Apple being able to lock in iPhone customers with the likes of AirPods,
Watches, and other accessories that sell at a notable premium to non-Apple counterparts. The shift to
internally designed ARM-based chips in lieu of chips from Intel for Apple's Mac PCs should help improve
Mac margins. To remain king of the hill in the premium smartphone market, we model higher research
and spending as Apple drives innovation and potentially ventures into new frontiers. We expect
operating margins to remain in the mid-20s.
Risk and Uncertainty Abhinav Davuluri, CFA, Sector Strategist, 29 Oct 2020
As one of the largest firms in the world, Apple is susceptible to competitive threats from capable

Morningstar Equity Analyst Report | Report as of 15 Jul 2021 15:25, UTC | Reporting Currency: USD | Trading Currency: USD | Exchange: NASDAQ
Page 6 of 19
© Morningstar 2021. All Rights Reserved. Unless otherwise provided in a separate agreement, you may use this report only in the country in which its original distributor is based. The information, data, analyses and
opinions presented herein do not constitute investment advice; are provided solely for informational purposes and therefore are not an offer to buy or sell a security; and are not warranted to be correct, complete or
accurate. The opinions expressed are as of the date written and are subject to change without notice. Except as otherwise required by law, Morningstar shall not be responsible for any trading decisions, damages or
other losses resulting from, or related to, the information, data, analyses or opinions or their use. The information contained herein is the proprietary property of Morningstar and may not be reproduced, in whole or in
part, or used in any manner, without the prior written consent of Morningstar. Investment research is produced and issued by subsidiaries of Morningstar, Inc. including, but not limited to, Morningstar Research
Services LLC, registered with and governed by the U.S. Securities and Exchange Commission. To order reprints, call +1 312-696-6100. To license the research, call +1 312-696-6869. Please see important disclosures at
the end of this report.
ß
®
Apple Inc
AAPL
QQ
14 Jul 2021 21:18, UTC
Last Price Fair Value Estimate Price/FVE Market Cap Economic Moat
TM
Moat Trend
TM
Uncertainty Capital Allocation ESG Risk Rating Assessment
1
149.15 USD
14 Jul 2021
115.00 USD
29 Apr 2021 02:24, UTC
1.30
2.49 USD Tril
14 Jul 2021
Narrow Stable High Standard
;;;;;
7 Jul 2021 05:00, UTC
behemoths with significant resources. Over the course of its iPhone-fueled decade of dominance,
Samsung, Microsoft, Google, and others have taken their best shots at Apple, with fleeting success.
Consumer hardware is inherently prone to cutthroat competition as short-product cycles and customers
hungry for greater features make market leadership difficult to sustain. Although Apple has done well
with its walled garden approach with iOS, the firm competes with Chinese OEMs at the low and midtier
as well as tech titans such as Samsung across the entire spectrum of smartphones.
Furthermore, we suspect that many customers are holding on to their phones longer as premium
devices are more than good enough for today’s needs (web browsing, media streaming, social media)
and potentially tomorrow’s (virtual/augmented reality). Analogous to the decline of PCs (with current
PCs more than adequate for most applications), Apple faces the possibility of smartphone unit
stagnation or even declines once emerging markets saturate or consumers gravitate to mid-tier devices.
Should it be unable to innovate, the firm may lose its ability to charge premium prices for hardware that
is no longer indistinguishable from many comparable devices.
Some competitors are willing to sell hardware at essentially cost to drive revenue or stickiness in other
business segments. A notable example is Amazon with its multitude of products including its Echo smart
speaker, Fire TV, Prime Music, Kindle Fire, and Prime Video to attract and retain Prime customers.
Should these devices supersede their iOS counterparts, Apple's devices may be at risk. A recent focus
on AI assistants such as Google Now and Amazon Alexa has also put pressure on Apple’s Siri that has
fallen behind its peers in efficacy. Herein lies another area Apple may face headwinds if consumers
further prioritize voice-recognition capabilities.
Capital Allocation Abhinav Davuluri, CFA, Sector Strategist, 4 Nov 2020
We view Apple’s stewardship rating as Standard. Tim Cook became CEO in August 2011 after
cofounder, longtime CEO, and visionary Steve Jobs stepped down from the CEO role before passing
away in October 2011. Cook was considered Jobs' right-hand man and served in various operations
roles with Apple before becoming COO in 2005. Although Jobs' death was a blow to the firm, as he was
a one-of-a-kind leader and creative mind, Apple is not lacking in capable leaders. Arthur Levinson,
former chairman and CEO of Genentech, is chairman of Apple's board of directors. Jeff Williams serves
as COO of Apple and would be our best bet to replace Cook as CEO.
We think Apple’s recent level of technological innovation has been adequate, though it has likely faced
an unreasonably high bar for expectations after the debut of the iPhone. Many of the firm’s recent
innovations have been in software and services within iOS such as Apple Pay, as well as under-the-
hood improvements in semiconductors, rather than revolutionary, ubiquitous devices like the iPod or
iPhone. We like how the firm designs its own chips for the CPU and artificial intelligence (A-series bionic
neural engine), as this can create a better user experience since Apple also designs the operating
system and can appropriately tailor the CPU or neural engine to its needs. Going forward, we expect the

Morningstar Equity Analyst Report | Report as of 15 Jul 2021 15:25, UTC | Reporting Currency: USD | Trading Currency: USD | Exchange: NASDAQ
Page 7 of 19
© Morningstar 2021. All Rights Reserved. Unless otherwise provided in a separate agreement, you may use this report only in the country in which its original distributor is based. The information, data, analyses and
opinions presented herein do not constitute investment advice; are provided solely for informational purposes and therefore are not an offer to buy or sell a security; and are not warranted to be correct, complete or
accurate. The opinions expressed are as of the date written and are subject to change without notice. Except as otherwise required by law, Morningstar shall not be responsible for any trading decisions, damages or
other losses resulting from, or related to, the information, data, analyses or opinions or their use. The information contained herein is the proprietary property of Morningstar and may not be reproduced, in whole or in
part, or used in any manner, without the prior written consent of Morningstar. Investment research is produced and issued by subsidiaries of Morningstar, Inc. including, but not limited to, Morningstar Research
Services LLC, registered with and governed by the U.S. Securities and Exchange Commission. To order reprints, call +1 312-696-6100. To license the research, call +1 312-696-6869. Please see important disclosures at
the end of this report.
ß
®
Apple Inc
AAPL
QQ
14 Jul 2021 21:18, UTC
Last Price Fair Value Estimate Price/FVE Market Cap Economic Moat
TM
Moat Trend
TM
Uncertainty Capital Allocation ESG Risk Rating Assessment
1
149.15 USD
14 Jul 2021
115.00 USD
29 Apr 2021 02:24, UTC
1.30
2.49 USD Tril
14 Jul 2021
Narrow Stable High Standard
;;;;;
7 Jul 2021 05:00, UTC
firm to also design its own GPU, which should enable performance differentiation.
Products like the Apple Watch, AppleTV, AirPods and HomePod don’t move the needle in isolation, but
should drive incremental earnings growth to Apple. More importantly, these products will make it more
challenging for iPhone users to leave the iOS ecosystem, in our view. Although the Apple Watch has
had mixed results at the outset, we don’t view it as a miss just yet, given similar slow starts for the iPad
and iPhone.
Although Apple maintains sterling brand recognition and has 1.5 billion active devices (as of December
2019), it has made a few missteps under Cook that skeptics would argue wouldn’t have happened
under Jobs. Apple made a poor decision to part ways with Google Maps in iOS 6 and launch Apple
Maps with a bevy of bugs and errors, leading to a formal apology. More recently, Apple is being
investigated by the U.S. government as the firm purposefully slowed down iOS on older devices. While
the firm claims that it was to protect the user from sudden phone shutdowns, many fear that Apple was
implementing planned obsolescence of their devices, in order to get customers to upgrade.
In terms of capital allocation, we applaud Cook's decision to initiate dividend and stock buyback
programs, as well as take on debt in order to fund such programs when most of its cash was trapped
overseas. As of September 2020, Apple was authorized to purchase up to $225 billion of stock through
its share repurchase program, of which $168.6 billion had been utilized. Apple continues to strive to
achieve a net cash neutral position over time.
Perhaps more important, we think Apple's frugality in terms of acquisitions is quite admirable. Apple's
strategy of focusing on smaller, tuck-in deals and developing products in house, rather than splashy but
questionable deals like Microsoft's purchase of Skype or Google's foray into hardware by acquiring
Motorola Mobility and Nest, appears to have served investors quite well in recent years. Even Apple's
$3.0 billion acquisition of Beats Music and Beats Electronics represented only a tiny portion of the firm's
total cash balance.
Apple has also done a good job of attracting topnotch talent to the company, such as former Burberry
CEO Angela Ahrendts to run Apple’s retail and online stores. However, we note Ahrendts recently
stepped down with head of HR Deirdre O'Brien taking over the role. We are comfortable that these hires
have strengthened Apple’s bench in the unlikely event of Cook departing the company, and each hire
likely has aided in Apple’s efforts to build and deliver the Apple Watch and perhaps future products as
well. All the while, Apple’s ongoing operations continue to generate operating margins and cash flow
well above its peers in various hardware industries, which bodes well for future free cash flow for
investors.
In July 2019, Intel announced it agreed to sell its 5G smartphone modem business to Apple for $1

Morningstar Equity Analyst Report | Report as of 15 Jul 2021 15:25, UTC | Reporting Currency: USD | Trading Currency: USD | Exchange: NASDAQ
Page 8 of 19
© Morningstar 2021. All Rights Reserved. Unless otherwise provided in a separate agreement, you may use this report only in the country in which its original distributor is based. The information, data, analyses and
opinions presented herein do not constitute investment advice; are provided solely for informational purposes and therefore are not an offer to buy or sell a security; and are not warranted to be correct, complete or
accurate. The opinions expressed are as of the date written and are subject to change without notice. Except as otherwise required by law, Morningstar shall not be responsible for any trading decisions, damages or
other losses resulting from, or related to, the information, data, analyses or opinions or their use. The information contained herein is the proprietary property of Morningstar and may not be reproduced, in whole or in
part, or used in any manner, without the prior written consent of Morningstar. Investment research is produced and issued by subsidiaries of Morningstar, Inc. including, but not limited to, Morningstar Research
Services LLC, registered with and governed by the U.S. Securities and Exchange Commission. To order reprints, call +1 312-696-6100. To license the research, call +1 312-696-6869. Please see important disclosures at
the end of this report.
ß
®
Apple Inc
AAPL
QQ
14 Jul 2021 21:18, UTC
Last Price Fair Value Estimate Price/FVE Market Cap Economic Moat
TM
Moat Trend
TM
Uncertainty Capital Allocation ESG Risk Rating Assessment
1
149.15 USD
14 Jul 2021
115.00 USD
29 Apr 2021 02:24, UTC
1.30
2.49 USD Tril
14 Jul 2021
Narrow Stable High Standard
;;;;;
7 Jul 2021 05:00, UTC
billion. This is the second largest acquisition by Apple (after Beats for $3 billion in 2014). We had been
expecting such a deal since Intel announced its plans to exit the 5G modem business following the
resolution of the dispute between Apple and Qualcomm earlier in 2019. We believe this deal validates
Apple’s strategy of trying to bring as much chip development in-house as feasible, though we don’t
expect the firm to replace Qualcomm’s 5G modems in future iPhones for at least a few years.
Analyst Notes Archive
Corporate Tax Hikes Are Very Likely to Come for U.S. Equities Preston Caldwell, Equity Analyst, 11
May 2021
We expect a U.S. corporate tax hike to be passed this year. Our probability-weighted forecast is an
increase in the statutory tax rate to 26% from 21% currently. Our equity analysts will be incorporating
the new tax rate into their valuation models over the coming weeks, but our preliminary analysis
suggests a mid-single-digit impact to the average U.S. equity valuation.
President Joe Biden has unveiled a $2 trillion infrastructure plan that he plans to pay for largely with
increases in corporate taxes. While there are other plausible sources of revenue, these will likely be
needed for other spending priorities, so we believe there is a high probability that Congress will pass an
increase in corporate taxes this year, effective in 2022.
Biden's proposal is to increase the corporate tax rate to 28% from the current 21% (but below the 35%
before the Tax Cuts and Jobs Act of 2017). Our probability-weighted estimate is a new corporate
business tax rate of 26%, which incorporates an 80% probability that any tax increase is passed at all.
Conditional on an increase passing, we've penciled in an 80% probability that Biden's proposed 28% is
passed versus a 20% probability that the increase is limited to 25%.
We’ve simulated the impact of various tax rate changes on valuations for our covered U.S. equities. For
the average U.S. equity, the impact of the statutory tax rate increase to 26% from 21% generates a 2.7%
fall in valuation. If rates increase to the full 28% as proposed, that generates a 3.8% fall in valuation.
Apple’s March Quarter Sales Driven to New Highs by Broad-Based Strength; Raising FVE to $115
Abhinav Davuluri, CFA, Sector Strategist, 29 Apr 2021
Apple reported fiscal second quarter results ahead of our expectations, led by the iPhone segment. The
firm did not provide guidance the last four quarters and once more refrained from offering specific
financial expectations due to uncertainty regarding COVID-19. Apple’s iPhone revenue grew 66% year
over year to $47.9 billion, thanks to the new 5G iPhone 12 family. Although we anticipate strong double-
digit iPhone growth in 2021, we think growth rates will moderate in the coming years. We are raising
our fair value estimate for narrow-moat Apple to $115 per share from $98 as we incorporate a stronger
near-term outlook due to the current 5G iPhone cycle and ongoing work- and learning-from-home

Morningstar Equity Analyst Report | Report as of 15 Jul 2021 15:25, UTC | Reporting Currency: USD | Trading Currency: USD | Exchange: NASDAQ
Page 9 of 19
© Morningstar 2021. All Rights Reserved. Unless otherwise provided in a separate agreement, you may use this report only in the country in which its original distributor is based. The information, data, analyses and
opinions presented herein do not constitute investment advice; are provided solely for informational purposes and therefore are not an offer to buy or sell a security; and are not warranted to be correct, complete or
accurate. The opinions expressed are as of the date written and are subject to change without notice. Except as otherwise required by law, Morningstar shall not be responsible for any trading decisions, damages or
other losses resulting from, or related to, the information, data, analyses or opinions or their use. The information contained herein is the proprietary property of Morningstar and may not be reproduced, in whole or in
part, or used in any manner, without the prior written consent of Morningstar. Investment research is produced and issued by subsidiaries of Morningstar, Inc. including, but not limited to, Morningstar Research
Services LLC, registered with and governed by the U.S. Securities and Exchange Commission. To order reprints, call +1 312-696-6100. To license the research, call +1 312-696-6869. Please see important disclosures at
the end of this report.
ß
®
Apple Inc
AAPL
QQ
14 Jul 2021 21:18, UTC
Last Price Fair Value Estimate Price/FVE Market Cap Economic Moat
TM
Moat Trend
TM
Uncertainty Capital Allocation ESG Risk Rating Assessment
1
149.15 USD
14 Jul 2021
115.00 USD
29 Apr 2021 02:24, UTC
1.30
2.49 USD Tril
14 Jul 2021
Narrow Stable High Standard
;;;;;
7 Jul 2021 05:00, UTC
dynamics bolstering Mac and iPad segments. Nonetheless, we think shares are currently overvalued, as
we think recent growth trends could be unsustainable past 2021.
Second quarter revenue was up 54% year over year thanks to growth in iPhone (66%), iPad (79%), Mac
(70%), services (27%), and wearables, home, and accessories (25%). We note the iPhone segment
benefited from a delayed iPhone 12 launch and all segments faced an easier year-over-year compare
due to the March 2020 quarter being negatively impacted by COVID-19. On the services front, Apple
now enjoys over 660 million paid subscribers to its various services, up 145 million from a year ago.
Greater China sales were up 88% year over year, which we attribute primarily to the new 5G iPhone.
Gross margin of 42.5% was up 270 basis points sequentially due to a strong product mix and favorable
foreign exchange rates.
Management anticipates strong double-digit year over-year-growth for the June quarter, though the
seasonal sequential decline from the March quarter will be greater than prior years. Meanwhile, supply
constraints are expected to have a $3 billion to $4 billion negative impact on sales in the June quarter.
Apple’s iPhone 12 Launch Propels December Quarter Sales to Record Heights; Raising FVE to $98
Abhinav Davuluri, CFA, Sector Strategist, 28 Jan 2021
Apple reported fiscal first-quarter results ahead of our expectations led by the iPhone segment. The firm
did not provide guidance the last three quarters and once more refrained from offering specific financial
expectations due to uncertainty regarding COVID-19. Apple’s iPhone revenue grew 17% year over year
to a quarterly record $65.6 billion, thanks to the new 5G iPhone 12 family. Although we anticipate
strong double-digit iPhone growth in 2021, we think growth rates will moderate in the coming years.
We are raising our fair value estimate for narrow-moat Apple to $98 per share from $85 as we
incorporate a stronger near-term outlook due to the current 5G iPhone cycle and ongoing work- and
learning-from-home dynamics bolstering Mac and iPad segments. Nonetheless, we think shares are
currently overvalued, as we think recent growth trends could be unsustainable past 2021.
First-quarter revenue was up 21% year over year thanks to growth in iPhone (17%), iPad (41%), Mac
(21%), services (24%), and wearables, home, and accessories (30%). Apple’s active installed base of
iPhones is now over 1 billion, while its overall installed base of active devices surpassed 1.65 billion
during the quarter. On the services front, Apple now enjoys over 620 million paid subscribers to its
various services, up 140 million from a year ago. Greater China sales were up 57% year over year, which
we attribute primarily to the new 5G iPhone, though management was adamant their iPad and Mac
units also fared well in the region. Gross margin of 39.8% was up 160 basis points sequentially due to a
higher mix of services and strong leverage from higher sales.
Management anticipates year-over-year growth for the March quarter, though the services business
faces a difficult year-over-year comparison. Meanwhile, we expect the Mac and iPad segments to begin

Morningstar Equity Analyst Report | Report as of 15 Jul 2021 15:25, UTC | Reporting Currency: USD | Trading Currency: USD | Exchange: NASDAQ
Page 10 of 19
© Morningstar 2021. All Rights Reserved. Unless otherwise provided in a separate agreement, you may use this report only in the country in which its original distributor is based. The information, data, analyses and
opinions presented herein do not constitute investment advice; are provided solely for informational purposes and therefore are not an offer to buy or sell a security; and are not warranted to be correct, complete or
accurate. The opinions expressed are as of the date written and are subject to change without notice. Except as otherwise required by law, Morningstar shall not be responsible for any trading decisions, damages or
other losses resulting from, or related to, the information, data, analyses or opinions or their use. The information contained herein is the proprietary property of Morningstar and may not be reproduced, in whole or in
part, or used in any manner, without the prior written consent of Morningstar. Investment research is produced and issued by subsidiaries of Morningstar, Inc. including, but not limited to, Morningstar Research
Services LLC, registered with and governed by the U.S. Securities and Exchange Commission. To order reprints, call +1 312-696-6100. To license the research, call +1 312-696-6869. Please see important disclosures at
the end of this report.
ß
®
Apple Inc
AAPL
QQ
14 Jul 2021 21:18, UTC
Last Price Fair Value Estimate Price/FVE Market Cap Economic Moat
TM
Moat Trend
TM
Uncertainty Capital Allocation ESG Risk Rating Assessment
1
149.15 USD
14 Jul 2021
115.00 USD
29 Apr 2021 02:24, UTC
1.30
2.49 USD Tril
14 Jul 2021
Narrow Stable High Standard
;;;;;
7 Jul 2021 05:00, UTC
decelerating in a few quarters, following a stretch of robust growth due to COVID-19-related working-
and learning-from-home.
Apple’s Mac and iPad Sales Remain Bolstered by Work-From-Home Trend in Q4; Raising FVE to $85
Abhinav Davuluri, CFA, Sector Strategist, 30 Oct 2020
Apple reported fiscal fourth-quarter results ahead of our expectations led by Mac and iPad segments.
The firm did not provide guidance the last two quarters and again refrained from offering specific
guidance due to uncertainty regarding COVID-19. CEO Tim Cook expects iPhone revenue to grow in the
December quarter despite the new iPhone 12 being launched a couple of weeks later in the quarter,
though he did not specify the magnitude of growth. Meanwhile, all other products and services are
expected to grow in the double digits.
We are raising our fair value estimate for narrow-moat Apple to $85 per share from $71 as we
incorporate a stronger near-term outlook for the Mac and iPad segments due to ongoing work- and
learning-from-home dynamics. Nonetheless, we think shares are currently overvalued, as we think
recent growth trends could be unsustainable as we enter 2021.
Fourth-quarter revenue was up 1% year over year thanks to growth in iPad (46%), Mac (29%), services
(16%), and wearables, home, and accessories (21%). Management noted the iPad and Mac segments
remained supply constrained, which bodes well for these business lines in the December quarter.
Apple’s iPhone sales were understandably down 21% year over year due to the iPhone 12 delay. Apple
now has over 585 million paid subscribers to its various services, up 135 million from a year ago, and the
firm expects 600 million subs by Dec 2020. Although Greater China was the region most impacted by the
absence of the new iPhones for the quarter (total revenue down 29% year over year), non-iPhone sales
grew double digits. Gross margin of 38.2% was up 20 basis points sequentially due to a higher mix of
services.
Management was optimistic revenue from Greater China would grow in the first quarter, particularly as
5G is more mature in the region. We anticipate iPhone revenue for fiscal 2021 will be up in the low
teens, though the late launch may shift some sales from the December quarter to the March quarter.
Apple Launches 5G iPhone As Expected; Other Enhancements Relatively Lackluster; No Change to
FVE Abhinav Davuluri, CFA, Sector Strategist, 14 Oct 2020
On Oct. 13, Apple held its annual product showcase, where the firm announced the launch of four new
iPhone models: the iPhone 12, iPhone 12 mini, iPhone 12 Pro, and iPhone 12 Pro Max. All devices in the
“12” family are 5G-compatible. The base iPhone 12 model was priced at $799, which is $100 more
expensive than the equivalent iPhone 11 launched in 2019, which we attribute to the costly 5G modem
and RF content. Taking the $699 slot is the smaller iPhone 12 mini with a 5.4” screen. While we suspect

Morningstar Equity Analyst Report | Report as of 15 Jul 2021 15:25, UTC | Reporting Currency: USD | Trading Currency: USD | Exchange: NASDAQ
Page 11 of 19
© Morningstar 2021. All Rights Reserved. Unless otherwise provided in a separate agreement, you may use this report only in the country in which its original distributor is based. The information, data, analyses and
opinions presented herein do not constitute investment advice; are provided solely for informational purposes and therefore are not an offer to buy or sell a security; and are not warranted to be correct, complete or
accurate. The opinions expressed are as of the date written and are subject to change without notice. Except as otherwise required by law, Morningstar shall not be responsible for any trading decisions, damages or
other losses resulting from, or related to, the information, data, analyses or opinions or their use. The information contained herein is the proprietary property of Morningstar and may not be reproduced, in whole or in
part, or used in any manner, without the prior written consent of Morningstar. Investment research is produced and issued by subsidiaries of Morningstar, Inc. including, but not limited to, Morningstar Research
Services LLC, registered with and governed by the U.S. Securities and Exchange Commission. To order reprints, call +1 312-696-6100. To license the research, call +1 312-696-6869. Please see important disclosures at
the end of this report.
ß
®
Apple Inc
AAPL
QQ
14 Jul 2021 21:18, UTC
Last Price Fair Value Estimate Price/FVE Market Cap Economic Moat
TM
Moat Trend
TM
Uncertainty Capital Allocation ESG Risk Rating Assessment
1
149.15 USD
14 Jul 2021
115.00 USD
29 Apr 2021 02:24, UTC
1.30
2.49 USD Tril
14 Jul 2021
Narrow Stable High Standard
;;;;;
7 Jul 2021 05:00, UTC
the 5G capability and updated cameras (the Pro variant boasts a LIDAR scanner to autofocus in low-
light) will be major draws for many customers, we think market expectations for iPhone sales in the
coming quarters may be too aggressive. We are maintaining our $71 fair value estimate for narrow-
moat Apple, and we view shares as overvalued at current levels.
Battery life continued to expand, thanks to the new A14 Bionic chip, which is manufactured on TSMC’s
5-nanometer process technology that leverages EUV lithography. For the A14, Apple claims a 50%
performance advantage over any other competing mobile chip, though we were surprised by a lack of
color on power efficiency. For 5G, the firm claimed up to 4Gbps download and 200Mbps upload speeds
in ideal conditions. We doubt most users will experience these speeds anytime soon, as the 5G ramp is
still in the early innings.
The iPhone 12 Pro and 12 Pro Max will start at $999 and $1,099, respectively, in line with the starting
prices of their equivalents from 2019. The Pro models both feature larger screens than their
predecessors, with the Pro and Pro Max going from 5.8” and 6.1” to 6.5” and 6.7”, respectively. The Pro
has three cameras (ultra-wide, wide, and telephoto), with the Pro Max having even better cameras. The
emphasis on camera features is consistent with other Android-based smartphone vendors that have
been also adding additional cameras and claiming superiority to Apple devices in the picture quality
department.
With New iPhone Delayed Until October, Apple Launches New Watch and iPad at Annual Event
Abhinav Davuluri, CFA, Sector Strategist, 15 Sep 2020
On Sept. 15, Apple held its annual product showcase where it announced the launch of a new Apple
Watch and iPad. The iPhone was notably absent from the event, as COVID-19-related delays have
pushed back the launch of Apple’s crown jewel to October. On the services front, the firm detailed its
Apple One offering that bundles iCloud, Apple Music, TV+, Arcade, News+, and Fitness+ for $29.95 per
month (and a skinnier version without Fitness and News at $14.95). We expect the firm to continue
pushing the “as-a-service” model for both its products and software to solidify its recurring revenue
streams. Our fair value estimate remains $71 per share for the firm. While narrow-moat Apple remains
well positioned in the near term given the upcoming 5G iPhone and stronger outlook for Mac and iPad
segments due to the ongoing work- and learning-from-home dynamics, we recommend prospective
investors wait for a wider margin of safety before investing in Apple.
The Apple Watch Series 6 was the first product discussed, with the most noteworthy feature being its
ability to measure blood oxygen levels using both red and infrared light. The new watch includes a new
S6 processor with up to 20% faster performance relative to the prior generation. The price point is the
same as the last variant: starting at $399 with the cellular model at $499. Similar to the cheaper iPhone
SE, Apple also announced an Apple Watch SE starting at $279. We expect these new products to help
Apple sustain its recent stretch of double-digit wearables growth.

Morningstar Equity Analyst Report | Report as of 15 Jul 2021 15:25, UTC | Reporting Currency: USD | Trading Currency: USD | Exchange: NASDAQ
Page 12 of 19
© Morningstar 2021. All Rights Reserved. Unless otherwise provided in a separate agreement, you may use this report only in the country in which its original distributor is based. The information, data, analyses and
opinions presented herein do not constitute investment advice; are provided solely for informational purposes and therefore are not an offer to buy or sell a security; and are not warranted to be correct, complete or
accurate. The opinions expressed are as of the date written and are subject to change without notice. Except as otherwise required by law, Morningstar shall not be responsible for any trading decisions, damages or
other losses resulting from, or related to, the information, data, analyses or opinions or their use. The information contained herein is the proprietary property of Morningstar and may not be reproduced, in whole or in
part, or used in any manner, without the prior written consent of Morningstar. Investment research is produced and issued by subsidiaries of Morningstar, Inc. including, but not limited to, Morningstar Research
Services LLC, registered with and governed by the U.S. Securities and Exchange Commission. To order reprints, call +1 312-696-6100. To license the research, call +1 312-696-6869. Please see important disclosures at
the end of this report.
ß
®
Apple Inc
AAPL
QQ
14 Jul 2021 21:18, UTC
Last Price Fair Value Estimate Price/FVE Market Cap Economic Moat
TM
Moat Trend
TM
Uncertainty Capital Allocation ESG Risk Rating Assessment
1
149.15 USD
14 Jul 2021
115.00 USD
29 Apr 2021 02:24, UTC
1.30
2.49 USD Tril
14 Jul 2021
Narrow Stable High Standard
;;;;;
7 Jul 2021 05:00, UTC
On the iPad front, the firm updated its entry-level variant starting at $329 as well as the iPad Air with its
latest A14 Bionic processor (made on TSMC’s 5-nanometer process) and starting at $599. In addition to
the normal performance hike (40% from prior generation), Apple is also embracing USB-C for its charge
port (similar to the iPad Pro). K

Morningstar Equity Analyst Report | Report as of 15 Jul 2021 15:25, UTC | Reporting Currency: USD | Trading Currency: USD | Exchange: NASDAQ
Page 13 of 19
© Morningstar 2021. All Rights Reserved. Unless otherwise provided in a separate agreement, you may use this report only in the country in which its original distributor is based. The information, data, analyses and
opinions presented herein do not constitute investment advice; are provided solely for informational purposes and therefore are not an offer to buy or sell a security; and are not warranted to be correct, complete or
accurate. The opinions expressed are as of the date written and are subject to change without notice. Except as otherwise required by law, Morningstar shall not be responsible for any trading decisions, damages or
other losses resulting from, or related to, the information, data, analyses or opinions or their use. The information contained herein is the proprietary property of Morningstar and may not be reproduced, in whole or in
part, or used in any manner, without the prior written consent of Morningstar. Investment research is produced and issued by subsidiaries of Morningstar, Inc. including, but not limited to, Morningstar Research
Services LLC, registered with and governed by the U.S. Securities and Exchange Commission. To order reprints, call +1 312-696-6100. To license the research, call +1 312-696-6869. Please see important disclosures at
the end of this report.
ß
®
Apple Inc
AAPL
QQ
14 Jul 2021 21:18, UTC
Competitors Price vs. Fair Value
Alphabet Inc Class A GOOGL
0
1000
2000
3000
4000
Fair Value: 2,925.00
28 Apr 2021 01:40, UTC
Last Close: 2,564.74
Over Valued
Under Valued
2016 2017 2018 2019 2020 YTD
0.94 0.96 0.80 1.03 0.89 0.88 Price/Fair Value
1.86 32.93 -0.80 28.18 30.85 46.34 Total Return %
Morningstar Rating
Total Return % as of 14 Jul 2021. Last Close as of 14 Jul 2021. Fair Value as of 28 Apr 2021 01:40, UTC.
HP Inc HPQ
0
10
20
30
40
Last Close: 28.59
Fair Value: 23.00
26 Feb 2021 05:50, UTC
Over Valued
Under Valued
2016 2017 2018 2019 2020 YTD
0.93 1.11 0.82 1.08 1.23 1.24 Price/Fair Value
29.60 45.20 0.13 3.65 23.17 17.84 Total Return %
Morningstar Rating
Total Return % as of 14 Jul 2021. Last Close as of 14 Jul 2021. Fair Value as of 26 Feb 2021 05:50, UTC.

Morningstar Equity Analyst Report | Report as of 15 Jul 2021 15:25, UTC | Reporting Currency: USD | Trading Currency: USD | Exchange: NASDAQ
Page 14 of 19
© Morningstar 2021. All Rights Reserved. Unless otherwise provided in a separate agreement, you may use this report only in the country in which its original distributor is based. The information, data, analyses and
opinions presented herein do not constitute investment advice; are provided solely for informational purposes and therefore are not an offer to buy or sell a security; and are not warranted to be correct, complete or
accurate. The opinions expressed are as of the date written and are subject to change without notice. Except as otherwise required by law, Morningstar shall not be responsible for any trading decisions, damages or
other losses resulting from, or related to, the information, data, analyses or opinions or their use. The information contained herein is the proprietary property of Morningstar and may not be reproduced, in whole or in
part, or used in any manner, without the prior written consent of Morningstar. Investment research is produced and issued by subsidiaries of Morningstar, Inc. including, but not limited to, Morningstar Research
Services LLC, registered with and governed by the U.S. Securities and Exchange Commission. To order reprints, call +1 312-696-6100. To license the research, call +1 312-696-6869. Please see important disclosures at
the end of this report.
ß
®
Apple Inc
AAPL
QQ
14 Jul 2021 21:18, UTC
Microsoft Corp MSFT
0
100
200
300
400
Last Close: 282.51
Fair Value: 278.00
28 Apr 2021 02:29, UTC
Over Valued
Under Valued
2016 2017 2018 2019 2020 YTD
0.99 0.96 0.78 1.02 0.95 1.02 Price/Fair Value
14.65 40.22 20.75 57.12 42.37 27.52 Total Return %
Morningstar Rating
Total Return % as of 14 Jul 2021. Last Close as of 14 Jul 2021. Fair Value as of 28 Apr 2021 02:29, UTC.

Morningstar Equity Analyst Report | Report as of 15 Jul 2021 15:25, UTC | Reporting Currency: USD | Trading Currency: USD | Exchange: NASDAQ
Page 15 of 19
© Morningstar 2021. All Rights Reserved. Unless otherwise provided in a separate agreement, you may use this report only in the country in which its original distributor is based. The information, data, analyses and
opinions presented herein do not constitute investment advice; are provided solely for informational purposes and therefore are not an offer to buy or sell a security; and are not warranted to be correct, complete or
accurate. The opinions expressed are as of the date written and are subject to change without notice. Except as otherwise required by law, Morningstar shall not be responsible for any trading decisions, damages or
other losses resulting from, or related to, the information, data, analyses or opinions or their use. The information contained herein is the proprietary property of Morningstar and may not be reproduced, in whole or in
part, or used in any manner, without the prior written consent of Morningstar. Investment research is produced and issued by subsidiaries of Morningstar, Inc. including, but not limited to, Morningstar Research
Services LLC, registered with and governed by the U.S. Securities and Exchange Commission. To order reprints, call +1 312-696-6100. To license the research, call +1 312-696-6869. Please see important disclosures at
the end of this report.
ß
®
Apple Inc
AAPL
QQ
14 Jul 2021 21:18, UTC
Last Price Fair Value Estimate Price/FVE Market Cap Economic Moat
TM
Moat Trend
TM
Uncertainty Capital Allocation ESG Risk Rating Assessment
1
149.15 USD
14 Jul 2021
115.00 USD
29 Apr 2021 02:24, UTC
1.30
2.49 USD Tril
14 Jul 2021
Narrow Stable High Standard
;;;;;
7 Jul 2021 05:00, UTC
Morningstar Historical Summary
Financials as of 31 Mar 2021
Fiscal Year, ends 30 Sep 2011 2012 2013 2014 2015 2016 2017 2018 2019 2020 YTD TTM
Revenue (USD Bil) 108 157 171 183 234 216 229 266 260 275 201 325
Revenue Growth % 66.0 44.6 9.2 7.0 27.9 -7.7 6.3 15.9 -2.0 5.5 33.9 21.4
EBITDA (USD Bil) 36 59 57 62 85 73 77 87 82 81 68 103
EBITDA Margin % 33.3 37.7 33.4 33.8 36.2 34.0 33.4 32.8 31.5 29.5 34.0 31.7
Operating Income (USD Bil) 34 55 49 53 71 60 61 71 64 66 61 89
Operating Margin % 31.2 35.3 28.7 28.7 30.5 27.8 26.8 26.7 24.6 24.2 30.4 27.3
Net Income (USD Bil) 26 42 37 40 53 46 48 60 55 57 52 76
Net Margin % 24.0 26.7 21.7 21.6 22.9 21.2 21.1 22.4 21.2 20.9 26.1 23.5
Diluted Shares Outstanding (Bil) 26 26 26 24 23 22 21 20 19 18 17 17
Diluted Earnings Per Share (USD) 0.99 1.58 1.42 1.61 2.31 2.08 2.30 2.98 2.97 3.28 3.08 4.47
Dividends Per Share (USD) 0.00 0.09 0.41 0.45 0.50 0.55 0.60 0.68 0.75 0.80 0.41 0.82
Valuation as of 30 Jun 2021
2011 2012 2013 2014 2015 2016 2017 2018 2019 2020 Recent Qtr TTM
Price/Sales 3.5 3.1 3.1 3.7 2.6 3.0 3.9 3.0 5.2 8.5 7.2 7.2
Price/Earnings 14.6 12.1 14.1 17.1 11.4 13.9 18.4 13.2 24.7 40.5 30.7 30.7
Price/Cash Flow 10.1 8.9 9.7 11.3 7.5 9.7 14.0 10.2 19.7 28.8 23.6 23.6
Dividend Yield % — 1.0 2.1 1.67 1.93 1.93 1.45 1.79 1.04 0.61 0.61 0.61
Price/Book 4.9 3.9 4.1 5.8 4.9 4.7 6.4 7.0 14.2 34.1 33.0 33.0
EV/EBITDA 0.0 0.0 0.0 0.0 0.0 0.0 0.0 0.0 0.0 0.0 0.0 0.0
Operating Performance / Profitability as of 31 Mar 2021
Fiscal Year, ends 30 Sep 2011 2012 2013 2014 2015 2016 2017 2018 2019 2020 YTD TTM
ROA % 27.1 28.5 19.3 18.0 20.5 14.9 13.9 16.1 15.7 17.3 15.9 23.2
ROE % 41.7 42.8 30.6 33.6 46.3 36.9 36.9 49.4 55.9 73.7 77.9 103.4
ROIC % 41.0 42.0 26.1 26.2 31.3 22.0 19.9 24.4 25.8 30.1 28.3 40.1
Asset Turnover 1.1 1.1 0.9 0.8 0.9 0.7 0.7 0.7 0.7 0.8 0.6 1.0
Financial Leverage
Fiscal Year, ends 30 Sep 2011 2012 2013 2014 2015 2016 2017 2018 2019 2020 Recent Qtr TTM
Debt/Capital % — — 12.1 20.6 30.9 37.0 42.0 46.7 50.4 60.2 61.1 —
Equity/Assets % 65.8 67.1 59.7 48.1 41.1 39.9 35.7 29.3 26.7 20.2 20.5 —
Total Debt/EBITDA — — 0.3 0.6 0.8 1.2 1.5 1.3 1.3 1.4 1.8 —
EBITDA/Interest Expense — — 419.4 161.0 115.3 50.4 33.0 26.9 22.9 28.2 52.3 39.1
Morningstar Analyst Historical/Forecast Summary as of 28 Apr 2021
Financials
Estimates
Fiscal Year, ends 26 Sep 2019 2020 2021 2022 2023
Revenue (USD Bil) 260 275 359 373 385
Revenue Growth % -2.0 5.5 30.7 3.8 3.3
EBITDA (USD Bil) 76 77 117 115 114
EBITDA Margin % 29.4 28.2 32.6 30.9 29.6
Operating Income (USD Bil) 64 66 104 102 102
Operating Margin % 24.6 24.2 29.0 27.4 26.6
Net Income (USD Bil) 55 57 89 86 87
Net Margin % 21.2 20.9 24.7 23.2 22.5
Diluted Shares Outstanding (Bil) 19 18 17 17 17
Diluted Earnings Per Share(USD) 2.97 3.28 5.13 5.06 5.13
Dividends Per Share(USD) 0.75 0.80 0.85 0.91 0.99
Forward Valuation
Estimates
2019 2020 2021 2022 2023
Price/Sales 3.8 7.2 6.9 6.7 6.5
Price/Earnings 18.9 35.3 29.1 29.5 29.1
Price/Cash Flow 16.9 26.8 23.7 25.5 26.0
Dividend Yield % 1.34 0.69 0.57 0.61 0.66
Price/Book — — — — —
EV/EBITDA 13.2 25.7 21.8 22.1 22.3

Morningstar Equity Analyst Report | Report as of 15 Jul 2021 15:25, UTC | Reporting Currency: USD | Trading Currency: USD | Exchange: NASDAQ
Page 16 of 19
© Morningstar 2021. All Rights Reserved. Unless otherwise provided in a separate agreement, you may use this report only in the country in which its original distributor is based. The information, data, analyses and
opinions presented herein do not constitute investment advice; are provided solely for informational purposes and therefore are not an offer to buy or sell a security; and are not warranted to be correct, complete or
accurate. The opinions expressed are as of the date written and are subject to change without notice. Except as otherwise required by law, Morningstar shall not be responsible for any trading decisions, damages or
other losses resulting from, or related to, the information, data, analyses or opinions or their use. The information contained herein is the proprietary property of Morningstar and may not be reproduced, in whole or in
part, or used in any manner, without the prior written consent of Morningstar. Investment research is produced and issued by subsidiaries of Morningstar, Inc. including, but not limited to, Morningstar Research
Services LLC, registered with and governed by the U.S. Securities and Exchange Commission. To order reprints, call +1 312-696-6100. To license the research, call +1 312-696-6869. Please see important disclosures at
the end of this report.
ß
®
Research Methodology for Valuing Companies
Morningstar Equity Research Star Rating Methodology
Overview
At the heart of our valuation system is a detailed projec-
tion of a company’s future cash flows, resulting from our
analysts’ research. Analysts create custom industry and
company assumptions to feed income statement, balance
sheet, and capital investment assumptions into our glob-
ally standardized, proprietary discounted cash flow, or
DCF, modeling templates. We use scenario analysis, inde-
pth competitive advantage analysis, and a variety of other
analytical tools to augment this process. Moreover, we
think analyzing valuation through discounted cash flows
presents a better lens for viewing cyclical companies,
high-growth firms, businesses with finite lives (e.g.,
mines), or companies expected to generate negative
earnings over the next few years. That said, we don’t dis-
miss multiples altogether but rather use them as support-
ing cross-checks for our DCF-based fair value estimates.
We also acknowledge that DCF models offer their own
challenges (including a potential proliferation of estim-
ated inputs and the possibility that the method may miss
shortterm market-price movements), but we believe these
negatives are mitigated by deep analysis and our
longterm approach.
Morningstar’s equity research group (”we,” “our”) be-
lieves that a company’s intrinsic worth results from the
future cash flows it can generate. The Morningstar Rating
for stocks identifies stocks trading at a discount or premi-
um to their intrinsic worth—or fair value estimate, in
Morningstar terminology. Five-star stocks sell for the
biggest risk adjusted discount to their fair values, where-
as 1-star stocks trade at premiums to their intrinsic worth.
Four key components drive the Morningstar rating: (1) our
assessment of the firm’s economic moat, (2) our estimate
of the stock’s fair value, (3) our uncertainty around that
fair value estimate and (4) the current market price. This
process ultimately culminates in our singlepoint star rat-
ing.
1. Economic Moat
The concept of an economic moat plays a vital role not
only in our qualitative assessment of a firm’s long-term
investment potential, but also in the actual calculation of
our fair value estimates. An economic moat is a structural
feature that allows a firm to sustain excess profits over a
long period of time. We define economic profits as re-
turns on invested capital (or ROIC) over and above our es-
timate of a firm’s cost of capital, or weighted average
cost of capital (or WACC). Without a moat, profits are
more susceptible to competition. We have identified five
sources of economic moats: intangible assets, switching
costs, network effect, cost advantage, and efficient scale.
Companies with a narrow moat are those we believe are
more likely than not to achieve normalized excess returns
for at least the next 10 years. Wide-moat companies are
those in which we have very high confidence that excess
returns will remain for 10 years, with excess returns more
likely than not to remain for at least 20 years. The longer
a firm generates economic profits, the higher its intrinsic
value. We believe low-quality, no-moat companies will
see their normalized returns gravitate toward the firm’s
cost of capital more quickly than companies with moats.
When considering a company's moat, we also assess
whether there is a substantial threat of value destruction,
stemming from risks related to ESG, industry disruption,
financial health, or other idiosyncratic issues. In this con-
text, a risk is considered potentially value destructive if its
occurrence would eliminate a firm’s economic profit on a
cumulative or midcycle basis. If we deem the probability
of occurrence sufficiently high, we would not characterize
the company as possessing an economic moat.
To assess the sustainability of excess profits, analysts per-
form ongoing assessments of the moat trend. A firm’s
moat trend is positive in cases where we think its sources
of competitive advantage are growing stronger; stable
where we don’t anticipate changes to competitive ad-
vantages over the next several years; or negative when
we see signs of deterioration.
2. Estimated Fair Value
Combining our analysts’ financial forecasts with the
firm’s economic moat helps us assess how long returns
on invested capital are likely to exceed the firm’s cost of
capital. Returns of firms with a wide economic moat rat-
ing are assumed to fade to the perpetuity period over a
longer period of time than the returns of narrow-moat
firms, and both will fade slower than no-moat firms, in-
creasing our estimate of their intrinsic value.
Our model is divided into three distinct stages:
Stage I: Explicit Forecast
In this stage, which can last five to 10 years, analysts
make full financial statement forecasts, including items
such as revenue, profit margins, tax rates, changes in
workingcapital accounts, and capital spending. Based on
these projections, we calculate earnings before interest,
after taxes (EBI) and the net new investment (NNI) to de-
rive our annual free cash flow forecast.
Stage II: Fade
The second stage of our model is the period it will take
the company’s return on new invested capital—the re-
turn on capital of the next dollar invested (“RONIC”)—to
decline (or rise) to its cost of capital. During the Stage II
period, we use a formula to approximate cash flows in
lieu of explicitly modeling the income statement, balance
sheet, and cash flow statement as we do in Stage I. The
length of the second stage depends on the strength of
the company’s economic moat. We forecast this period to
last anywhere from one year (for companies with no eco-
nomic moat) to 10–15 years or more (for wide-moat com-
panies). During this period, cash flows are forecast using
four assumptions: an average growth rate for EBI over the
period, a normalized investment rate, average return on
new invested capital (RONIC), and the number of years
until perpetuity, when excess returns cease. The invest-
ment rate and return on new invested capital decline un-
til a perpetuity value is calculated. In the case of firms
that do not earn their cost of capital, we assume marginal
ROICs rise to the firm’s cost of capital (usually attribut-
able to less reinvestment), and we may truncate the
second stage.
Stage III: Perpetuity
Once a company’s marginal ROIC hits its cost of capital,
we calculate a continuing value, using a standard per-
petuity formula. At perpetuity, we assume that any
growth or decline or investment in the business neither
creates nor destroys value and that any new investment
provides a return in line with estimated WACC.
Because a dollar earned today is worth more than a dollar
earned tomorrow, we discount our projections of cash
flows in stages I, II, and III to arrive at a total present
value of expected future cash flows. Because we are
modeling free cash flow to the firm—representing cash
available to provide a return to all capital providers—we
discount future cash flows using the WACC, which is a
weighted average of the costs of equity, debt, and pre-
ferred stock (and any other funding sources), using ex-
pected future proportionate long-term, market-value
weights.
3. Uncertainty Around That Fair Value Estimate
Morningstar's Uncertainty Rating captures a range of
likely potential intrinsic values for a company and uses it
to assign the margin of safety required before investing,
which in turn explicitly drives our stock star rating system.
The Uncertainty Rating represents the analysts' ability to

Morningstar Equity Analyst Report | Report as of 15 Jul 2021 15:25, UTC | Reporting Currency: USD | Trading Currency: USD | Exchange: NASDAQ
Page 17 of 19
© Morningstar 2021. All Rights Reserved. Unless otherwise provided in a separate agreement, you may use this report only in the country in which its original distributor is based. The information, data, analyses and
opinions presented herein do not constitute investment advice; are provided solely for informational purposes and therefore are not an offer to buy or sell a security; and are not warranted to be correct, complete or
accurate. The opinions expressed are as of the date written and are subject to change without notice. Except as otherwise required by law, Morningstar shall not be responsible for any trading decisions, damages or
other losses resulting from, or related to, the information, data, analyses or opinions or their use. The information contained herein is the proprietary property of Morningstar and may not be reproduced, in whole or in
part, or used in any manner, without the prior written consent of Morningstar. Investment research is produced and issued by subsidiaries of Morningstar, Inc. including, but not limited to, Morningstar Research
Services LLC, registered with and governed by the U.S. Securities and Exchange Commission. To order reprints, call +1 312-696-6100. To license the research, call +1 312-696-6869. Please see important disclosures at
the end of this report.
ß
®
Research Methodology for Valuing Companies
Morningstar Equity Research Star Rating Methodology
bound the estimated value of the shares in a company
around the Fair Value Estimate, based on the character-
istics of the business underlying the stock, including oper-
ating and financial leverage, sales sensitivity to the over-
all economy, product concentration, pricing power, expos-
ure to material ESG risks, and other company-specific
factors.
Analysts consider at least two scenarios in addition to
their base case: a bull case and a bear case. Assumptions
are chosen such that the analyst believes there is a 25%
probability that the company will perform better than the
bull case, and a 25% probability that the company will
perform worse than the bear case. The distance between
the bull and bear cases is an important indicator of the
uncertainty underlying the fair value estimate. In cases
where there is less than a 25% probability of an event,
but where the event could result in a material decline in
value, analysts may adjust the uncertainty rating to re-
flect the increased risk. Analysts may also make a fair
value adjustment to reflect the impact of this event.
Our recommended margin of safety widens as our uncer-
tainty of the estimated value of the equity increases. The
more uncertain we are about the estimated value of the
equity, the greater the discount we require relative to our
estimate of the value of the firm before we would recom-
mend the purchase of the shares. In addition, the uncer-
tainty rating provides guidance in portfolio construction
based on risk tolerance.
Our uncertainty ratings for our qualitative analysis are
low, medium, high, very high, and extreme.
Margin of Safety
Qualitative Analysis
Uncertainty Ratings QQQQQRating
QRating
Low 20% Discount 25% Premium
Medium 30% Discount 35% Premium
High 40% Discount 55% Premium
Very High 50% Discount 75% Premium
Extreme 75% Discount 300% Premium
4. Market Price
The market prices used in this analysis and noted in the
report come from exchange on which the stock is listed
which we believe is a reliable source.
For more details about our methodology, please go to
https://shareholders.morningstar.com.
Morningstar Star Rating for Stocks
Once we determine the fair value estimate of a stock, we
compare it with the stock’s current market price on a
daily basis, and the star rating is automatically re-calcu-
lated at the market close on every day the market on
which the stock is listed is open. Our analysts keep close
tabs on the companies they follow, and, based on thor
ough and ongoing analysis, raise or lower their fair value
estimates as warranted.
Please note, there is no predefined distribution of stars.
That is, the percentage of stocks that earn 5 stars can
fluctuate daily, so the star ratings, in the aggregate, can
serve as a gauge of the broader market’s valuation. When
there are many 5-star stocks, the stock market as a whole
is more undervalued, in our opinion, than when very few
companies garner our highest rating.
We expect that if our base-case assumptions are true the
market price will converge on our fair value estimate over
time generally within three years (although it is im-
possible to predict the exact time frame in which market
prices may adjust).
Our star ratings are guideposts to a broad audience and
individuals must consider their own specific investment
goals, risk tolerance, tax situation, time horizon, income
needs, and complete investment portfolio, among other
factors.
The Morningstar Star Ratings for stocks are defined be-
low:
QQQQQ We believe appreciation beyond a fair risk ad-
justed return is highly likely over a multiyear time frame.
Scenario analysis developed by our analysts indicates
that the current market price represents an excessively
pessimistic outlook, limiting downside risk and maximiz-
ing upside potential.
QQQQ We believe appreciation beyond a fair risk-ad-
justed return is likely.
QQQ Indicates our belief that investors are likely to re-
ceive a fair risk-adjusted return (approximately cost of
equity).
QQ We believe investors are likely to receive a less than
fair risk-adjusted return.
Q Indicates a high probability of undesirable risk-adjus-
ted returns from the current market price over a multiyear
time frame, based on our analysis. Scenario analysis by
our analysts indicates that the market is pricing in an ex-
cessively optimistic outlook, limiting upside potential and
leaving the investor exposed to Capital loss.
Other Definitions
Last Price: Price of the stock as of the close of the mar-
ket of the last trading day before date of the report.
Capital Allocation Rating: Our Capital Allocation (or
Stewardship) Rating represents our assessment of the
quality of management’s capital allocation, with particu-
lar emphasis on the firm’s balance sheet, investments,
and shareholder distributions. Analysts consider compan-
ies’ investment strategy and valuation, balance sheet
management, and dividend and share buyback policies.
Corporate governance factors are only considered if they
are likely to materially impact shareholder value, though
either the balance sheet, investment, or shareholder dis-
tributions. Analysts assign one of three ratings: "Exem-

Morningstar Equity Analyst Report | Report as of 15 Jul 2021 15:25, UTC | Reporting Currency: USD | Trading Currency: USD | Exchange: NASDAQ
Page 18 of 19
© Morningstar 2021. All Rights Reserved. Unless otherwise provided in a separate agreement, you may use this report only in the country in which its original distributor is based. The information, data, analyses and
opinions presented herein do not constitute investment advice; are provided solely for informational purposes and therefore are not an offer to buy or sell a security; and are not warranted to be correct, complete or
accurate. The opinions expressed are as of the date written and are subject to change without notice. Except as otherwise required by law, Morningstar shall not be responsible for any trading decisions, damages or
other losses resulting from, or related to, the information, data, analyses or opinions or their use. The information contained herein is the proprietary property of Morningstar and may not be reproduced, in whole or in
part, or used in any manner, without the prior written consent of Morningstar. Investment research is produced and issued by subsidiaries of Morningstar, Inc. including, but not limited to, Morningstar Research
Services LLC, registered with and governed by the U.S. Securities and Exchange Commission. To order reprints, call +1 312-696-6100. To license the research, call +1 312-696-6869. Please see important disclosures at
the end of this report.
ß
®
Research Methodology for Valuing Companies
plary", "Standard", or "Poor". Analysts judge Capital Alloc-
ation from an equity holder’s perspective. Ratings are de-
termined on a forward looking and absolute basis. The
Standard rating is most common as most managers will
exhibit neither exceptionally strong nor poor capital alloc-
ation.
Capital Allocation (or Stewardship) analysis published pri-
or to Dec. 9, 2020, was determined using a different pro-
cess. Beyond investment strategy, financial leverage, and
dividend and share buyback policies, analysts also con-
sidered execution, compensation, related party transac-
tions, and accounting practices in the rating.
Risk Warning
Please note that investments in securities are subject to
market and other risks and there is no assurance or guar-
antee that the intended investment objectives will be
achieved. Past performance of a security may or may not
be sustained in future and is no indication of future per-
formance. A security investment return and an investor’s
principal value will fluctuate so that, when redeemed, an
investor’s shares may be worth more or less than their
original cost. A security’s current investment performance
may be lower or higher than the investment performance
noted within the report. Morningstar’s Uncertainty Rating
serves as a useful data point with respect to sensitivity
analysis of the assumptions used in our determining a fair
value price.
General Disclosure
Unless otherwise provided in a separate agreement, re-
cipients accessing this report may only use it in the coun-
try in which the Morningstar distributor is based. Unless
stated otherwise, the original distributor of the report is
Morningstar Research Services LLC, a U.S.A. domiciled
financial institution.
This report is for informational purposes only and has no
regard to the specific investment objectives, financial
situation or particular needs of any specific recipient. This
publication is intended to provide information to assist in-
stitutional investors in making their own investment de-
cisions, not to provide investment advice to any specific
investor. Therefore, investments discussed and recom-
mendations made herein may not be suitable for all in-
vestors: recipients must exercise their own independent
judgment as to the suitability of such investments and re-
commendations in the light of their own investment ob-
jectives, experience, taxation status and financial posi-
tion.
The information, data, analyses and opinions presented
herein are not warranted to be accurate, correct, com-
plete or timely. Unless otherwise provided in a separate
agreement, neither Morningstar, Inc. or the Equity Re-
search Group represents that the report contents meet all
of the presentation and/or disclosure standards applic-
able in the jurisdiction the recipient is located.
Except as otherwise required by law or provided for in a
separate agreement, the analyst, Morningstar, Inc. and
the Equity Research Group and their officers, directors
and employees shall not be responsible or liable for any
trading decisions, damages or other losses resulting from,
or related to, the information, data, analyses or opinions
within the report. The Equity Research Group encourages
recipients recipients of this report to read all relevant is-
sue documents (e.g., prospectus) pertaining to the secur-
ity concerned, including without limitation, information
relevant to its investment objectives, risks, and costs be-
fore making an in vestment decision and when deemed
necessary, to seek the advice of a legal, tax, and/or ac-
counting professional.
The Report and its contents are not directed to, or inten-
ded for distribution to or use by, any person or entity who
is a citizen or resident of or located in any locality, state,
country or other jurisdiction where such distribution, pub-
lication, availability or use would be contrary to law or
regulation or which would subject Morningstar, Inc. or its
affiliates to any registration or licensing requirements in
such jurisdiction.
Where this report is made available in a language other
than English and in the case of inconsistencies between
the English and translated versions of the report, the Eng-
lish version will control and supersede any ambiguities
associated with any part or section of a report that has
been issued in a foreign language. Neither the analyst,
Morningstar, Inc., or the Equity Research Group guaran-
tees the accuracy of the translations.
This report may be distributed in certain localities, coun-
tries and/or jurisdictions (“Territories”) by independent
third parties or independent intermediaries and/or distrib-
utors (“Distributors”). Such Distributors are not acting as
agents or representatives of the analyst, Morningstar,
Inc. or the Equity Research Group. In Territories where a
Distributor distributes our report, the Distributor is solely
responsible for complying with all applicable regulations,
laws, rules, circulars, codes and guidelines established by
local and/or regional regulatory bodies, including laws in
connection with the distribution third-party research re-
ports.
Conflicts of Interest
u
No interests are held by the analyst with respect to the
security subject of this investment research report.
Morningstar, Inc. may hold a long position in the se-
curity subject of this investment research report that
exceeds 0.5% of the total issued share capital of the
security. To determine if such is the case, please click
u
http://msi.morningstar.com and
http://mdi.morningstar.com.
u
Analysts’ compensation is derived from Morningstar,
Inc.’s overall earnings and consists of salary, bonus
and in some cases restricted stock.
u
Neither Morningstar, Inc. or the Equity Research Group
receives commissions for providing research nor do
they charge companies to be rated.
u
Neither Morningstar, Inc. or the Equity Research Group
is a market maker or a liquidity provider of the security
noted within this report.
u
Neither Morningstar, Inc. or the Equity Research Group
has been a lead manager or co-lead manager over the
previous 12-months of any publicly disclosed offer of
financial instruments of the issuer.
u
Morningstar, Inc.’s investment management group
does have arrangements with financial institutions to
provide portfolio management/investment advice some
of which an analyst may issue investment research re-
ports on. However, analysts do not have authority over
Morningstar’s investment management group’s busi-
ness arrangements nor allow employees from the in-
vestment management group to participate or influ-
ence the analysis or opinion prepared by them.
u
Morningstar, Inc. is a publicly traded company (Ticker
Symbol: MORN) and thus a financial institution the se-
curity of which is the subject of this report may own
more than 5% of Morningstar, Inc.’s total outstanding
shares. Please access Morningstar, Inc.’s proxy state-
ment, “Security Ownership of Certain Beneficial Own-
ers and Management” section http://investorrelations.
morningstar.com/sec.cfm?doctype=Proxy&year=&x=
12.
u
Morningstar, Inc. may provide the product issuer or its
related entities with services or products for a fee and
on an arms’ length basis including software products
and licenses, research and consulting services, data
services, licenses to republish our ratings and research
in their promotional material, event sponsorship and
website advertising.
Further information on Morningstar, Inc.’s conflict of in-
terest policies is available from https://
shareholders.morningstar.com. Also, please note analysts
are subject to the CFA Institute’s Code of Ethics and
Standards of Professional Conduct.
For a list of securities which the Equity Research Group
currently covers and provides written analysis on please
contact your local Morningstar office. In addition, for his-
torical analysis of securities covered, including their fair
value estimate, please contact your local office.
For Recipients in Australia: This Report has been issued
and distributed in Australia by Morningstar Australasia
Pty Ltd (ABN: 95 090 665 544; ASFL: 240892). Morning-
star Australasia Pty Ltd is the provider of the general ad-
vice (‘the Service’) and takes responsibility for the produc-

Morningstar Equity Analyst Report | Report as of 15 Jul 2021 15:25, UTC | Reporting Currency: USD | Trading Currency: USD | Exchange: NASDAQ
Page 19 of 19
© Morningstar 2021. All Rights Reserved. Unless otherwise provided in a separate agreement, you may use this report only in the country in which its original distributor is based. The information, data, analyses and
opinions presented herein do not constitute investment advice; are provided solely for informational purposes and therefore are not an offer to buy or sell a security; and are not warranted to be correct, complete or
accurate. The opinions expressed are as of the date written and are subject to change without notice. Except as otherwise required by law, Morningstar shall not be responsible for any trading decisions, damages or
other losses resulting from, or related to, the information, data, analyses or opinions or their use. The information contained herein is the proprietary property of Morningstar and may not be reproduced, in whole or in
part, or used in any manner, without the prior written consent of Morningstar. Investment research is produced and issued by subsidiaries of Morningstar, Inc. including, but not limited to, Morningstar Research
Services LLC, registered with and governed by the U.S. Securities and Exchange Commission. To order reprints, call +1 312-696-6100. To license the research, call +1 312-696-6869. Please see important disclosures at
the end of this report.
ß
®
Research Methodology for Valuing Companies
tion of this report. The Service is provided through the re-
search of investment products.
To the extent the Report contains general advice it has
been prepared without reference to an investor’s object-
ives, financial situation or needs. Investors should con-
sider the advice in light of these matters and, if applic-
able, the relevant Product Disclosure Statement before
making any decision to invest. Refer to our Financial Ser-
vices Guide (FSG) for more information at http://
www.morningstar.com.au/fsg.pdf.
For Recipients in Hong Kong: The Report is distributed
by Morningstar Investment Management Asia Limited,
which is regulated by the Hong Kong Securities and Fu-
tures Commission to provide services to professional in-
vestors only. Neither Morningstar Investment Manage-
ment Asia Limited, nor its representatives, are acting or
will be deemed to be acting as an investment profession-
al to any recipients of this information unless expressly
agreed to by Morningstar Investment Management Asia
Limited. For enquiries regarding this research, please con-
tact a Morningstar Investment Management Asia Limited
Licensed Representative at https://shareholders.morning-
star.com.
For recipients in India: This Investment Research is is-
sued by Morningstar Investment Adviser India Private
Limited. Morningstar Investment Adviser India Private
Limited is registered with the Securities and Exchange
Board of India (Registration number INA000001357) and
provides investment advice and research. Morningstar In-
vestment Adviser India Private Limited has not been the
subject of any disciplinary action by SEBI or any other leg-
al/regulatory body. Morningstar Investment Adviser India
Private Limited is a wholly owned subsidiary of Morning-
star Investment Management LLC. In India, Morningstar
Investment Adviser India Private Limited has one asso-
ciate, Morningstar India Private Limited, which provides
data related services, financial data analysis and software
development. The Research Analyst has not served as an
officer, director or employee of the fund company within
the last 12 months, nor has it or its associates engaged in
market making activity for the fund company.
*The Conflicts of Interest disclosure above also applies to
relatives and associates of Manager Research Analysts in
India # The Conflicts of Interest disclosure above also ap-
plies to associates of Manager Research Analysts in In-
dia. The terms and conditions on which Morningstar In-
vestment Adviser India Private Limited offers Investment
Research to clients, varies from client to client, and are
detailed in the respective client agreement.
For recipients in Japan: The Report is distributed by Ib-
botson Associates Japan, Inc., which is regulated by Fin-
ancial Services Agency. Neither Ibbotson Associates Ja-
pan, Inc., nor its representatives, are acting or will be
deemed to be acting as an investment professional to any
recipients of this information.
For recipients in Singapore: For Institutional Investor
audiences only. Recipients of this report should contact
their financial professional in Singapore in relation to this
report. Morningstar, Inc., and its affiliates, relies on cer-
tain exemptions (Financial Advisers Regulations, Section
32B and 32C) to provide its investment research to recipi-
ents in Singapore.
