
Improving Small Apparel Company’s Production Planning
using Demand Forecasting and Material Requirement
Planning
Gabriella Regina, Naila Zaafira Wilson, Pocut Shafira Putri Aurora, and Rahmat
Nurcahyo
Department of Industrial Engineering
Faculty of Engineering, Universitas Indonesia
Jakarta, Indonesia
gabriella.regi[email protected], naila.zaafira@ui.ac.id, [email protected], [email protected]
Abstract
Aggregate planning has been widely used by apparel manufacturers to gain maximum profit by finding the optimal
solution between maximizing sales and minimizing production cost. Commonly, small apparel companies use chase
strategy, where production rates are varied for each time period to meet changes in demand. However, without an
appropriate demand forecast and well-calculated production planning, this strategy cannot accommodate the
fluctuating demand, causing recurring product stockouts which increases the number of unmet customer demands. To
improve the company’s production planning, the number of demands is forecasted using Single Moving Average
method for each week of the upcoming month. The forecasted demand is then used to plan the production quantity
using Material Requirement Planning which helps ensure that all the demands are met while avoiding over-production
by taking on-hand inventory into account. Comparison between the former and the improved production planning
method shows an increase in the company’s sales, increasing profit by 8.98% or equal to Rp616.000. This concludes
that the method proposed in this paper can be used as a simple yet effective way to improve the apparel company’s
production planning, hence increasing the company’s profit.
Keywords
Forecasting, production planning, product stockouts, apparel
1. Introduction
Interest and consumption of ready-to-wear apparel keeps growing every year. This phenomenon encourages many
people to start their own apparel business, offering more sustainable products at a more affordable price range. To be
able to set business in motion and generate profits, each company must establish the most suitable aggregate planning
strategy for their business. Maximum profit can be reached by finding the optimal solution between meeting maximum
demand and lowering cost. Most small apparel companies use chase strategy, where the production rates are varied
each time period to meet changes in demand. This strategy is deemed most suitable for small apparel businesses since
this strategy requires lower capital requirement and the resources needed are flexible and inexpensive to change.
Forecasting and planning play a huge role in determining the production rate to balance the customers’ order. Good
forecasting and planning will lead to on-time delivery, minimum waste, and minimum production cost. To optimize
the chosen strategy, the company needs to have a well planned production as well as raw material stock schedule.
Delay in the supply of materials and inappropriate storage of materials can result in delays in the completion of a
project or even stopping the project, resulting in complaints and customer dissatisfaction that will decrease the
competitiveness of the company (Rahmat et al., 2020).
Some studies have revealed the impact of demand forecasting implementation to prevent out-of-stock situations in
apparel companies (Rachman, 2018). Demand forecasting has been proven to be an important factor on supply chain
improvement, resulting in an increase in the companies’ responsiveness to actual customer demand (A. Ross, 2004).
Furthermore, Maria et al. (2013) discussed the actual state of the context in the fashion industry compared with the
demand forecasting approaches developed over the last few years to understand which forecasting methods are more
Proceedings of the International Conference on Industrial Engineering and Operations Management
Bangalore, India, August 16-18, 2021
© IEOM Society International
291

effective under the current conditions. Therefore this research attempts to narrow the scope by implementing demand
forecasting and material requirement planning for production planning management for small apparel companies.
The object of this paper is Whycotton, a small apparel company which sells plain t-shirts through online platforms.
Since it is a small business, the company uses a simple forecasting technique to determine their production for the
upcoming week. However, since the forecast was based on a short time period (1 week), this method often causes out-
of-stock (OOS) occurrences. Due to the ever-changing and competitive nature of fashion industry, this condition can
lead to opportunity loss. If applied in the long run, on-demand strategy can result in stagnancy, or even failure of the
business. Thus, this paper attempts to implement demand forecasting and material requirement planning to a small
apparel company to prevent product stock outs.
1.1 Objectives
The objective of this study is to improve Whycotton’s production planning method by avoiding out-of-stock
occurrences using demand forecasting and material requirement planning. These improvements will result in an
increase in sales, hence increasing the company's profit.
2. Literature Review
2.1 Plain T-Shirts Manufacturing Process in Small Apparel Company
The production process consists of several stages. The process starts from the procurement of raw materials by the
owner. Raw materials used in this business are modal cotton and rib fabric. These materials are obtained from fabric
suppliers. Modal cotton is used as the base fabric of the t-shirt while rib fabric is a type of elastic knit fabric that is
used as an accessory or complement to t-shirts on the neck. This stage is followed by the cutting process.
Cutting process aims to cut fabrics into specific cutting designs based on the sample t-shirts, making it to be used as
a panel before going to the sewing process. The treatment and cutting technique of each fabric varies depending on
the fabric condition. Therefore, the skill and the flexibility of the operator affect the quality of the resulting piece of
fabric. The cloth is spread layer by layer on a table and then the fabric will be cut into pieces using a cutting machine
which are then separated. This stage is followed by the sewing process.
Sewing is the process of combining fabric components that have been cut into a whole shirt. The first step in the
sewing process is sewing the shoulder section. This is done by sewing the front section of the shirt and connecting it
to the back section of the shirt. The second step is to sew the arm caps and the last step is to sew the neck section. In
the sewing process, the operator needs to check some important details such as checking the t-shirt components as
well as trimming to cut threads from the remaining stitches. This step is followed by the finishing process.
Finishing is the final stage of the t-shirt production process and is also called the refinement process. Finishing is
done after the sewing stage is complete. At this stage, the production results are checked from all aspects. The activities
involved in this process are ironing, labelling, quality control, and packaging. T-shirts that pass the finishing process
are t-shirts that have the desired quality.
2.2 Aggregate Planning
Aggregate planning is a process to determine optimal levels of capacity, production, subcontracting, inventory, stock-
outs, and pricing within a specific period of time (Chopra and Meindl, 2007) as an attempt to balance capacity and
demand with minimum cost. Consequently, its quality has a significant impact towards the profitability of a company,
making it one of the most critical areas of planning performed in the design of production systems (Nam & Logendran,
1992). The aggregate planning strategies include pure chase strategy, pure level strategy, and hybrid (mixed) strategy.
2.2.1 Chase Strategy
Chase strategy refers to a method of aggregate planning in which the company manufacturing capacity is dictated by
the demand within the market, meaning the production level is varied and uses almost no inventory (Hamlet: 2013).
This strategy is also known as the Demand Matching Strategy. Variable aspects within production are very flexible
and are limited to only the necessary.
Proceedings of the International Conference on Industrial Engineering and Operations Management
Bangalore, India, August 16-18, 2021
© IEOM Society International
292

Chase strategy's most significant advantage lies in its ability to meet the fluctuation of market demand, and this perk
is especially useful where market volatility constantly puts companies in positions where they are left with production
excess that eventually becomes waste. Another advantage that chase strategy possesses is the ability to reduce
inventory to a significant level. As chase strategy focuses on production according to market demand, the number of
products has a higher chance to sell out. This means companies do not need to keep their product indefinitely while
they wait for a customer to come. However, due to its nature of following market demand, companies must have
enough datas and other required resources necessary to facilitate accurate forecasting.
Figure 1. Chase strategy production behavior in relation to market demand
2.2.2 Level Strategy
Level strategy is the other spectrum of aggregate planning where chase strategy occupies one extreme and level
strategy occupies the other. Unlike chase strategy, level strategy does not follow the trend movement of supply and
demand. Regardless of the market demand, companies that adhere to this production model will follow its pre-
established production output. This means companies will have an excess number of output during low market demand
and shortage of output during high demand.
Forecasting is a huge aspect within MRP, and where chase strategy would continuously update their MRP, level
strategy will in general stick to one MRP that they could continuously use in the far future. Where chase strategy is
characterized by instant sellout, level strategy meets market demand by selling its inventory during times when current
production output cannot keep up with demand, and store production output for later use when the market demand is
low.
Fundamentally, the advantage that comes with level strategy is its ability to decrease production cost because fixed
cost is spread over an optimum quantity of products, lowering the overall price of the product in the end. The major
disadvantage of level strategy is that it would need companies to assign a significant fund to manage inventory. There
is also the matter of producing waste when the inventory expires. Companies with a short span of time between
manufacturing and expiration date are at a high risk of loss when adopting this strategy as it renders companies unable
to keep up market demand through selling its inventory during high demand periods.
Proceedings of the International Conference on Industrial Engineering and Operations Management
Bangalore, India, August 16-18, 2021
© IEOM Society International
293

Fi
gure 2. Level strategy production behavior in relation to market demand
2.2.3 Hybrid Strategy
Hybrid strategy, as its name suggests, is a hybrid between chase and level strategy. It took the best features that level
and chase strategy has and combined them to get the best of both worlds. Hybrid strategy keeps an optimum control
over the production capacity, hiring and firing rate, and inventory.
Graphic visualization of a hybrid strategy is similar to approximation of a curve using integration. The production
level will remain the same for a certain timespan or period, and change in the next span to follow the change of market
demand. Using this strategy, companies are able to adjust product price at a slower interval as the change of fixed cost
is limited only between constant production period transitions.
Essentially, hybrid strategy could be thought as level strategy that is revamped every once in a while to follow market
demand.
Figure 3. Hybrid strategy production behavior in relation to market demand
2.3 Master Production Schedule
In manufacturing industry, the most important element of customer service is product availability (Coyle, Bardi, and
Langley, 1992). One of the main tools used to control product availability is Master Production Schedule (MPS). MPS
can be defined as a feasible production plan that states the amount and time of production of individual end items
(Sheikh, 2002). Whereas production plan deals in families of products, the MPS works with end items. It breaks down
the production plan into the requirements for individual end items, in each family, by date and quantity. MPS is limited
Proceedings of the International Conference on Industrial Engineering and Operations Management
Bangalore, India, August 16-18, 2021
© IEOM Society International
294

by the production plan - therefore, the total of the items in the MPS should not be different from the total shown on
the production plan.
The focus of optimization in production scheduling is to determine an effective scheduling production based on
demand (Rahmat et al., 2020). MPS helps determine the amount of production needed per period to meet anticipated
customer demand using data of the beginning inventory and the demand forecast for a particular end item. There are
five inputs needed to construct MPS: total demand data from sales and order forecasts, inventory status, production
plans, planning data such as lot-sizing, safety stock, lead time, etc, and rough cut capacity planning information.
Data from the MPS is then used to determine the raw materials requirement to meet the planned production schedule.
MPS therefore drives operations in terms of what is assembled, manufactured, and bought (Vieira and Favaretto, 2006).
MPS additionally provides information for sales regarding what can be promised to customers and when deliveries
can be made, which makes the method a vital link between customer order management and production (Zhao et al.,
2001). These characteristics mean that MPS is the basis for meeting delivery promises without inducing high inventory
levels, as well as for resolving trade-offs between sales and manufacturing (Jacobs et al., 2011).
2.4 Material Requirements Planning
End items are made or assembled from components that must be available in the right quantities and at the right time
to meet the MPS requirements. If any component is missing, the product cannot be built and shipped on time. Raw
material is a major factor that determines the smoothness of a production process. Error in determining the amount of
raw material can cause delay in production, inhibiting the manufacturer from producing the product on time. Thus,
raw material has a direct effect on company profits. To help plan the order of raw materials, Material Requirement
Planning (MRP) is used. MRP is a time-phased priority planning technique that calculates raw material requirement
and schedules supply to meet demand of a product (Moustakis, 2000). It establishes a schedule (priority plan) showing
the components required at each level of the assembly and, based on lead times, calculates the time when these
components will be needed.
One of MRP’s main objectives is to keep the due date equal to the need date, eliminating material shortages and excess
stocks. MRP breaks a component into parts and subassemblies, and plans for those parts to come into stock when
needed. Material requirement planning system help manufacturers determine precisely when and how much material
to purchase and process based on a time-phased analysis of sales orders, production orders, current inventory, and
forecasts. It ensures the company will always have sufficient inventory to meet production demands, but not more
than necessary at any given time. The application of this popular tool in materials management has greatly reduced
inventory levels and improved productivity (Wee and Shum, 1999).
In its simplest form, an MRP system consists of three basic components: a master production schedule (MPS); bill-
of-material (BOM) files of the end items; and inventory status files of various materials, components, parts,
subassemblies and final products (Hoey, Kilmarting, and Leonard, 1986). The MPS drives the MRP, and MRP drives,
or is input to, production activity control (PAC), and purchasing.
3. Methods
To forecast the demand and the production capacity, Simple Moving Average (SMA) is used to find out means of past
production capacity as well as means of past sales and use it as the forecast value of Whycotton’s projected demand
and production capacity in May 2021. SMA is one of the technical indicators which is widely used to predict future
data in time series analysis. It is appropriate when there is no noticeable trend or seasonality. Since the object of this
paper is a small apparel company which sells plain t-shirts, their demand and production pattern is not considered as
seasonal.
Formula that is applied in the SMA method is:
SMA =
...
With
= Actual occurrence in the past period for up to n periods
n = Numbers of period to be averaged
Proceedings of the International Conference on Industrial Engineering and Operations Management
Bangalore, India, August 16-18, 2021
© IEOM Society International
295

In this paper, the number of periods chosen is three consecutive weeks in order to get more solid forecast results while
using limited company’s data. The historical data which was used are from Week 1 until Week 4 of April 2021. By
comparing the demand forecast with the production capacity forecast, the company’s ability in satisfying the upcoming
demand can be deduced.
4. Data Collection
The t-shirt produced was made out of 4 main components: 2 pieces of t-shirt’s sleeves, one piece of the collar, one
piece of front t-shirt body and one piece of back t-shirt body. Bill of material for t-shirt production has three levels
which are level 0, level 1, and level 2 as seen on the figure below (see Figure 1). The details of how much fabric is
required in each level is shown on the Bill of Material and the quantity summary is attached on a table form as well
(see Table 1).
Figure 4. Bill of Materials (BOM) of T-Shirt
Table 1. Raw Materials Requirement for One T-Shirt
Material
Part
Quantity (kg)
Cotton modal
Sleeves
0.07
Front body
0.09
Back body
0.09
Rib cloth
Collar
0.05
To anticipate customer demands for the following week, the company has always referred to the sales data from the
previous week and added 40 - 50% more pieces from last week’s sales. However, from the data of number of sales
and volume of production in April 2021, it can be seen that the demand still exceeded the production capacity (see
Table 2 and Table 3). This proves that the company’s strategy in planning and deciding the production quantity is still
inadequate, causing a recurring out-of-stock situation.
Proceedings of the International Conference on Industrial Engineering and Operations Management
Bangalore, India, August 16-18, 2021
© IEOM Society International
296

Table 2. Data of T-Shirt Sales in April 2021
Time Period
Sales (pcs)
Week 1
77
Week 2 30
Week 3 98
Week 4 58
Table 3. Data of T-Shirt Production in April 2021
Time Period
Production Capacity (pcs)
Week 1 31
Week 2 49
Week 3 38
Week 4
83
5. Results and Discussion
5.1 Numerical Results
To know whether the production capacity can satisfy the demand needs in May 2021, the simple moving average
method is used to forecast the demand and production capacity (see Table 4 and Table 5). Week 1 – Week 4 refers to
weeks in April 2021 and Week 5 – Week 8 refers to weeks in May 2021. The forecast is done in weeks-period because
the company produces t-shirts every one week. Furthermore, the forecast is only based on the data in April 2021 due
to lack of data availability from the company.
Table 4. T-Shirt Demand Forecast in May 2021
Week
Sales (pcs)
Demand Forecast (pcs)
1
77
-
2
30
-
3
98
-
4
58
-
5
-
62
6
-
73
7
-
65
8
-
67
Proceedings of the International Conference on Industrial Engineering and Operations Management
Bangalore, India, August 16-18, 2021
© IEOM Society International
297
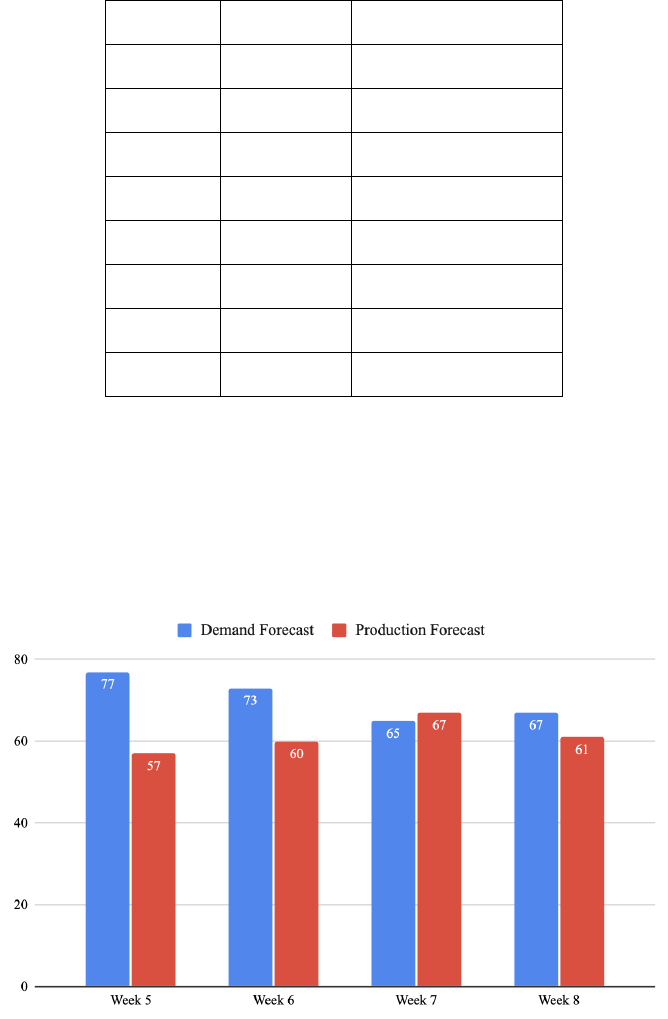
Table 5. T-Shirt Production Volume Forecast in May 2021
Week
Sales (pcs)
Demand Forecast (pcs)
1
31
-
2
49
-
3
38
-
4
83
-
5
-
57
6
-
60
7
-
67
8
-
61
5.2 Graphical Results
By comparing the forecasted number of demand and quantity of production, it can be seen that the number of demand
still exceeds the number of production in three out of four weeks in May 2021 (see Figure 2). This imbalance means
that a significant amount of customer demands went unfulfilled, implying an inadequateness in satisfying customer
demand. This means that the current production planning and inventory management adopted by the company is
ineffective, urging an adoption of a better planning system.
Figure 5. Histogram of Demand Forecast vs. Production Capacity Forecast
5.3 Proposed Improvements
The Table 6 below shows the material requirement planning of cotton modal to satisfy the demand in May 2021. This
material is needed to make the sleeves, the front body, and the back body of the t-shirt produced. The quantity needed
to produce one T-shirt is 0.25 kg of cotton modal (0.09 for the front body, 0.09 kg for the back body, and 0.07 kg for
the collar).
Proceedings of the International Conference on Industrial Engineering and Operations Management
Bangalore, India, August 16-18, 2021
© IEOM Society International
298

Table 6. Material Requirement Planning (MRP) of Cotton Modal in May 2021
Lead time: 1 week; Lot size: Multiplication of 4
Cotton Modal
Week
5
6
7
8
Gross Requirement (pcs)
62
73
65
67
Project On Hand Inventory (pcs)
8
2
1
0
1
Net Requirement (pcs)
54
71
64
67
Planned Order Receipt (pcs)
56
72
64
68
Planned Order Receipt (kg)
14
24
16
17
Planned Order Release* (kg)
14
24
16
17
*1 piece of t-shirt = 0.25 kg of cotton modal
The authors also calculate the material requirement planning of rib clothing to satisfy the upcoming demand in May
2021 (see Table 7). Rib clothing is needed to make the collar of the t-shirt produced, in which every t-shirt has one
collar. To produce one t-shirt, 0.05 kg of rib cloth is required.
Table 7. Material Requirement Planning (MRP) of Rib Cloth in May 2021
Lead time: 1 week; Lot size: Automatically follows Cotton Modal lot size
Rib Cloth
Week
5
6
7
8
Gross Requirement (pcs)
62
73
65
67
Project On Hand Inventory (pcs)
8
2
1
0
1
Net Requirement (pcs)
54
71
64
67
Planned Order Receipt (pcs)
56
72
64
68
Planned Order Receipt (kg)
2.8
3.6
3.2
3.4
Planned Order Release (kg)*
2.8 3.6 3.2 3.4
*1 piece of t-shirt = 0.05 kg of rib cloth
The adoption of Material Requirement Planning (MRP) in determining the production quantity and inventory level is
a form of improvement strategy to prevent the out-of-stock situation in May 2021. The company can better determine
the production quantity because the production quantity is based on the forecasted demand while taking on-hand
inventory and net requirement into account. Using empirical calculation, the company can prevent the occurrences in
which the quantity of materials exceeds or unfulfill the amount needed. The acknowledgement of raw materials’ lead
time will also help in ensuring that the materials needed are always available on time, which will decrease the chance
Proceedings of the International Conference on Industrial Engineering and Operations Management
Bangalore, India, August 16-18, 2021
© IEOM Society International
299

of product stock outs. Decrease in the number of unmet demands will increase the amount of goods sold, which will
result in an increase in the company’s overall profit.
5.4 Validation
Based on comparison below (see Table 8, Table 9, and Table 10), it is found that cost calculation using MRP can
increase the company’s profit in May 2021 to Rp 7.476.000,‐ or equal to adding 8,98% more profit than its original
value which is Rp 6.860.000,‐. This validates the hypothesis mentioned in the objective of this paper which stated that
by applying inventory planning, profit of the company will increase.
Table 8. Profit obtained without applying MRP
T-shirt sold (pcs)
Revenue
Production cost*
Profit
57 Rp3.819.000 Rp2.223.000 Rp1.596.000
60 Rp4.020.000 Rp2.340.000 Rp1.680.000
67 Rp4.489.000 Rp2.613.000 Rp1.876.000
61
Rp4.087.000
Rp2.379.000
Rp1.708.000
Total profit Rp6.860.000
*0.25 kg of cotton modal and 0.05 kg of rib cloth (1 t-shirt) = Rp34.000
Cutting and sewing cost (1 t-shirt) = Rp5.000
Total cost for 1 t-shirt = Rp39.000
Table 9. Profit obtained with applying MRP
T-shirt sold (pcs)
Revenue
Production cost*
Profit
62 Rp4.154.000 Rp2.418.000 Rp1.736.000
73 Rp4.891.000 Rp2.847.000 Rp2.044.000
65 Rp4.355.000 Rp2.535.000 Rp1.820.000
67
Rp4.489.000
Rp2.613.000
Rp1.876.000
Total profit Rp7.476.000
*0.25 kg of cotton modal and 0.05 kg of rib cloth (1 t-shirt) = Rp34.000
Cutting and sewing cost = Rp5.000
Total cost for 1 t-shirt = Rp39.000
Table 10. Total profit comparison of MRP implementation
Profit with applying MRP Profit without applying MRP
Incremental profit
In Price In Percentage
Rp7.476.000
Rp6.860.000
Rp616.000 8.98%
6. Conclusion
Whycotton is a small apparel company which applies chase strategy as their production plan method. This company
often faces out-of-stock conditions (OOS) because they do not have a well-planned production scheduling and
Proceedings of the International Conference on Industrial Engineering and Operations Management
Bangalore, India, August 16-18, 2021
© IEOM Society International
300
inventory control. This problem results in opportunity loss. In the long run, this problem can lead to stagnancy or even
failure of the business.
By using the simple moving average (SMA) as the forecasting method, it is found that in the upcoming month, May
2021, the company’s production capacity cannot satisfy customer demand due to limited stocks. To answer this
problem, an implementation of Material Requirement Planning (MRP) is performed as the proposed improvement
method. This method was chosen because it provides a schedule showing the components required at each level of the
assembly and calculates the time when these components will be needed based on lead times.
In comparison data, it can be seen that in May 2021 demand, Whycotton can increase their profit by 8.98% if the
company has applied the MRP on their production planning. Results generated from calculation of the incremental
profit obtained are relatively small in percentage. However, in its capacity as a small company, the application of
MRP method in the purchasing planning of raw materials resulted in the company to gain a significant amount of
profit. Judging from the size of this small company, this increase has a considerably big impact.
In addition to the terms of increase in profit, the application of this method also resulted in companies being able to
fulfill the customer demand schedule on time. Other than that, this method implementation helps the company in
minimizing the possibility of the production capacity not meeting the customer demand, and an ease in analyzing how
much raw materials to be purchased to meet demand.
References
Chopra, S. P. M., Supply Chain Management: Strategy, Planning, and Operation. Pearson Prentice Hall, 2007.
Coyle, J.J., Bardi, E.J. and Langley, C.J., The Management of Business Logistics, West Publishing Company, New
York, 1992.
Dehkordi, F. Applied Business Forecasting and Planning: Moving Averages and Exponential Smoothing [PowerPoint
slides]. http://faculty.wiu.edu/F-Dehkordi/DS-533/Lectures/Moving-average-methods.ppt, 2015.
Hamlett, k., Operations and Supply Chain Management, 13th edition, McGraw-Hill Irwin, MA, 2013.
Hoey, J., Kilmarting, B.R., and Leonard .R., Designing a Material Requirement Planning System to meet the needs of
low-volume, Make – to – order companies (with case study). Int. J. Prod. Res., vol. 24, no. 2, pp. 375-386, 1986.
Moustakis, V., Material Requirement Planning: A Methodology. INNOREGIO Project, 2000.
Nam, S. J., & Logendran, R., Aggregate production planning—a survey of models and methodologies. European
Journal of Operational Research, vol. 61, no. 3, pp. 255-272, 1992.
Nenni, M. E., Giustiniano, L., Pirolo, L., Demand Forecasting in the Fashion Industry: A Review, International
Journal of Engineering Business Management, vol. 5, pp. 1–6, 2013.
Nurcahyo, R., Indramawan, Yadrifil, Habiburrahman, M., and Wibowo, N., Business Process Re-engineering for
Reducing Time of Procurement and Inventory Process in Telecommunication Tower Company, Proceedings of
the International Conference on Industrial Engineering and Operations Management Dubai, vol. 0, pp. 2460-
2469, 2020.
Nurcahyo, Rahmat., Rachman, Amar., and Agustino, Tommy., Production Efficiency Improvement Through
Preventive Maintenance and Production Scheduling Optimization. Proceedings of the Sixth International
Conference in Industrial Engineering and Operations Management, 2016.
Jacobs, R., Whybark, C., Berry, W., and Vollmann, T., Manufacturing Planning and Control for Supply Chain
Management. McGraw–Hill, New York, 2011.
Rachman, Rizal. Penerapan Metode Moving Average Dan Exponential Smoothing Pada Peramalan Produksi Industri
Garmen, Jurnal Informatika, vol. 5, pp. 211-220, 2018.
Ross, A., Why bad forecasts can be good for business, Manufacturing Engineer, vol. 83, no. 3, pp. 26–29, 2004.
Sheikh, K., Manufacturing resource planning (MRP II) with introduction to ERP, SCM, and CRM, McGraw-Hill
Professional, Singapore, 2002.
Vieira, G.E., Favaretto, F., A new and practical heuristic for master production scheduling creation, International
Journal of Production Research, vol. 44, no.18/19, pp. 3607–3627, 2006.
We
e H. M., and Shum Y. S., Model Development for Deteriorating Inventory in Material Requirement Planning
Systems. Computers & Industrial Engineering; 36, pp 219–225, 1999.
Zha
o, X., Xie, J., and Joang, Q., Lot-sizing rule and freezing the master production schedule under capacity constraint
and deterministic demand. Production and Operations Management, vol. 10, no. 1, pp. 45–67, 2001.
Proceedings of the International Conference on Industrial Engineering and Operations Management
Bangalore, India, August 16-18, 2021
© IEOM Society International
301

Biographies
Gabriella Regina is an Industrial Engineering undergraduate student from Universitas Indonesia. She is currently a
research assistant in the Management Information System and Decision Support Laboratory. Her research interests
are Business Process Reengineering, Information System, Enterprise Resource Planning, Project Management,
Industrial Feasibility Analysis, Customer Relationship Management, Database Management System, and Decision
Support System.
Naila Zaafira is an Industrial Engineering undergraduate student from Universitas Indonesia. Her research interest
includes mostly visual ergonomy and communication, and minoring in Animation and Game Design. At the moment
she is working on an animated TV series pre-production as well as serving as a teaching assistant in an online graphic
design mentorship program.
Pocut Shafira Putri Aurora is an Industrial Engineering undergraduate student from Universitas Indonesia. She is
currently a research assistant in the Statistics and Quality Engineering Laboratory. Her research and teaching interests
are mostly related to Statistical Learning & Optimization and Social Finance & Market Analytics. She has been
involved in some Quality Engineering training programs by providing materials for the Certified Quality Engineer
Exam participants.
Rahmat Nurcahyo is currently active as academic staff in Industrial Engineering Department, Universitas Indonesia.
Mr. Rahmat was born in Jakarta, June 2nd 1969. He started his higher education in Mechanical Engineering,
Universitas Indonesia and graduated in 1993. Then, he continued his study in University of New South Wales and
obtained his master degree (M.Eng.Sc.) in 1995. Now, he is a candidate of doctoral degree in Faculty of Economics,
Universitas Indonesia. Mr. Rahmat has taught several courses in Industrial Engineering UI, including Industrial
Psychology, Industrial Economy, and Total Quality Management. Mr. Rahmat is International Register of Certificated
Auditors and a member of Ikatan Sarjana Teknik Industri dan Manajemen Industri Indonesia (ISTMI).
Proceedings of the International Conference on Industrial Engineering and Operations Management
Bangalore, India, August 16-18, 2021
© IEOM Society International
302
