
NREL is a national laboratory of the U.S. Department of Energy
Office of Energy Efficiency & Renewable Energy
Operated by the Alliance for Sustainable Energy, LLC
This report is available at no cost from the National Renewable Energy
Laboratory (NREL) at www.nrel.gov/publications.
Contract No. DE-AC36-08GO28308
Technical Report
NREL/TP-5400-83795
December 2022
Florida Alternative Transportation Fuel
Resilience Plan
Caley Johnson
,
1
Jeff Cappellucci,
1
Lauren Spath Luhring,
1
Maria St. Louis
-Sanchez,
1
Fan Yang,
1
Abby Brown,
1
Austin Sipiora,
2
Alexander Kolpakov,
2
Xiaopeng Li,
2
Qianwen Li,
2
Sean White,
3
John Gonzales,
1
Erin Nobler,
1
and Eric Wood
1
1 National Renewable Energy Laboratory
2 University of South Florida
, Center for Urban Transportation
Research
3 Florida Department of Agriculture & Consumer Services

NREL is a national laboratory of the U.S. Department of Energy
Office of Energy Efficiency & Renewable Energy
Operated by the Alliance for Sustainable Energy, LLC
This report is available at no cost from the National Renewable Energy
Laboratory (NREL) at www.nrel.gov/publications.
Contract No. DE-AC36-08GO28308
National Renewable Energy Laboratory
15013 Denver West Parkway
Golden, CO 80401
303-275-3000 • www.nrel.gov
Technical Report
NREL/TP-5400-83795
December 2022
Florida Alternative Transportation Fuel
Resilience Plan
Caley Johnson,
1
Jeff Cappellucci,
1
Lauren Spath Luhring,
1
Maria St. Louis-Sanchez,
1
Fan Yang,
1
Abby Brown,
1
Austin Sipiora,
2
Alexander Kolpakov,
2
Xiaopeng Li,
2
Qianwen Li,
2
Sean White,
3
John Gonzales,
1
Erin Nobler,
1
and Eric Wood
1
1 National Renewable Energy Laboratory
2 University of South Florida, Center for Urban Transportation
Research
3 Florida Department of Agriculture & Consumer Services
Suggested Citation
Johnson, Caley, Jeff Cappellucci, Lauren Spath Luhring, Maria St. Louis-Sanchez, Fan
Yang, Abby Brown, Austin Sipiora, Alexander Kolpakov, Xiaopeng Li, Qianwen Li, Sean
White, John Gonzales, Erin Nobler, and Eric Wood. 2022. Florida Alternative
Transportation Fuel Resilience Plan. Golden, CO: National Renewable Energy
Laboratory. NREL/TP-5400-83795. https://www.nrel.gov/docs/fy23osti/83795.pdf
.

NOTICE
This work was authored in part by the National Renewable Energy Laboratory, operated by Alliance for
Sustainable Energy, LLC, for the U.S. Department of Energy (DOE) under Contract No. DE-AC36-
08GO28308. This material is based upon work supported by the U.S. Department of Energy’s Office of
Energy Efficiency and Renewable Energy (EERE) under the Energy Technology Development Program
“Statewide Alternative Fuel Resiliency Plan” Award Number DE-EE0008880. The principal investigator of
the award is the Florida Department of Agriculture and Consumer Services.
This report was prepared as an account of work sponsored by an agency of the United States Government.
Neither the United States Government nor any agency thereof, nor any of their employees, makes any
warranty, express or implied, or assumes any legal liability or responsibility for the accuracy, completeness,
or usefulness of any information, apparatus, product, or process disclosed, or represents that its use would
not infringe privately owned rights. Reference herein to any specific commercial product, process, or service
by trade name, trademark, manufacturer, or otherwise does not necessarily constitute or imply its
endorsement, recommendation, or favoring by the United States Government or any agency thereof. The
views and opinions of authors expressed herein do not necessarily state or reflect those of the United States
Government or any agency thereof.
This report is available at no cost from the National
Renewable Energy Laboratory (NREL) at
www.nrel.gov/publications
.
U.S. Department of Energy (DOE) reports produced
after 1991 and a growing number of pre-1991
documents are available
free via www.OSTI.gov
.
Cover Photos by Dennis Schroeder: (clockwise, left to right) NREL 51934, NREL 45897, NREL 42160, NREL 45891, NREL 48097,
NREL 46526.
NREL prints on paper that contains recycled content.
iii
This report is available at no cost from the National Renewable Energy Laboratory at www.nrel.gov/publications.
Acknowledgments
The authors would like to thank the Department of Energy for funding this work. In particular,
they would like to thank Mark Smith and Trev Hall for project oversight. This project was
informed and guided by conversations with many fleet managers, vehicle mechanics, fuel station
operators, emergency response specialists, ChargePoint, the Florida Department of Emergency
Management, Port Tampa Bay, and others. The project would not have been possible without
these experts sharing their insight and data with us and we are very thankful.
iv
This report is available at no cost from the National Renewable Energy Laboratory at www.nrel.gov/publications.
List of Acronyms
AFV alternative fuel vehicle
BCT Broward County Transit
BEB battery-electric bus
BRT bus rapid transit
CNG compressed natural gas
CUTR Center for Urban Transportation Research
DCFC DC fast charger
DEMP Diesel Emissions Mitigation Program
DOE U.S. Department of Energy
EOC emergency operations center
ESF-12 Emergency Support Function 12
EV electric vehicle
EVI-Pro Electric Vehicle Infrastructure – Projection
EVSE electric vehicle supply equipment
FDACS Florida Department of Agriculture and Consumer Services
FDEM Florida Division of Emergency Management
FDOT Florida Department of Transportation
FHWA Federal Highway Administration
GIS geographic information system
iREV Initiative for Resiliency in Energy through Vehicles
JTA Jacksonville Transportation Authority
L1 Level 1
L2 Level 2
LMTV Light Medium Tactical Vehicle
LNG liquefied natural gas
LPG liquefied petroleum gas
MCDA multi-criteria decision analysis
MUSC Medical University of South Carolina
NHTS National Household Travel Survey
NREL National Renewable Energy Laboratory
SAIDI System Average Interruption Duration Index
VBFD Virginia Beach Fire and Rescue Department

v
This report is available at no cost from the National Renewable Energy Laboratory at www.nrel.gov/publications.
Executive Summary
Many counties and cities in Florida are developing resilience plans to help them minimize
damage from hurricanes and accelerate recovery.
1
An Achilles’ heel of these plans is their
dependence on diesel fuel, which is particularly vulnerable to hurricane-related disruptions
because 90% of petroleum in Florida is imported via maritime tanker (EIA 2014). Fuel
diversification can add to Florida’s transportation resilience because if the supply of one fuel gets
disrupted during a hurricane, there is a good chance that the supplies of other fuels are still
available. As Figure ES-1 shows, the four main transportation fuels in Florida have different
means of distribution. If one means of transport (e.g., marine port) is removed, then other means
(e.g., pipeline, rail, cable) could then be relied upon to deliver transportation fuel. The Florida
Alternative Transportation Fuel Resilience Plan aims to address these factors and create a
strategy for how three alternative fuels (natural gas, propane, and electricity) can best be
employed to improve transportation resilience in Florida. It does this through a combination of
literature review and stakeholder engagement for best practices, vehicle technology
recommendations, the creation of three tools (with descriptions and brief guides included), and
charting how stakeholders coordinate to overcome these hurdles.
Figure ES-1. Origin, processing, and distribution of four transportation fuels in Florida.
Source: National Renewable Energy Laboratory
In Florida, various stakeholders share responsibility for emergency preparedness and resilience,
and actions and decisions are made at multiple levels, including government, the private sector,
and communities. These stakeholders receive direction from the State of Florida Comprehensive
Emergency Management Plan (CEMP), which is administered by the Florida Division of
1
County and city resilience resources and plans listed in the Florida Resilience Tool, https://widgets-stage.tada-
stage.nrel.gov/tada/fl-resiliency/.

vi
This report is available at no cost from the National Renewable Energy Laboratory at www.nrel.gov/publications.
Emergency Management (FDEM). Stakeholders convened via webinar at the beginning of this
project and revisited numerous times so their wide variety of perspectives could help inform the
plan. Fleet partners helped develop a list of best practices for fleets, including vehicle
recommendations, fueling prioritization strategies, redundancies in fuel supply networks, and
fuel tanker logistics. Site visits also provided input that was incorporated into the plan. None of
the visited alternative fuel fleets experienced interruptions in fuel supply to their alternative fuel
vehicles (AFVs) during recent hurricanes (in the past ~7 years), even when diesel and gasoline
supplies were interrupted due to port closures. Fleets increased the resilience of their natural gas
and propane supplies by using mobile fueling units.
The supply chain of alternative fuels, as shown in Figure ES-1, is diverse in Florida. Natural gas
comes via four interstate pipelines. Propane is a byproduct of both natural gas and petroleum
processing facilities and is imported to the state via rail. Electricity in Florida is generated largely
from natural gas (with fuel oil as backup), two nuclear power plants, coal, solar, and biofuels.
Alternative fuels are then sold to vehicles through 28 electricity, 15 natural gas, 11 propane, 10
biofuel, and 3 hydrogen vendors.
Hurricanes can limit communication by knocking out cellphone towers and other
communications infrastructure while simultaneously increasing the need for fleet and vehicle
communications to facilitate evacuation and recovery operations. Surveyed fleets reported
communicating via radio, cellphones, and landlines during disaster situations. However, some of
the fleets that could be most beneficial during evacuation, such as propane school buses or
natural gas-fueled power line repair vehicles, are prioritized below first responders and might not
have access to their radio channels. Electric vehicle supply equipment (EVSE) normally
communicates with drivers through its network and mobile applications. EVSE is built to
withstand 18 inches of standing water (per the National Electrical Code), but if this threshold is
surpassed and the hardware is damaged, it cannot be brought back online until a technician
physically inspects it. ChargePoint (the largest EVSE network company in Florida) has mobile
fast chargers on skids/trucks with 4 feet of clearance that can be moved to strategic locations and
connected quickly to the grid.
To facilitate the use of alternative fuels before and during a hurricane, the National Renewable
Energy Laboratory (NREL) developed a Florida Resiliency Tool website to help facilitate
planning and communications. Available at https://widgets-stage.tada-stage.nrel.gov/tada/fl-
resiliency/, this website uses state-of-the-art technologies to provide useful maps, information,
connections, and other resources. A second tool developed as part of this plan is an electric
vehicle evacuation planning prototype web tool to prepare the state for using electric vehicles
(EVs) before and during an emergency event. This tool, developed by the University of South
Florida (USF), uses a novel algorithm to coordinate reservations for EVs to charge along
evacuation routes.
Resilience should be considered when planning and building out the nascent EVSE network in
Florida. Therefore, NREL projected the number of EVs in each Florida county in 2030 and 2050
and used the Electric Vehicle Infrastructure – Projection (EVI-Pro) tool to estimate how much
public EVSE will be needed to charge those vehicles. Florida is estimated to have 74,000 EVs in
2030, with 17% of them being plug-in hybrid EVs and 83% battery-electric vehicles. These EVs
will need 45,485 nonresidential EVSE chargers by 2030. To be specific, 54% are workplace

vii
This report is available at no cost from the National Renewable Energy Laboratory at www.nrel.gov/publications.
Level 2 chargers, 34% are public Level 2 chargers, and 12% are fast chargers. By 2030, Broward
County will have the most significant need for EVSE, whereas Lafayette County will require the
least EVSE.
NREL also developed a geographic information system (GIS) model for two purposes: (1) to
identify potential locations for new AFV stations to increase the connectivity of the road network
for AFVs evacuating or performing emergency response duties, and (2) to address future needs
for EVSE by comparing counts of current EVSE ports against future EVSE needs forecast by
EVI-Pro. This analysis considered flood zones, emergency shelters, evacuation routes, AFV
refueling infrastructure, garage locations of AFV fleets, and the EV and EVSE projections from
EVI-Pro. After removing stations that are at risk of flooding, the percentage of evacuation routes
covered by each AFV service area averaged 87.6%. However, after integrating proposed new
stations at emergency shelters, the coverage increased to an average of 99.0%. The tool was also
used to track progress toward meeting the required number of DC fast-charging ports in 2030.
Several of the more populated counties need more than 200 stations to meet their goals, and
other counties were already at or near their 2030 targets. The GIS-based Alternative Fuel
Resilience tool was made available to planners and analysts at
https://nrel.maps.arcgis.com/apps/mapviewer/index.html?webmap=70d980d59f39453387d8286f
cb505ae1, and a case study was developed for instruction using the tool. Finally, the
methodologies and findings of this analysis were compared to relevant portions of the Florida
Electric Vehicle Roadmap (Burk et al. 2020) and the EV Infrastructure Master Plan (FDOT
2021).
This plan must interact with other aspects of resilience planning in Florida, so relevant laws,
regulations, and organizations were described. The state’s 10 regional planning councils and the
Florida Division of Emergency Management were identified as particularly important to work
with.
A vehicle’s ability to drive through standing water can be crucial during a hurricane, so NREL
and USF conducted a literature review and held multiple interviews on this topic. Fleet managers
should try to purchase vehicles with high air intake or modify the air intake system to raise the
height. Fleet managers must ensure that electrical components are water-resistant or move them
to higher locations on the vehicle. It is also important to remotely mount vent tubes to the
transmission and differential at the highest points possible. Vehicle buoyancy is a key
consideration, and liftoff occurs later (deeper) in vehicles with higher clearance, greater mass,
smaller footprint, and better tire traction. Vehicles powered by propane or natural gas have
completely sealed fuel systems, reducing the likelihood of water infiltration. EVs do not need
oxygen to operate, and key components are often waterproofed (Evarts 2018). This has enabled
the EV company Rivian to claim in the specifications of their R1S and R1T that these vehicles
can drive through 43 inches of standing water.
2
Likewise, DD DANNAR claims that its electric
off-road work vehicles can operate in up to 4 feet of water.
3
However, 11 EVs from other
manufacturers auto-ignited after Hurricane Ian (Weise 2022), accelerating research into the
impact that extended periods of saltwater submersion has on EVs.
2
https://rivian.com/support/article/what-is-the-water-fording-height
3
https://www.dannar.us.com/
viii
This report is available at no cost from the National Renewable Energy Laboratory at www.nrel.gov/publications.
Table of Contents
1 Introduction ........................................................................................................................................... 1
2 Background ........................................................................................................................................... 3
3 Stakeholders and Involvement ............................................................................................................ 4
Fuel Resilience Stakeholders .................................................................................................................. 4
Stakeholder Kickoff Meeting ................................................................................................................. 6
Fuel Resilience Best Practices for Fleets ................................................................................................ 6
Site Visits ............................................................................................................................................... 8
4 Supply Chain of Natural Gas, Propane, and Electricity in Florida .................................................. 9
Upstream Sources of Alternative Fuels .................................................................................................. 9
Alternative Fuel Vendors ..................................................................................................................... 11
5 Communications Practices and Protocols ...................................................................................... 13
Current Status and Shortcomings of Communications During Hurricanes .......................................... 13
Solution 1: New Website to Facilitate Planning ................................................................................... 15
Solution 2: EVSE Communications Algorithms and Web Tool .......................................................... 18
6 Long-Term Planning for Electric Vehicle Infrastructure Expansion ............................................. 24
Electric Vehicle Infrastructure Projections Method Overview ............................................................ 24
Vehicle and Infrastructure Attribute Assumptions ............................................................................... 25
Florida County-Level Travel Demand Assumptions ............................................................................ 26
EVI-Pro Simulation Analysis and Results ........................................................................................... 27
7 GIS-Based Preparation for Hurricanes ............................................................................................. 34
Utilizing Current Infrastructure Data ................................................................................................... 35
Future Infrastructure Identification Methods ....................................................................................... 37
Key Findings of GIS Analysis .............................................................................................................. 40
Florida Alternative Fuel Resilience Web Map Local Usage Example ................................................. 44
Comparison to Florida’s EV Roadmap and EV Master Plan ............................................................... 47
GIS Summary ....................................................................................................................................... 48
8 Laws, Regulations and Organizations Relevant to Resilience Planning ...................................... 49
Relevant Laws and Regulations ........................................................................................................... 49
Re
gional Planning Councils ................................................................................................................. 49
Resilient Florida ................................................................................................................................... 50
Functions of the Florida Department of Agriculture and Consumer Services ..................................... 50
9 Vehicles in Standing Water ............................................................................................................... 51
Important Components of High-Water-Capable Vehicles ................................................................... 51
Electric Vehicles and Flooding ............................................................................................................ 53
High-Water Fleet Experiences ............................................................................................................. 53
High-Water Vehicle Conclusions and Recommendations ................................................................... 55
10 Conclusions and Recommendations ............................................................................................... 56
References ................................................................................................................................................. 57
Appendix A. SAIDI Zone Data Provided to NREL .................................................................................. 62
Appendix B. Site Visit Summaries .......................................................................................................... 63
Waste Pro Facility and CNG Fueling Site ............................................................................................ 63
Seminole County Schools..................................................................................................................... 66
City Furniture ....................................................................................................................................... 68
Broward County Transit – Paratransit Division ................................................................................... 72
Jacksonville Transportation Authority ................................................................................................. 76
Appendix C. Alternative Fuel Vendors .................................................................................................... 82
Appendix D. MCDA Algorithm for Potential New Fuel Station Identification ..................................... 88
Appendix E. Workflow for Future EVSE Needs Mapping ...................................................................... 89
Appendix F: Literature Review for Vehicles in Standing Water ........................................................... 90
Background and Purpose ...................................................................................................................... 90
ix
This report is available at no cost from the National Renewable Energy Laboratory at www.nrel.gov/publications.
Vehicle Water Damage......................................................................................................................... 90
Preventing Water Damage........................................................................................................... 90
Common Vehicle Damage and How To Assess and Repair It .................................................... 91
Assessing and Repairing Common Damage ............................................................................... 91
Engine and Transmission ............................................................................................................ 92
Electrical Components ................................................................................................................ 93
Interior Considerations ................................................................................................................ 93
Case Study: Virginia Beach Fire and Rescue ....................................................................................... 93
Equipment Used and Damage Found .......................................................................................... 94
Potential Vehicle Modifications To Avoid Damage ................................................................... 94
Driver Training ............................................................................................................................ 95
Results 95
Preparing Fleets for Hurricanes and Flooding ...................................................................................... 95
Emergency Operating Plans ........................................................................................................ 96
Vehicle Planning and Repositioning ........................................................................................... 97
Driver Training ............................................................................................................................ 98
Other Considerations ................................................................................................................... 98
Preferred Vehicles for Driving Through Floodwaters .......................................................................... 98
Conclusion ............................................................................................................................................ 98
x
This report is available at no cost from the National Renewable Energy Laboratory at www.nrel.gov/publications.
List of Figures
Figure ES-1. Origin, processing, and distribution of four transportation fuels in Florida. ........................... v
Figure 1. Origin, processing, and distribution of four transportation fuels in Florida. ................................. 2
Figure 2. Categories of fuel resilience stakeholders ..................................................................................... 5
Figure 3. Alternative Transportation Fuel Resilience Plan design and implementation model .................... 6
Figure 4. Florida’s Four Interstate Natural Gas Pipelines ........................................................................... 10
Figure 5. Florida Resilience Tool homepage .............................................................................................. 15
Figure 6. County-specific resources appear when a county is selected. ..................................................... 16
Figure 7. Florida Resilience Tool map layers ............................................................................................. 17
Figure 8. Accessing fuel-specific station location by county ..................................................................... 17
Figure 9. Station-specific information provides detail ................................................................................ 18
Figure 10. Detailed emergency GIS information accessible in the Florida Resilience Tool ...................... 18
Figure 11. EV Evacuation Tool homepage ................................................................................................. 20
Figure 12. Signup and login to the EV Evacuation Tool ............................................................................ 20
Figure 13. Evacuation reservation in the EV Evacuation Tool ................................................................... 21
Figure 14. Back-end evacuation planning algorithm structure ................................................................... 22
Figure 15. Evacuation route ........................................................................................................................ 23
Figure 16. EVI-Pro model structure and data flow ..................................................................................... 25
Figure 17. Florida county-level population density and EV fleets ............................................................. 27
Figure 18. EV charging load profiles in 2030, n = 80,000 ......................................................................... 28
Figure 19. Comparison of 2030 and 2050 EV charging infrastructure ....................................................... 32
Figure 20. Summary of the two geospatial Florida AFV flood resilience analyses .................................... 34
Figure 21. FHWA alternative fuel corridor requirements. .......................................................................... 35
Figure 22. Florida flood risk, emergency shelters, and evacuation routes. ................................................. 36
Figure 23. Level 2 EVSE and related 50-mile radius EV service map ....................................................... 38
Figure 24. Propane vehicle vulnerability map ............................................................................................ 39
Figure 25. Best new CNG station locations identified by the analysis ....................................................... 41
Figure 26. Number of DCFC Ports Required to Meet 2030 Goals ............................................................. 42
Figure 27. Resilience web map features while planning EV resilience in Dixie County ........................... 45
Figure 28. Example of the ability to add new data to the resilience web map ............................................ 46
Figure 29. Example use case after adding gasoline station data to the resilience web map ....................... 47
Figure 30. Medium-duty vehicle and its points of vulnerability to standing water. ................................... 53
Fi
gure B-1. Gauge above 400 psi at WastePro. .......................................................................................... 64
Figure B-2. Natural gas line service inlet at 100 psi. .................................................................................. 65
Figure B-3. 400-kW genset at Seminole County Schools. .......................................................................... 67
Figure B-4. Diesel storage at Seminole County Schools (2,877 gallons). .................................................. 67
Figure B-5. CNG fleet using time-fill. ........................................................................................................ 69
Figure B-6. City Furniture electric Kalmar Ottawa yard truck. .................................................................. 70
Figure B-7. City Furniture CNG station. .................................................................................................... 71
Figure B-8. City Furniture CNG delivery fleet. .......................................................................................... 72
Figure B-9. BCT paratransit bus fueling with propane. .............................................................................. 73
Figure B-10. BCT propane paratransit buses. ............................................................................................. 74
Figure B-11. BCT propane fueling facility. ................................................................................................ 75
Figure B-12. JTA battery-electric bus. ........................................................................................................ 77
Figure B-13. JTA CNG fueling station. ...................................................................................................... 78
Figure B-14. JTA on-site diesel fuel storage. ............................................................................................. 78
Figure B-15. Electric bus charging station installation. .............................................................................. 79
xi
This report is available at no cost from the National Renewable Energy Laboratory at www.nrel.gov/publications.
List of Tables
Table 1. Alternative Fuel Vendors in the State of Florida .......................................................................... 11
Table 2. EV Charging Infrastructure Technology Specifications ............................................................... 26
Table 3. 2030 EV Nonresidential Charging Infrastructure Projection ........................................................ 28
Table 4. 2050 EV Nonresidential Charging Infrastructure Projection ........................................................ 30
Table 5. AFV Corridor Coverage Change With Proposed New Stations ................................................... 40
Table 6. Current and Modeled DCFC Port Counts by Florida County ....................................................... 42

1
This report is available at no cost from the National Renewable Energy Laboratory at www.nrel.gov/publications.
1 Introduction
Hurricanes are increasing in frequency, intensity, and duration and are projected to continue
increasing (Knutson 2022; Kossin 2018). Many counties and cities in Florida are developing
resilience plans to help them minimize damage from hurricanes and accelerate recovery.
4
The
transportation portions of these plans tend to focus on bolstering road infrastructure, stockpiling
diesel for strategic fleets, purchasing high-water vehicles, and placing evacuation shelters in safe
areas. An Achilles’ heel of these plans is their dependence on diesel fuel, which is particularly
vulnerable to hurricane-related disruptions because 90% of petroleum in Florida needs to be
imported via maritime tanker (EIA 2014). These tankers are restricted from accessing Florida
ports before and during hurricanes because the risks of damage to the port facilities and tanker
are too high. Therefore, transportation resilience can be fortified by diversifying the
transportation fuels utilized in a hurricane.
Fuel diversification can add to the transportation resilience of Florida because if the supply of
one fuel gets disrupted during a hurricane, there is a good chance that the supplies of other fuels
have not. As Figure 1 shows, the four main transportation fuels in Florida have very different
means of distribution, and if one means (e.g., marine port) is removed, then other means (e.g.,
pipeline, rail, cable) could then be relied upon to deliver transportation fuel.
Fuel diversification is complicated by a few factors. First, there must be vehicles available that
can use an alternative fuel, be useful for hurricane evacuation or recovery purposes, and also be
useful outside of hurricane operations. These vehicles are discussed in Section 4. Second,
alternative fuels have fewer and less standardized refueling stations, so fleets must be able to
communicate with the stations to know their operating status and compatibility with their
vehicles (Section 5), and new stations need to be added strategically (Sections 6 and 7). Third,
alternative fuel vehicles (AFVs) and conventional vehicles need to be assessed for their
capabilities in driving through standing water, which would likely be required during hurricane
recovery operations (Section 9). The Florida Alternative Transportation Fuel Resilience Plan
aims to address these factors and create a plan for how alternative fuels can best be used to
improve transportation resilience in Florida. It does this through a combination of literature
review and stakeholder engagement for best practices, vehicle technology recommendations, the
creation of three tools (with descriptions and brief guides included), and charting how
stakeholders coordinate to best overcome these hurdles.
4
County and city resilience resources and plans listed in the Florida Resilience Tool, https://widgets-stage.tada-
stage.nrel.gov/tada/fl-resiliency/.

2
This report is available at no cost from the National Renewable Energy Laboratory at www.nrel.gov/publications.
Figure 1. Origin, processing, and distribution of four transportation fuels in Florida.
Source: National Renewable Energy Laboratory
This plan follows a framework used for numerous supplies during natural disasters, including
water, food, and medical supplies. The first step is to add redundancy to the supply. This is done
through fuel diversification, as mentioned previously and discussed throughout the majority of
this report. The second step is to have adequate storage. State and local resilience plans address
this for petroleum used by essential fleets, and this plan addresses this for alternative fuels. The
third step is to ensure access to supplies. This plan does this for alternative fuels through a
geographic information system (GIS) analysis that estimates which fueling locations are likely to
remain accessible and by setting up a communication system so alternative fuel fleets can ensure
that a station can accommodate them during a hurricane. It goes further for electric vehicles
(EVs), where a reservation system and coordinating algorithms is proposed to coordinate the
charging of numerous evacuating EVs. The fourth step is to resupply as quickly as possible; the
plan discusses the rates at which various fuels are likely to be resupplied after a hurricane. The
fifth step is to improve the efficiency with which a given amount of fuel is used, so that a
maximum amount of transportation services might be rendered per a given amount of fuel. The
plan discusses the relative efficiency of evacuation and emergency vehicles and compares
efficiency between fuels.

3
This report is available at no cost from the National Renewable Energy Laboratory at www.nrel.gov/publications.
2 Background
State departments of transportation have a long history of supporting transportation resilience,
but they are mainly focused on infrastructure rather than fuel supplies.
5
Likewise, local resilience
planning agencies have a history of focusing on transportation infrastructure and storing diesel
reserves for strategic yet conventional vehicles. The U.S. Department of Energy (DOE) assessed
the resilience of various fuels in their seminal 2014 three-part report United States Fuel
Resilience: U.S. Fuels Supply Infrastructure (DOE 2014). These reports set a useful definition of
resilience as “the ability to withstand small to moderate disturbances without loss of service, to
maintain minimum service during severe disturbances, and to quickly return to normal service
after a disturbance.” This is the definition that we use in this plan. The DOE report highlighted
numerous chokepoints in the petroleum supply, transportation, storage, and distribution
infrastructure and the relative resilience of the natural gas and propane infrastructure. In doing
so, they discussed the relative fragility of the electric grid (largely due to lack of storage
capacity), but their focus was on the interactions between the electric grid and the supply of other
fuels rather than electricity as an end-use fuel. For example, electricity is needed to pump diesel
out of underground storage tanks or to compress natural gas. In general, the focus of the 2014
report was upstream of the fuel dispensers and vehicles.
The first initiative to assess and utilize alternative fuels to improve transportation resilience was
the Initiative for Resiliency in Energy through Vehicles (iREV) program. This was a joint project
with DOE’s Clean Cities program and the National Association of State Energy Officials
(NASEO). iREV began by documenting the role of natural gas minibuses helping New Jersey
recover from Hurricane Sandy when diesel was in short supply.
6
Throughout 2015 and 2016,
iREV published a series of case studies of using alternative fuels in emergency response
vehicles.
7
In 2017, a GIS-based iREV-Tracking tool was created to help coordinate alternative
fuel stations and national-level critical infrastructure when planning for emergencies.
8
In addition to iREV case studies, the utilization of alternative fuels during natural disasters has
also been documented. During Japan’s 2011 tsunami, oil refineries were destroyed but electricity
was still available in some areas. Therefore, EVs were an asset in transporting small items like
medicines and transporting doctors and building inspectors so that buildings could be safely
reopened (Belson 2011). This event inspired Nissan’s “Leaf to Home” power exporter. Wildfires
in California proved another value for EVs when the Pacific Gas and Electric Company began
using their Class 5 plug-in hybrid electric vehicle utility trucks with exportable power modules to
provide power to evacuation shelters (Morris 2015). Compressed natural gas (CNG) was
documented fueling buses in the face of diesel shortages during Hurricane Sandy (Atlantic City
9
)
and Hurricane Harvey (Houston
10
). Propane-fueled school buses transported medical personnel
to hospitals during Hurricane Sandy (New York) and evacuated residents of Tampa during
5
As reflected by the agendas of the Transportation Research Board’s Transportation Resilience Innovations Summit
and Exchange annual meetings, www.trb.org.
6
https://www.naseo.org/irev
7
https://www.naseo.org/irev
8
https://irev.ctc.com/Account/Login
9
https://afdc.energy.gov/case/1323
10
https://afdc.energy.gov/case/3078
4
This report is available at no cost from the National Renewable Energy Laboratory at www.nrel.gov/publications.
Hurricane Irma (Thompson 2017). These disasters were the proving grounds for the potential of
alternative fuels during natural disasters.
Of the three alternative fuels utilized by this resilience plan, electric vehicle stock is projected to
grow the most (EIA 2021). Therefore, Florida has published two documents outlining the state‘s
strategy for building out infrastructure. These are the Florida Electric Vehicle Roadmap (Burk et
al. 2020) and EV Infrastructure Master Plan (Florida Department of Transportation [FDOT],
2021). Both of these plans focus on electric vehicle supply equipment (EVSE) needs during
nonemergency times, briefly addressing hurricane evacuation routes. Comparisons between these
EV infrastructure development plans and this plan are included in our GIS analysis in Section 7.
3 Stakeholders and Involvement
The researchers integrated input from a wide variety of stakeholders from various geographic
areas of the state representing organizations that are involved in resilience planning or providing
critical transportation functions during emergencies. Over 240 stakeholders were identified for
this study from which to potentially seek input, including representatives from airports, ports,
local governments, county school districts, conventional and alternative fuel suppliers, transit
agencies, local and regional planning agencies, state agencies, vehicle manufacturers, and
utilities, as well as universities, research institutions, Clean Cities coalitions, advocacy groups,
and other stakeholders.
Fuel Resilience Stakeholders
Responsibility for emergency preparedness, response, and resilience is shared among various
stakeholders, and actions and decisions are made at multiple levels, including government,
private sector, and communities. See Figure 2 for responsible stakeholders, which include
emergency managers, planners, and public agencies responsible for decision-making during
emergency conditions. To plan and implement fuel resilience strategies, there is a need for cross-
collaboration among both public and private entities and to engage both responsible and
impacted stakeholders. Fuel resilience involves stakeholders across jurisdictions and requires
intergovernmental coordination, collaboration, and planning given that vulnerabilities are
embedded across stakeholder groups and government jurisdictions.

5
This report is available at no cost from the National Renewable Energy Laboratory at www.nrel.gov/publications.
Figure 2. Categories of fuel resilience stakeholders
In the state of Florida, emergency response is dictated by the State of Florida Comprehensive
Emergency Management Plan (CEMP), which is administered by the Florida Division of
Emergency Management (FDEM). The plan provides a unified framework for all levels of
government within the state to respond to emergencies that is in accordance with federal
guidelines (FDEM 2020). It contains strategies, objectives, and means of mobilizing resources
and guidance for local governments to coordinate all stages of emergency management,
including emergency preparedness, response, recovery, and mitigation.
Within the State of Florida Comprehensive Emergency Management Plan, the state has
designated the Emergency Support Function 12 (ESF-12) as the function responsible for
ensuring that policies and procedures that are used by the Public Service Commission, and others
engaged in responding to and recovering from power disruptions. Recently, Florida has split the
roles of ESF 12, creating ESF 19 – Fuels to assist with all transportation fuel and propane
response in the state. ESF 19 is housed at FDEM in the Infrastructure Branch, and FDEM is the
primary agency tasked with coordinating with fuel suppliers to ensure adequate supplies of fuel
are available. Response actions are coordinated and communicated with the public and
governmental agencies with support from additional agencies and organizations, such as the
Florida Department of Agriculture and Consumer Services, Florida Department of
Environmental Protection, Florida Department of Health, Florida Department of Transportation,
Florida National Guard, Florida Petroleum Council, American Petroleum Institute, Florida
Trucking Association, Florida Petroleum Marketers Association, and Florida Propane Gas
Association, as well as various industry trade groups and associations. ESF-12 is responsible for
coordinating agencies and organizations with identifying response and recovery needs,
maintaining communications with fuel and energy providers, supporting the State Emergency
Response Team and local emergency operations centers to determine emergency fuel needs,
aiding local government agencies with identifying fuel providers, and maintaining
communications with electric utilities and support agencies responsible for recovery and
response of electric generating capacities and outages (FDEM 2020).

6
This report is available at no cost from the National Renewable Energy Laboratory at www.nrel.gov/publications.
Stakeholder Kickoff Meeting
A stakeholder webinar—held in September 2020 by the Florida Energy Office in partnership
with the Tampa Bay Clean Cities Coalition, University of South Florida, National Renewable
Energy Laboratory (NREL), and Florida Solar Energy Center—informed stakeholders on the
state resilience initiative work plan and solicited stakeholder input. The goal of the workshop
was to gain insight from stakeholders to inform the development of the Alternative
Transportation Fuel Resilience Plan following the implementation model (see Figure 3).
Figure 3. Alternative Transportation Fuel Resilience Plan design and implementation model
Over 80 people attended the stakeholder workshop, representing local governments, state
governments, EVSE suppliers, airports/ports, nonprofit organizations, utilities, and other
organizations. A poll of the attendees revealed that the majority of participating fleets have
emergency fueling plans for hurricanes and other emergency events. The majority of participants
indicated that their fleets play a critical role for transporting people and/or goods before, during,
and after hurricanes, while a few others can also use their vehicles for critical roles if needed.
Participants noted that a lack of fueling infrastructure and costs of AFVs and infrastructure
remain the biggest obstacles for using alternative fuels. Following the stakeholder webinar, the
Florida Solar Energy Center published a “Resilient Florida Buildings” brochure (FSEC 2021).
Fuel Resilience Best Practices for Fleets
In addition to the workshop, researchers also reached out to individual fleets to seek input
regarding best practices in resilience initiatives. Finally, some of the preliminary findings from
the Tampa Resilience study (Kolpakov et al. 2021) also informed the development of this plan.
Lessons learned from previous hurricane events in Florida include:
• Asset staging prior to hurricane landfall is a key step for public fleets to preserve critical
transportation assets by moving them from low-lying areas to higher elevations.
• Navigating flooded streets and performing recovery operations after a hurricane may
require high-water-capable vehicles. The capability of the vehicle to operate in standing
7
This report is available at no cost from the National Renewable Energy Laboratory at www.nrel.gov/publications.
water conditions is typically determined by the vehicle clearance and the position of air
intake at the highest possible point aboveground.
• Off-road equipment (e.g., loaders, dump trucks, claw trucks) is often required to remove
debris from roadways after a hurricane to restore critical transportation functions.
• Fuel strategy is critical to fleet preparation during an emergency event. Critical public
fleets are encouraged to maintain adequate fuel storage on-site (underground or
aboveground) that can sustain fleet operation for at least a week in case of fuel shortage.
Fueling prioritization strategies can be implemented to determine which vehicles fuel
first during a shortage.
• Accurately predicting fuel burn rate under emergency conditions is challenging but an
essential calculation for estimating fuel supply needs, particularly for public agencies
responsible for fueling generators. It is not uncommon for fleets to consume 2–3 times
more fuel under emergency conditions than during normal operations.
• Fuel diversification is an important resilience strategy, which may include diversifying
fuel supply channels (e.g., receiving fuel from different geographic areas, by different
delivery methods) and diversifying types of fuel used (e.g., use AFVs, flex-fuel vehicles,
and solar-powered EV charging stations).
• It is necessary to plan for redundancies in fuel supply networks to ensure the resilience of
fuel supply.
• Investing in backup electricity generators, including generators powered by alternative
fuels, is a wise strategy for fleets and facilities responsible for providing critical services
before, during, or after natural disasters.
• Sharing fuel resources between critical public fleets is a resilience strategy already
employed through the use of formal and informal agreements between local governments.
This practice can also be expanded to include better collaboration between public and
private fleets.
• Police escorts for fuel tankers may be needed to ensure timely delivery on congested
roads impacted by evacuation efforts.
• Electricity outages can contribute to fuel shortages caused by the disruption of fuel
supply channels resulting from natural disasters. Even if fuel is available, electricity is
often required to dispense it. Therefore, quick restoration of power to fueling sites after a
hurricane is crucial for ensuring that critical services will be provided.
A variety of different vehicles can be used for emergency response and recovery operations.
Transit vehicles (including large and small buses) and school buses are often used for evacuating
people and/or transporting work crews to impacted sites. Despite relatively high clearance,
transit and school buses do have limitations regarding the level of standing water in which they
can safely operate. Usually, the safe water level for a transit or school bus is just a few inches (5–
8 inches of water). Operating in higher water levels can be harmful for the bus undercarriage
components, including the rear differential, air brake system, and many grease-lubricated parts
that can be damaged if submerged in water. See section 9 for more details. Both transit and
school buses can be powered by various alternative fuels, including propane, CNG, and
electricity.
Fleets can employ high-water-capable tactical vehicles (often former military vehicles),
including Humvees and 5-ton trucks with high clearance, to transport equipment and personnel
8
This report is available at no cost from the National Renewable Energy Laboratory at www.nrel.gov/publications.
during flooding events. Such vehicles are rarely designed to run on alternative fuels but can be
converted to run on propane or CNG.
Finally, there is a variety of off-road equipment that can be used for recovery operation and can
withstand high-water conditions, at least for some time. While most off-road equipment
brands/models are currently powered by conventional petroleum fuels, some of those vehicles
can operate on alternative fuels. For example, available models/brands currently on the market
include battery-electric mobile power stations that can use changeable attachments for
performing various tasks, have high clearance, are rated to operate in 3–4 feet of standing water,
and can be operated by a remote control from a significant distance. The ability to withstand
standing water and remote-control capability provide great potential for using such vehicles for
recovery operations after hurricanes/floods without placing the operator in danger.
The capability of such vehicles to remain operational while being submerged in standing water
for a prolonged period of time is questionable. Furthermore, saltwater presents additional
challenges since it is significantly more corrosive than fresh water. Even completely sealed
vehicle components can get damaged by being submerged in salt water for a prolonged period of
time, so even high-water-capable vehicles may need evaluation and repairs after encountering
salt water.
Site Visits
This plan incorporates best practices and lessons learned from site visits to five alternative fuel
fleets throughout Florida, including both public and private fleets. The site visits that informed
the development of the current plan include the following fleets: WastePro (Samford), Seminole
County Schools (Winter Springs), City Furniture (Tamarac), Broward County Transit
(Plantation), and Jacksonville Transportation Authority (Jacksonville). Reviewed technologies
included CNG, propane, and battery-electric.
Despite differences in visited fleets and types of reviewed alternative fuel technologies, some
similarities in resilience practices were noted. The common takeaways from these site visits
included:
• None of the visited alternative fuel fleets experienced interruptions in fuel supply to their
AFVs (natural gas, propane, or EVs) during recent hurricanes (in the past ~7 years). Even
when diesel and gasoline supply were interrupted due to port closures during past
hurricanes, alternative fuel remained available to the reviewed fleets.
• None of the visited fleets encountered standing water conditions during previous
hurricane events. At the same time, some of the vehicles in the visited properties are
capable of handling high standing water (e.g., refuse trucks).
• Fleets that use CNG and propane have access to mobile fueling systems that can be used
to deliver fuel in case of interruptions during natural disasters. This includes both their
own mobile fueling vehicles and vehicles owned by fuel suppliers.
• Most visited fleets rely on diesel-powered generators to provide emergency power in case
of power outages. Fleets typically maintain adequate supply of diesel for diesel-powered
generators. Few fleets also employ alternative fuel-powered generators to provide backup
power (e.g., CNG).
9
This report is available at no cost from the National Renewable Energy Laboratory at www.nrel.gov/publications.
• Several visited fleets (both public and private) received and accommodated requests in
the past to share fuel with other essential fleets (mainly government fleets) in the
aftermath of hurricanes. Such requests were typically coordinated through the emergency
operations center (EOC).
• During the times of fuel shortage, such as during or after a hurricane, it is common
practice for fleets to ration fuel depending on the routes and ranges required for vehicles
to perform essential tasks.
• Fueling all vehicles (including AFVs) prior to a hurricane is a common strategy used by
fleets to prepare for the upcoming impact.
• Several visited fleets experienced severe accidents involving AFVs (including rollover
accidents and vehicle fire), none of which caused fuel tank rapture, demonstrating the
safety of AFVs.
Summaries of all the site visits are provided in Appendix B.
4 Supply Chain of Natural Gas, Propane, and
Electricity in Florida
The diversity of supply chains for alternative fuels is a large part of why they add to the
resilience of transportation systems in Florida. This section assesses the upstream supply chains
of alternative fuels and lists vendors of alternative fuels to enable fleets and refueling stations to
access the fuels.
Upstream Sources of Alternative Fuels
This subsection tracks the source and upstream pathways of alternative fuels in Florida in order
to assessing their resilience. Florida receives its natural gas supplies from four interstate
pipelines, as shown in Figure 4 and described below:

10
This report is available at no cost from the National Renewable Energy Laboratory at www.nrel.gov/publications.
Figure 4. Florida’s Four Interstate Natural Gas Pipelines
Source: EIA
• The Florida Gas Transmission line runs from Texas through the Florida Panhandle to
Miami;
• The Gulfstream Gas System is an underwater pipeline running under the Gulf of Mexico
from Mississippi and Alabama to Central Florida;
• The Sabal Trail pipeline runs from Alabama to Orange County; and
• The Cypress Pipeline supplies liquified natural gas to the Jacksonville area from Elba
Island, Georgia.
Propane stocks are abundant nationally, with nearly 78 million barrels of supply available as of
September 9, 2022 (EIA 2022). As a byproduct of domestic natural gas processing and
petroleum refining, they come from similar locations as natural gas and petroleum. However,
they are generally delivered via rail to Florida instead of pipeline. Florida belongs to the
Petroleum Administration for Defense Districts (PADD) Subdistrict 1C, which includes the
Lower Atlantic States. The PADD is the Federal classification used for organizing the allocation
of fuels derived from petroleum products.
Florida is one of the largest generators of electricity in the nation, second only to Texas.
Florida’s primary fuel source (fueling ¾ of all electricity) is natural gas, but 2/3 of these power
plants can use fuel oil as a backup fuel source. The remaining ¼ of Florida’s electricity is fueled
by a diverse set of two nuclear power plants, coal-fired power plants, solar and biofuels, listed
from largest to smallest contributors (EIA 2021).

11
This report is available at no cost from the National Renewable Energy Laboratory at www.nrel.gov/publications.
Alternative Fuel Vendors
All Clean Cities coalitions in the state of Florida, including Tampa Bay Clean Cities, Southeast
Florida Clean Cities, Central Florida Clean Cities, and North Florida Clean Fuels, collaborated to
compile a list of alternative fuel vendors in Florida. Identified organizations include vendors of
various alternative fuels (CNG, propane, ethanol, biodiesel), utilities, infrastructure providers,
stationary and mobile generator suppliers, and other types of organizations that may be useful for
providing redundancy in service during emergency events.
Table 1 provides an inventory of 62 alternative fuel vendors. These include 28 electricity, 15
natural gas, 11 propane, 10 biofuel, and 3 hydrogen vendors (some vendors offer more than one
fuel). While most listed vendors are headquartered in Florida, some are not. Instead, they have a
presence in Florida or provide their products/services in the state.
Table 1. Alternative Fuel Vendors in the State of Florida
Organization Name Fuel/Infrastructure Type Location
All in One Propane Propane Leesburg, FL
American Homegrown Fuel
Corporation
Hydrogen, biofuels
American Natural Gas CNG
Amerigas Pr
opane Jacksonville, FL
AmeriGas Propane Propane Tampa, FL
ampCNG Nat
ural gas Chicago, IL
Be-Ev.Com EVSE infrastructure
BioDiesel Las Americas (BDLA) Bi
odiesel production Miami, FL
Blink EVSE infrastructure Miami, FL
Blossman Gas Pr
opane Jacksonville, FL
Brickell Energy EVSE infrastructure Miami, FL
ChargePoint, Inc. EVSE
infrastructure
City of Orlando Electric Orlando, FL
Clean Energy CNG Station Orlando
Ai
rport
CNG Orlando, FL
Clean Energy Fuels Natural gas Dallas, TX
Clearwater Gas System Nat
ural gas Clearwater, FL
Commercial Aviation AF Initiative
(CAAFI)
Aviation fuel
Dannar
Of
froad EV/mobile power
station
Muncie, IN
Duke Energy Electric Charlotte, NC
Efacec USA EVSE
infrastructure
Endera EVSE infrastructure

12
This report is available at no cost from the National Renewable Energy Laboratory at www.nrel.gov/publications.
Organization Name Fuel/Infrastructure Type Location
Ferrell Gas - Pinellas Park Service
Center
Propane Pinellas Park, FL
Fleetwing Corporation Biodiesel, ethanol Lakeland, FL
Florida City Gas CNG Dor
al, FL
Florida Power & Light Company Electric Juno Beach, FL
Florida Public Utilities Nat
ural gas, propane, electric West Palm Beach, FL
Florida Public Utilities Electric, CNG Fernandina Beach, FL
GAIN Clean Fuel CNG Kis
simmee, FL
Gate Petroleum Ethanol, CNG, electric Jacksonville, FL
Glover Oil Bi
odiesel 20 Melbourne, FL
GoSpace EVSE infrastructure
Heritage Propane Pr
opane Tampa, FL
Jacksonville Transportation Authority CNG Jacksonville, FL
JEA Ele
ctric Jacksonville, FL
NASA/KSC Electric/B20/E85/hydrogen Kennedy Space Center, FL
Nopetro Nat
ural gas Coral Gables, FL
NoPetro CNG (LYNX) CNG Orlando, FL
Northside Propane Inc. Pr
opane Lutz, FL
NovaCharge EVSE infrastructure Oldsmar, FL
OBE Power Networks EVSE
infrastructure Miami, FL
Orlando Utilities Commission Electric Orlando, FL
Palatka Gas CNG
Pioneer Critical Power Generators/mobile Miami, FL
Pioneer Power Mobility Mobi
le EVSE/propane Champlin, MN
Pivotal LNG Liquefied natural gas (LNG)
Port Canaveral Ele
ctric/LNG Cape Canaveral, FL
Protec Fuel Management LLC Ethanol Boca Raton, FL
Rack Electric EVSE
infrastructure Boca Raton, FL
Ross Plumbing CNG Leesburg, Fl
St. Johns County CNG
Suburban Propane Propane Tampa, FL
Superior Energy Systems Pr
opane infrastructure Columbia Station, OH
Targray Biodiesel, ethanol Kirkland, Quebec
TECO Energy Ele
ctric Tampa, FL
TECO Peoples Gas CNG Tampa, FL
Tesla Ele
ctric Palo Alto, CA

13
This report is available at no cost from the National Renewable Energy Laboratory at www.nrel.gov/publications.
Organization Name Fuel/Infrastructure Type Location
Thorntons Inc. Ethanol Louisville, KY
TruStar Energy Natural gas Rancho Cucamonga, CA
University of Central Florida Electric/propane Orlando, FL
VISTRA Ele
ctric, natural gas Tampa, FL
Waste Pro CNG Bunnell, FL
Withlacoochee Electric Cooperative Ele
ctric Dade City, FL
Appendix C provides a more detailed list of alternative fuel vendors that includes company
names and contact information.
5 Communications Practices and Protocols
Hurricanes limit communication by knocking out cellphone towers and other communications
infrastructure. At the same time, they increase the need for fleet and vehicle communications to
facilitate evacuation and recovery operations. This section assesses the current fleet
communication strategies during hurricanes, with a focus on areas in need of improvement. It
then introduces two solutions to some of the communications problems that currently limit the
usefulness of alternative fuels before, during, and after a hurricane. The first solution is a website
and GIS mapping tool that NREL created to facilitate emergency planning and ensure that fleets
have the right contacts and information beforehand to minimize the last-minute communication
needs during a hurricane. This website also ensures that fleet managers know the likelihood of
their home station being shut down and the best areas to refuel if their station is no longer
operable. The second solution is a series of algorithms developed by the University of South
Florida’s Center for Urban Transportation Research (CUTR) that maximizes the evacuation
potential of EVSE in a given area by directing vehicles to available EVSE and charging them the
appropriate amount to make it to safety.
Current Status and Shortcomings of Communications During
Hurricanes
At a September 2020 webinar hosted by the FDACS Office of Energy and project partners
Tampa Bay Clean Cities Coalition, University of South Florida, NREL, and the Florida Solar
Energy Center, stakeholders from Florida municipalities were asked about how fleets
communicate with dispatch during hurricanes and other disaster situations.
In preparation for hurricanes, EOC communications are tested, and radios are staged at
accessible locations, including in high-clearance vehicles. Local governments are primarily
responsible for developing and managing local communications plans in coordination with the
state. EOCs have a designated list of where fleet vehicles can refuel, which does not currently
include alternative fuels.
Participants reported that their fleets communicate via radio, cellphones, and landlines during
actual disaster situations. Cell phone outages have not been a problem in recent events, and
communication that occurs from EOCs and backup EOCs also includes email correspondence,
which has remained largely intact in recent events.
14
This report is available at no cost from the National Renewable Energy Laboratory at www.nrel.gov/publications.
During or after a hurricane, public safety is the priority, and first responders have exclusive
access to public emergency radio channels. According to interviews with the Florida Division of
Emergency Management, many school districts have their own designated channels and
dispatchers, and utilities often have their own systems. School bus channels are not prioritized
during emergencies, despite the fact that these high-clearance, high-capacity, often propane-
fueled vehicles could serve as a means of getting people without their own vehicles to
emergency shelters (which are often located in elementary schools) prior to hurricane impacts.
Utilities and telecommunications services have their own radio channels and are given second
priority by the Division of Emergency Management after first responders. This covers many of
the utility-owned, CNG-fueled vehicles used to repair power lines.
Along with the commercial-grade radio, amateur radio network (ham), satellite phones, business
band radio, and mobile cellular towers are sometimes used by fleets to communicate. Private
companies are responsible for their own communication redundancies, and some choose to pay a
retainer to third parties for access to equipment (e.g., mobile cellular towers) during hurricanes
or other emergency events.
Most of the emergency planning and coordination is handled at the county level, although some
cities have dedicated emergency coordinators. When overwhelmed, these local governments
request “missions” from the state, who can subsequently request a mission to the Federal
Emergency Management Agency (FEMA). When possible, FDEM sets up camps and mobile
fueling depots for first responders. These fueling depots typically provide diesel and unleaded
fuel but no alternative fuels.
EVSE Communications Systems
To assess the communications capabilities and needs of EV charging infrastructure, NREL
interviewed a variety of researchers and managers at ChargePoint. ChargePoint was chosen
because it is the largest charging network provider in Florida. All of ChargePoint’s public EVSE
are networked (i.e., connected to the internet), and therefore allow for communication between
the EV charging infrastructure and the ChargePoint mobile app. This allows drivers to see in real
time the available ChargePoint networked EV chargers in their area. In addition, the app shows
the availability of “roaming partners” outside the ChargePoint network that ChargePoint
members could use. If connectivity were to go down, ChargePoint members could still charge on
ChargePoint equipment, but nonmembers would no longer be able to.
Individual EVSE are built to withstand 18 inches of standing water (per the National Electrical
Code), but if this threshold is surpassed and the hardware is damaged, it cannot be brought back
online until it is physically inspected by a technician. ChargePoint also has mobile DC fast
chargers (DCFCs) on skids/trucks (with 4 feet of clearance) that can be brought to appropriate
locations and connected quickly to the grid, which could be critical to deploy along major
evacuation routes before a hurricane. It should be noted that there are skids with DCFCs and
propane-powered generators available on the market (Pioneer Power Solutions, Inc. 2022). Some
features of ChargePoint’s communication system that could help coordinate charging during an
emergency include reservations and waitlists, but they fear that using these features in an
emergency situation could lead to the chargers going unused for valuable minutes. Another
feature that could help encourage people not to idle at an EV charger is the capability for hosts to
raise their prices quickly in response to demand. However, the raises need to be limited so as to

15
This report is available at no cost from the National Renewable Energy Laboratory at www.nrel.gov/publications.
not be considered “price gouging,” which is illegal. The limitations to the network’s
communications systems and remote features are addressed in Solution 2.
Solution 1: New Website to Facilitate Planning
To facilitate the use of alternative fuels before and during a hurricane, NREL developed a
Florida Resilience Tool website to help facilitate planning and communications. Available at
https://widgets-stage.tada-stage.nrel.gov/tada/fl-resiliency/, this website uses state-of-the-art
technologies to provide useful maps, information, connections, and other resources. Here, users
are presented with state-level information, including links to Clean Cities coalitions and the
FDEM’s website, Facebook, and Twitter pages. It is intended for use by resilience planners, fleet
managers, individuals planning their evacuation, and alternative fuel station operators.
Dropdown menus provided at the top of the page allow users to adjust information displayed by
choosing from various map layers and counties. When changed, the website automatically
refreshes to present the information selected.
Figure 5. Florida Resilience Tool homepage
To obtain local information, users can select a county from a drop-down menu at the top right-
hand side of the page or click the appropriate county on the map.
16
This report is available at no cost from the National Renewable Energy Laboratory at www.nrel.gov/publications.
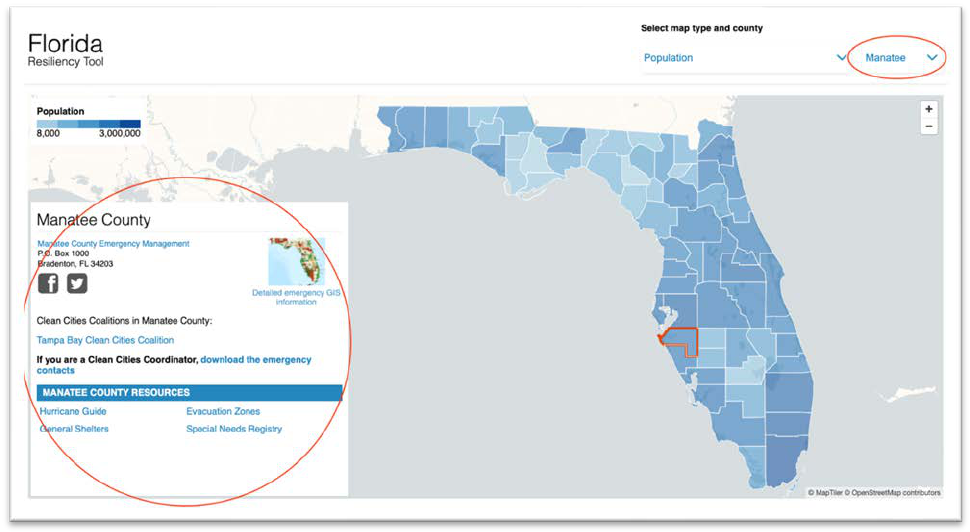
Figure 6. County-specific resources appear when a county is selected.
Where available, the following information is presented:
• Emergency management department
name.
• Link to emergency management
website.
• Link to emergency management
Twitter.
• Link to emergency management
Facebook.
• Emergency management department
address.
• Link to county hurricane guide.
• Link to county evacuation zone
information.
• Link to county evacuation route
information.
• Shelter location information.
• Special needs shelter location
information.
• County special needs registry.
• Link to county notification system.
• Link to county emergency
management app.
• Community Emergency Response
Team (CERT) information.
• Link to county YouTube station.
• County 311 app.
• Links to partner organizations.
• County population.
• Clean City coalition information.
A second drop-down menu allows users to select a map layer with the following options:
• Population (default).
• Percent of population with no
vehicles.
• Median income (to ensure equitable
preparation).
• Electric station locations.
• CNG station locations.
• Propane (liquefied petroleum gas
[LPG]) station locations.
• Biodiesel (B20 and above) station
locations.
• Ethanol (E85) station locations.
• LNG station locations.

17
This report is available at no cost from the National Renewable Energy Laboratory at www.nrel.gov/publications.
Figure 7. Florida Resilience Tool map layers
Users may select from one or both drop-down menus to view detailed information. Clicking on a
county on the map also selects that county and updates the information displayed.
Figure 8. Accessing fuel-specific station location by county
When both a fuel type and county are selected, users can see fuel station details in the info box
that help fleet managers determine if the station would be compatible with their vehicles and the
likelihood that the station could remain in operation during a power outage. Clicking “SEE
MORE” displays more detailed station location information such as fill type, fill pressure, fill
rate, vehicle accessibility, electric generator existence, and fuel, as well as change to station
capacity with a generator, if applicable.

18
This report is available at no cost from the National Renewable Energy Laboratory at www.nrel.gov/publications.
Figure 9. Station-specific information provides detail
A link to download emergency contact information for fueling stations is provided, but this
information is considered private and therefore only accessible by Clean Cities coordinators.
Please contact your local coordinator via the Clean Cities link in order for them to download this
information from the coordinator toolbox (via the state-level link showed in Figure 9).
From any view of the Florida Resilience Tool, users can click the small map image to see
detailed emergency GIS information. This information is elaborated in the GIS analysis in
Section 7.
Figure 10. Detailed emergency GIS information accessible from any view in the Florida Resilience
Tool
Solution 2: EVSE Communications Algorithms and Web Tool
In addition to the web-based Florida Resilience Tool, an electric vehicle evacuation planning
prototype web tool was also developed to better prepare the state for the use of electric vehicles
before and during an emergency event.

19
This report is available at no cost from the National Renewable Energy Laboratory at www.nrel.gov/publications.
A long-distance evacuation is expected when an emergency event affects a wide range of areas
(Adderly et al. 2018). In the United States, private vehicles are usually the first evacuation mode
choice, given high automobile ownership (Phiophuead and Kunsuwan 2019). During Hurricane
Irma in 2018, it was reported that about 90% of people evacuated with private vehicles (Wong,
Shaheen, and Walker 2018). As an alternative to internal combustion engine vehicles, the
popularity of EVs has rapidly developed in the past years because of lower maintenance costs,
lower operating costs, performance advantages, lower carbon footprints, and government support
(Bushnell, Muehlegger, and Rapson 2022).
It was predicted that the global EV market would grow from 4.1 million in EVs in 2021 to nearly
35 million EVs in 2030 (MarketsandMarkets 2021). Some households may only possess EVs and
need to use them for long-distance travel in the case of an emergency (Feng et al. 2020). Li et al.
(2022a) state that “Long-distance travel with EVs in regular circumstances is already challenging
because of limited charging facilities, long charging time, and short driving ranges (Rajaeifar et
al., 2022; Zhang et al., 2021), not to mention in the case of an emergency where the travel
demand (or charging demand) is significantly high. Without proper management, serious
congestion could happen at charging stations. This results in a long network clearance time, thus
putting human lives at risk”. Efficient mass evacuation planning for EVs is demanded.
Therefore, the electric vehicle evacuation planning web tool has been developed.
After registration with the tool, people evacuating in EVs can make charging reservations before
the predicted landfall of the hurricane. The web tool collects evacuation demand and ends the
reservation portal as needed (e.g., when a hurricane is close at hand). Then the back-end
algorithm will optimize the evacuation route for each user, considering the limited charging
facilities. Users can log back on the web tool and check the detailed evacuation route, including
when to start evacuating and where to charge. As a preliminary user guide, the detailed user
interface and back-end algorithm of this web tool are introduced in the following subsections.
EV Evacuation Tool Homepage
Before registration, users will see the homepage of the web tool, as shown in Figure 11. On the
homepage, publicly available EV charging stations are shown on the map of Florida. The data
source is the Alternative Fuels Data Center (https://afdc.energy.gov/).

20
This report is available at no cost from the National Renewable Energy Laboratory at www.nrel.gov/publications.
Figure 11. EV Evacuation Tool homepage
Signup and Login to the EV Evacuation Tool
To make an evacuation reservation, users must first register. As shown in Figure 12, a user
should create an account with their email and set a password. After signing up, the user will be
able to log in to the web tool.
Figure 12. Signup and login to the EV Evacuation Tool
Evacuation Reservation
After logging in, users can make evacuation reservations. It should be noted that one user can
only make one evacuation reservation considering the limited resources, especially in the case of
an emergency. As shown in Figure 13, users need to indicate the evacuation origin and
destination. Instead of typing the detailed address, they are asked to select from two drop-down
lists with cities and regions in Florida. Specifically, the origin and destination options include
Pensacola, Panama City, Youngstown, Port St. Joe, Tallahassee, Perry, Gainesville, Jacksonville,
Lake City, Daytona Beach, Ocala, Cedar Key, Wildwood, Titusville, Orlando, Vero Beach, Lake

21
This report is available at no cost from the National Renewable Energy Laboratory at www.nrel.gov/publications.
Placid, Cleveland, Sarasota, Tampa, South Bay, West Palm Beach, Dania Beach, Miami,
Islamorada, and Key West. These cities/regions are selected in a way such that more
origin/destination options are available at places with denser populations. At the same time, for
places with very light populations, necessary origin/destination options are also available such
that all users can use this web tool to plan their evacuation. Users will select the cities/regions
(provided in the list) in the vicinity of their actual origins and destinations when making
reservations. The limited number of origins/destinations significantly helps with the solution
efficiency of the back-end optimization algorithm. More city/region options can be incorporated
as long as the supporting computation resources can handle them.
Besides the origin and destination, users also need to input the departure time window (a range
for the preferred evacuation starting time) and the initial electricity level of their EVs in
percentage (a rough estimation is enough). Users will never be suggested to evacuate earlier than
their intended time window but may be delayed for system-level optimality. After all the
information is filled out, users should hit reserve, and their reservation will immediately enter the
database, where all evacuation demand is saved.
Figure 13. Evacuation reservation in the EV Evacuation Tool
Back-End Planning Algorithm
After receiving all the evacuation reservations, the back-end planning algorithm designs the
optimal evacuation plan for EVs considering limited charging facilities. This problem is
complex, involving EV charging, routing, and scheduling. An intuitive approach is to construct a
time-space-energy extended network to solve it. However, such a network for a practical
application instance is likely too huge to solve. To circumvent this computational challenge, a
three-stage method (Figure 14) is proposed to efficiently solve this problem based on the
following premises. First, vehicles tend to charge in the vicinity of the evacuation path. Charging
stations far away from the evacuation path will not be visited because of the considerable energy
and time costs. Second, only a few candidate paths are selected by each origin-destination EV
flow (OD flow) during the evacuation. Paths that are too long can be trimmed from
consideration. The inputs to the proposed method are a set of evacuation demands (specifying
the origin, destination, initial EV energy level, and intended departure time window) submitted

22
This report is available at no cost from the National Renewable Energy Laboratory at www.nrel.gov/publications.
by web tool users and a network (consisting of a set of critical locations without charging
facilities, a link matrix between locations, a distance matrix between locations, and a set of
charging stations). The output is the evacuation plan, including the evacuation routes considering
charging and the departure schedule for each OD flow.
Figure 14. Back-end evacuation planning algorithm structure
Stage 1 is conducted to reduce the network size and mimic realistic evacuation behavior that
vehicles usually charge in the vicinity of the evacuation path, and only a small number of short
paths are selected by each OD flow during the evacuation. Stage 1 first consolidates the network
by pre-assigning charging stations to the closest critical locations and then aggregating a group
of charging stations in the same vicinity into a mega charging facility. Next, a customized
shortest path algorithm is proposed to trim excessively long evacuation paths and only consider a
small set of short paths between each OD pair. Given this, sparsely distributed charging stations
in the network should be allocated wisely to path locations to balance the EV charging demand
and supply. To do this, Stage 2 computes the location significance based on the path set solved in
Stage 1 and the evacuation demand. With the location significance, charging stations are
reassigned and reaggregated such that locations visited by more EVs are assigned with more
charging facilities. Finally, in Stage 3, a set of candidate evacuation paths is solved based on the
evacuation demand and the network after balancing the charging demand and supply using the
same algorithm as in Stage 1. An evacuation planning model is then formulated to devise the
optimal mass evacuation plan for EVs. This model optimally selects evacuation paths and
schedules departure for EVs of each OD pair. Charging facility capacity is considered to avoid
congestion at charging stations. This model is macroscopic because aggregated EV flows are
considered to handle the mass evacuation demand efficiently rather than tracking each EV
movement. An optimization objective of minimizing the network clearance time and the delayed
departure time is used to evacuate as soon as possible.
Evacuation Route
After the back-end algorithm optimizes the evacuation routes, users can check the results by
logging in to the web tool. An evacuation route for a user is provided in Figure 15. This user is
suggested to start evacuation at 2:20 a.m. from Miami. The initial electricity level is 84%. By
4:20 a.m., this user will leave a charging station with a full battery. This user will continue the
evacuation and leave another charging station with a full battery at 12:00 p.m. Finally, by 3:20
p.m., this user arrives at the destination (i.e., Lake City) with an electricity level of 20%. The
evacuation ends.

23
This report is available at no cost from the National Renewable Energy Laboratory at www.nrel.gov/publications.
Figure 15. Evacuation route
It should be noted that the electric vehicle evacuation planning web tool described here is a
prototype to demonstrate the feasibility of optimally scheduling long-distance EV evacuations in
the case of an emergency. The web tool operating stakeholders are suggested to conduct the
following additional efforts before the actual deployment of the web tool:
• Connect this prototype with the Alternative Fuels Data Center
(https://afdc.energy.gov/fuels/electricity_locations.html#/find/nearest?fuel=ELEC) to
incorporate the changes in charging stations (e.g., newly added stations and the number
of charging ports at each station).
• Connect this prototype with the National Highway System maps
(https://www.fdot.gov/statistics/hwydata/nhsmaps.shtm) to incorporate the changes in the
physical roadway network (e.g., new link).
• Switch to a commercial map application programming interface (e.g., Google Maps) to
guarantee a robust and efficient illustration of the evacuation route.
24
This report is available at no cost from the National Renewable Energy Laboratory at www.nrel.gov/publications.
6 Long-Term Planning for Electric Vehicle
Infrastructure Expansion
Electric vehicles are projected to increase their market share more than any other alternative fuel
in the history of automobiles. Therefore, Florida needs to forecast their infrastructure needs well
into the future and consider the resilience implications. NREL did this with their Electric Vehicle
Infrastructure – Projection (EVI-Pro) tool. This section analyzes the EV charging infrastructure
needs in Florida from 2030 to 2050 to meet the charging demand of EVs—primarily light-duty
vehicles. The statewide charging infrastructure need is quantified using the EVI-Pro tool,
incorporating the spatial travel patterns, vehicles, and charger attributes in a bottom-up
simulation framework. The analysis is performed at the county level for 2030 and 2050,
considering the EV adoption rate increase in Florida. The results indicate that in public and
workplace charging, the needs for chargers are 46,487 and 170,471 in 2030 and 2050,
respectively, including 5,561 and 26,901 DCFCs. Conversely, the home charging infrastructure
needs are 159,103 and 464,709 in 2030 and 2050, respectively.
Electric Vehicle Infrastructure Projections Method Overview
EVI-Pro is a simulation tool that identifies the electric vehicle charging infrastructure and
predicts the power demand for the EVSE based on the anticipated electric vehicle fleet
composition and their corresponding driving behaviors (Wood, Raghavan, et al. 2017). EVI-Pro
employs the real-world travel data and the EV projections to estimate the charging requirements
in work, home, and public places. The model’s anticipated output is the spatial/temporal
consumer power demand for charging and the corresponding charging infrastructure projection
at the targeted area. The general EVI-Pro model structure and input/output data flows are
presented in Figure 16.

25
This report is available at no cost from the National Renewable Energy Laboratory at www.nrel.gov/publications.
Figure 16. EVI-Pro model structure and data flow
The two fundamental assumptions in EVI-Pro are the vehicle and EV charging infrastructure
attributes that enable the model to identify the energy consumption and power supply for the EV
travel demand. To simulate mainstream drivers’ travel behavior, National Household Travel
Survey (NHTS) travel data are analyzed and categorized based on population density to
represent the travel behavior at the county level in Florida (FHWA 2017). The projected EV fleet
size in 2030 and 2050 are derived from the Annual Energy Outlook to reflect the increased
adoption rate of EVs (EIA 2020).
Vehicle and Infrastructure Attribute Assumptions
The vehicle and charging infrastructure attributes are the two major assumptions in EVI-Pro to
complete the charging simulations. An EV’s attributes are highly related to its electric range.
Thus, the vehicle attributes required in the EVI-Pro simulation are electric range, vehicle drive
efficiency, minimum range tolerance, onboard charger efficiency, and maximum AC charging
power (Wood, Raghavan, et al. 2017). The EV attribute assumptions are derived from the
California Energy Commission report based on the vehicle powertrain type and electric ranges
(Crisostomo
et al. 2021). On the other hand, the EV charging infrastructure attribute

26
This report is available at no cost from the National Renewable Energy Laboratory at www.nrel.gov/publications.
assumptions are made based on the three major categories defined by the Alternative Fuels Data
Center of charging power levels: Level 1 (L1), Level 2 (L2), and DCFC.
11
The selection of
charging options within EVI-Pro needs to consider the dwell time available for the vehicle to be
charged. Longer dwell times lead to lower-power charging, whereas short dwell times usually
lead to higher-power charging options, such as DCFC (Wood, Rames, et al. 2017). Thus, the
suitable charging infrastructure type (location and power level) could be simulated by EVI-
Pro considering the dwell time and consequent travel need. Different charging infrastructure
options available to consumers in EVI-Pro are listed in Table 2.
Table 2. EV Charging Infrastructure Technology Specifications
Location
Level
Power
Comment
Home
L1
1.4 kW
L2
3.6 kW
Battery
-electric vehicles
simulated with higher L2 power to enable full overnight
charge
Work
L1
1.4 kW
L2
6.2 kW
P
lug-in hybrid EV onboard charger limits maximum power to 3.6 kW in model
Public
L1
1.4 kW
L2
6.2 kW
P
lug-in hybrid EV onboard charger limits maximum power to 3.6 kW in model
L3
50 kW
B
attery-electric vehicles only
Source: Wood, Rames, et al. 2017
Florida County-Level Travel Demand Assumptions
To identify EV charging infrastructure needs in Florida, the corresponding spatial travel data
representing the travel behavior and EV fleet information are necessary to complete the driving
and charging demand simulations. The Florida county-level travel patterns are simulated using
the travel information record from the 2017 NHTS, which is the most recent survey collected by
the Federal Highway Administration (FHWA) focusing on travel behavior data in the United
States (FHWA 2017). This survey provides travel details for the demographic travel behaviors of
around 130,000 households, including work and school community, shopping trips, recreational
activities, health care visits, and so on. For each trip record, the detailed trip information includes
the departure and arrival times, destination type, trip distance, dwell time, and the specific day of
travel during the week. The travel data are incorporated into EVI-Pro daily to consider the
weekday/weekend travel behavior variation as well. NHTS cannot offer enough travel data
sample at the Florida county level. Thus, the travel data from NHTS are categorized by
population density derived from the 2018 American Community Survey (U.S. Census Bureau
2020), as illustrated in Figure 17. The subset travel data with the same population density in the
specific county are employed to simulate the travel pattern of this county.
11
https://afdc.energy.gov/fuels/electricity_infrastructure.html

27
This report is available at no cost from the National Renewable Energy Laboratory at www.nrel.gov/publications.
Figure 17. Florida county-level population density and EV fleets
The Florida county-level EV fleet projections in 2030 and 2050 are derived from the 2020
Annual Energy Outlook published by the U.S. Energy Information Administration, which
forecasts the annual light-duty vehicle fleet size by technology type (EIA 2020). The EV fleet
size is distributed throughout the state at the county level based on existing hybrid electric
vehicle registration data from R. L. Polk & Co., and their share is compared to the total vehicles
(Moniot, Rames, and Wood 2019). One of the important assumptions in charging infrastructure
estimation is the residential charger access ratio. Currently, most of the EV charging occurs at
residential locations; with the increase of the EV penetration rate, the residential charging ratio
decreases due to a higher total charging infrastructure number and density. Thus, considering the
different EV penetration rates, the residential charging access ratios are 90% and 80% in 2030
and 2050, respectively (Ge et al. 2021).
EVI-Pro Simulation Analysis and Results
The EV charger need at the Florida county level is simulated based on the location and time
when a charger is necessary to satisfy a driver’s travel demand. Home, public, and workplace are
the three options for charging locations. Furthermore, to consider the difference in travel
behaviors during weekdays and weekends, the corresponding charging events and power demand
are simulated and presented in Figure 18. As seen in the figure, residential charging load
demands take the largest share—about 70%. The two peaks for daily charging load profiles
coincide with the residential charging load and the time range when vehicles arrive at homes.
Furthermore, comparing the charging load profiles between weekdays and weekends, the
workplace charging load decreases and the public places charging load increases on weekend
days. Also, the charging load for DCFCs is more volatile than other charger types due to the high
power demand.

28
This report is available at no cost from the National Renewable Energy Laboratory at www.nrel.gov/publications.
Figure 18. EV charging load profiles in 2030, n = 80,000
EVI-Pro quantifies the EV charger need by calculating the charging power required by charger
type and the corresponding charging power level based on the corresponding charger attributes.
Tables 3 and 4 present the nonresidential EV charger needs at the county level in Florida in 2030
and 2050, respectively.
Table 3. 2030 EV Nonresidential Charging Infrastructure Projection
County
DCFC
P
ublic L2
W
ork L2
BROWARD
484
1,454
2,330
PALM BEACH
465
1,359
2,177
MIAMI
-DADE
427
1,361
2,170
ORANGE
443
1,244
2,003
HILLSBOROUGH
346
1,010
1,622
PINELLAS
280
838
1,346
DUVAL
207
589
942
LEE
207
575
917
BREVARD
195
542
867
SARASOTA
177
498
792
SEMINOLE
148
421
672
POLK
147
391
625
VOLUSIA
142
389
622
PASCO
133
364
581
MANATEE
123
348
554
COLLIER
123
342
547
LAKE
115
301
481
SAINT JOHNS
108
285
454

29
This report is available at no cost from the National Renewable Energy Laboratory at www.nrel.gov/publications.
County
DCFC
P
ublic L2
W
ork L2
ALACHUA
102
277
440
MARION
96
245
391
LEON
90
248
398
OSCEOLA
84
226
360
SAINT LUCIE
76
209
334
ESCAMBIA
70
190
303
SUMTER
64
161
256
CHARLOTTE
58
157
252
OKALOOSA
56
156
247
MARTIN
56
153
242
CLAY
51
134
214
INDIAN RIVER
49
133
213
HERNANDO
49
130
207
CITRUS
50
127
203
SANTA ROSA
45
119
191
BAY
42
113
179
FLAGLER
39
103
165
MONROE
31
86
138
NASSAU
26
67
107
WALTON
26
65
103
HIGHLANDS
25
65
103
PUTNAM
12
29
46
COLUMBIA
11
29
45
LEVY
8
19
30
SUWANNEE
7
17
27
JACKSON
7
17
27
WAKULLA
7
16
25
GADSDEN
7
16
25
OKEECHOBEE
5
12
19
HENDRY
4
11
18
DE SOTO
4
10
16
BRADFORD
4
10
15
WASHINGTON
4
9
13
GILCHRIST
3
8
13
JEFFERSON
3
8
13
GULF
3
7
12

30
This report is available at no cost from the National Renewable Energy Laboratory at www.nrel.gov/publications.
County
DCFC
P
ublic L2
W
ork L2
FRANKLIN
3
7
11
BAKER
3
7
10
HOLMES
2
6
9
HARDEE
2
5
8
TAYLOR
2
5
8
CALHOUN
2
5
7
DIXIE
2
4
6
GLADES
2
4
6
MADISON
2
4
6
UNION
1
3
5
HAMILTON
1
3
5
LIBERTY
1
2
4
LAFAYETTE
1
1
2
Table 3 presents the nonresidential EV charging infrastructure need in 2030. The total Florida
state public EVSE need is 45,485. To be specific, 54% are work L2 chargers, 34% are public
L2 chargers, and 12% are DCFCs. At the county level, Broward is the county with the largest EV
charger need, whereas Lafayette is the county that will need the fewest EVSE.
Table 4. 2050 EV Nonresidential Charging Infrastructure Projection
County
DCFC
P
ublic L2
W
ork L2
BROWARD
2,355
4,837
8,547
PALM BEACH
2,262
4,479
7,980
MIAMI
-DADE
2,060
4,578
7,951
ORANGE
2,156
4,053
7,356
HILLSBOROUGH
1,680
3,332
5,952
PINELLAS
1,367
2,798
4,941
DUVAL
1,003
1,921
3,451
LEE
998
1,855
3,357
BREVARD
946
1,751
3,181
SARASOTA
854
1,612
2,896
SEMINOLE
716
1,370
2,461
POLK
706
1,248
2,287
VOLUSIA
683
1,255
2,276
PASCO
641
1,169
2,130
MANATEE
596
1,133
2,028
COLLIER
595
1,107
2,002

31
This report is available at no cost from the National Renewable Energy Laboratory at www.nrel.gov/publications.
County
DCFC
P
ublic L2
W
ork L2
LAKE
551
959
1,760
SAINT JOHNS
519
905
1,658
ALACHUA
487
888
1,607
MARION
458
775
1,431
LEON
434
804
1,457
OSCEOLA
405
726
1,317
SAINT LUCIE
366
674
1,225
ESCAMBIA
337
609
1,110
SUMTER
304
505
933
CHARLOTTE
282
502
925
OKALOOSA
271
502
904
MARTIN
270
488
886
CLAY
244
426
781
INDIAN RIVER
237
425
782
HERNANDO
236
412
759
CITRUS
239
401
740
SANTA ROSA
218
378
698
BAY
200
359
656
FLAGLER
187
327
607
MONROE
151
278
507
NASSAU
126
213
392
WALTON
123
205
375
HIGHLANDS
119
206
378
PUTNAM
55
91
167
COLUMBIA
53
90
163
LEVY
37
59
109
SUWANNEE
33
54
99
JACKSON
32
53
97
WAKULLA
31
50
92
GADSDEN
31
50
91
OKEECHOBEE
22
37
68
HENDRY
21
35
65
DE SOTO
18
32
57
BRADFORD
18
30
55
WASHINGTON
16
27
49
GILCHRIST
16
25
46

32
This report is available at no cost from the National Renewable Energy Laboratory at www.nrel.gov/publications.
County
DCFC
P
ublic L2
W
ork L2
JEFFERSON
16
25
46
GULF
14
23
42
FRANKLIN
14
22
41
BAKER
13
21
38
HOLMES
11
18
34
HARDEE
10
17
30
TAYLOR
9
15
27
CALHOUN
9
15
27
DIXIE
8
13
23
GLADES
8
13
23
MADISON
7
12
22
UNION
6
10
19
HAMILTON
6
10
19
LIBERTY
4
7
13
LAFAYETTE
2
4
7
Table 4 shows the EV public charging infrastructure prediction for 2050. The total Florida
charging infrastructure need is 170,471 in 2050: 54% are work L2 chargers, 30% are public L2
chargers, 16% are DCFCs, and the remainder are home chargers. At the county level, similar
to 2030, Broward is the county with the largest EV charger need of 15,739, whereas Lafayette is
the county with the least EV charger need of 13.
Figure 19. Comparison of 2030 and 2050 EV charging infrastructure
Figure 19 compares the EV charging infrastructure number in 2030 and 2050. With the increase
in EV numbers, the charging infrastructure need raises correspondingly. To be specific, public
33
This report is available at no cost from the National Renewable Energy Laboratory at www.nrel.gov/publications.
L2 charger numbers increase about 3 times in 2050 compared to 2030. In contrast, the work
L2 charger number increases 3.7 times, and the DCFC number increases around 5 times. The
phenomenon could be explained by the increase in vehicle numbers and the decreased residential
charging access ratio. Furthermore, DCFCs could offer higher power and shorter charging times.
Thus, the rise in DCFC numbers could reduce the burden of other public chargers. Therefore, the
increase in public L2 and work L2 chargers is not as large as DCFCs.
The number of EVs in Florida is projected to be 74,154 in 2030, with 17% of them being plug-in
hybrid EVs and 83% of them being battery-electric vehicles. In 2050, the total number of EVs is
expected to grow to 163,084, with 11% EVs and 89% battery-electric vehicles. The real-world
household travel data were analyzed and adopted in EVI-Pro to understand and simulate the
travel behavior of these EVs in Florida. 2017 NHTS travel data covering 129,112 households
with more than 606,600 trip records have been analyzed and categorized to represent the travel
behavior at different Florida counties based on the population density. EVI-Pro simulations
estimate that 5,561 DCFCs, 15,749 public L1 chargers, and 25,177 workplace L2 chargers are
required to support the EVs in Florida in 2030. The charging infrastructure demand increases to
26,901 DCFCs, 51,321 public L2 chargers, and 92,249 workplace L2 chargers in 2050.

34
This report is available at no cost from the National Renewable Energy Laboratory at www.nrel.gov/publications.
7 GIS-Based Preparation for Hurricanes
This section addresses the challenges the state of Florida has for AFV refueling station
implementation in the context of flooding resulting from hurricanes, tides, or sea level rise.
While alternative fuels can alleviate broad petroleum outages, they currently have fewer
refueling/recharging stations in Florida. This, combined with the flooding that accompanies
hurricanes, requires logistical preparation before a disaster strikes. The analysis in this section
addresses two distinct aspects of AFV infrastructure as it relates to floods in Florida. First, it
demonstrates a spatial analysis approach to identify potential locations for new AFV stations to
increase the connectivity of the emergency evacuation road network for AFVs, whether for
purposes of evacuation or emergency response operations. This would bolster the ability of
residents and disaster responders using AFVs to reliably refuel during a flood event. Second, this
analysis addresses future needs for EVSE by comparing counts of current EVSE ports against the
future EVSE needs forecast in Section 6. Figure 20 outlines the two objectives of this analysis.
Figure 20. Summary of the two geospatial Florida AFV flood resilience analyses
The primary outcome of this analysis is a web mapping tool that Florida’s emergency
management practitioners can use to incorporate alternative fuels and vehicles into their
resilience plans. The tool is not intended to compete with any live web dashboards that provide
real-time emergency information, such as GATOR (FDEM 2021). As such, it is not intended for
emergency use during any flooding event. The web map does not provide any live data feeds but
can be updated annually or quarterly to ensure plans are up to date with the latest state of the
alternative fueling infrastructure in Florida. The AFVs of interest in this analysis are propane,
CNG, and electric vehicles (charged through both Level 2 EVSE and DCFCs).

35
This report is available at no cost from the National Renewable Energy Laboratory at www.nrel.gov/publications.
This section is further divided in subsections that address the data used for the analysis,
methodology, results, an example case study, and next steps.
Utilizing Current Infrastructure Data
Florida has AFVs and alternative refueling stations right now that can be utilized during
evacuation and recovery operations. This section of the GIS analysis highlights how they might
be best used. The descriptions and sources of the data used for this analysis are detailed in the
following subsections.
Current AFV Stations
The core data set for this work is current AFV stations, as downloaded from the Alternative
Fuels Data Center Alternative Fuel Station Locator.
12
The Alternative Fuels Data Center
provides extensive data for the location and descriptions for both public and private alternative
fueling stations. The station data are publicly available and updated daily. The stations used in
this analysis are all public stations that meet the criteria for Alternative Fuel Corridors, as well as
private propane, CNG, and LNG stations that otherwise meet the Alternative Fuel Corridors
criteria. These criteria are used by FHWA’s Alternative Fuel Corridors program to designate
sections of highway that AFVs can reliably traverse while having adequate ability to fuel based
on baseline range assumptions (FHWA 2021). Figure 21 shows the criteria for each alternative
fuel type.
Figure 21. FHWA alternative fuel corridor requirements.
Note: The current analysis does not include hydrogen due to lack of vehicles and infrastructure in Florida.
Data Source: FHWA 2021
12
https://afdc.energy.gov/stations/

36
This report is available at no cost from the National Renewable Energy Laboratory at www.nrel.gov/publications.
Fleet Locations
In addition to fueling stations, various private fleet managers provided data for their fleet
locations through their local Clean Cities coalition. These data came from numerous fleets in
Florida, through all four of the Florida Clean Cities coalitions and other National Clean Fleet
Partners (EERE 2014). Data included vehicle type, fuel type, number of vehicles, and location.
Fleet names were omitted for privacy reasons.
Flood Zones, Storm Surge Zones, Shelters, and Evacuation Routes
This analysis uses several data sets that pertain to floods. These data sets were provided by
FDEM and University of Florida’s GeoPlan Center. The first dataset for this layer is the flood
zone data. Flood zones were trimmed to only include 100-year zones because the 500-year zones
cover nearly the entire state and were therefore not useful for the scenarios envisioned in this
analysis. The second data set was storm surge data, which include zones of storm surge
inundation for Category 1–5 hurricanes, as well as storm tides (T). Finally, the flood shelters and
evacuation routes data sets were used as the core transportation network for the station
connectivity analysis. Figure 22 shows a snapshot of these data sets in Florida.
Figure 22. Florida flood risk, emergency shelters, and evacuation routes.
Emergency shelter and evacuation routes obtained from Florida’s Division of Emergency Management
(https://geodata.myflorida.com/datasets/7fc21b70ee4942a898ea6dfe5700fcd6_0/about). Storm surge and flood data
obtained from the University of Florida’s GeoPlan Center (https://sls.geoplan.ufl.edu/viewer/).
37
This report is available at no cost from the National Renewable Energy Laboratory at www.nrel.gov/publications.
County-Level EVSE Projections
This portion of the analysis is specific to EVs. NREL’s EVI-Pro tool provides projections of the
number of EVSE ports needed at the county level for 2030, 2040, and 2050 (per Section 6).
These projections are further broken down into public and private needs, as well as by EV
charger type/level. This analysis uses the 2030 EVSE projections for public DCFCs. The details
for how these projections are calculated are addressed in the EVI-Pro section (Section 6).
Other Data Sets Considered
In addition to the data sets previously described, other data sets were considered for the analysis
but ultimately not included as part of the methodology. We describe them for the benefit of
future analyses. The first is grid reliability data from various Florida utility companies. These
data are provided in the form of System Average Interruption Duration Index (SAIDI) values
from the five publicly owned utility companies in Florida: Duke Energy, Florida Power and
Light, Florida Public Utility Company, Gulf Power Company, and Tampa Electric Company.
However, the data from the companies varied dramatically in quality, resolution, and coverage.
Not all locations in Florida were covered by these zones, and there is overlap between some
zones. Additionally, the siting of new station locations assumed availability of temporary
electricity at designated shelters via generator or solar, so the SAIDI value for a shelter’s location
was deemed uncritical. For these reasons, these data were not considered consistent enough to
factor as part of the EV analysis. Appendix A displays these SAIDI data for reference.
The second data set—the output results from the Florida Electric Vehicle Roadmap report (Burk
et al. 2020)—were reviewed and considered for this analysis. However, that work was focused
predominantly on broader EVSE implementation, without direct focus on such implementation
with flood events in mind. As such, the methods from that report were used to inform the
analysis, but the data were not a direct input for this work’s methodology.
Future Infrastructure Identification Methods
This analysis has two primary objectives with two corresponding methodologies. The first
objective is to identify possible locations for new fueling stations to better build Florida’s AFV
fueling network along evacuation routes. The second objective, specific to EVs, is to address
how the current EVSE infrastructure compares to the needs shown in EVI-Pro’s model for 2030.
A multi-criteria decision analysis (MCDA) pipeline is used to narrow down the input data sets to
more discrete spatial locations of possible stations, as well as to limit the current EVSE based on
whether a station is within a flood zone, for comparison with 2030 EVSE projection needs from
EVI-Pro. The flowchart in Appendix B shows the generalized MCDA algorithm, and the
subsequent chart in Appendix C shows the process for EVs with the added steps for calculating
the EVSE needs based on the EVI-Pro output. The steps of the MCDA workflow are expanded
upon in the following subsections in terms of the data flow of the core inputs.
Stations and Fleets
Subsets of the station and fleet layers were created for each AFV type. To identify stations that
are at risk during a flooding event, these layers were intersected with the flood zone and storm
surge zone layers. This resulted in flood-safe and flood-risk station layers that were used in
different phases of the model.

38
This report is available at no cost from the National Renewable Energy Laboratory at www.nrel.gov/publications.
Next, driving distance service areas were generated for each fuel type. This was done by using
the flood-safe stations and fleets as facilities in a network analysis algorithm to generate service
areas for the stations based on driving distance. The service areas for each AFV type were
generated using distance thresholds rather than travel time because the model is focused on AFV
infrastructure connectivity and is not concerned with traffic volume. The distance thresholds are
150 miles between propane and CNG stations and 50 miles between DCFC and Level 2 EV
stations, derived from those used by the FHWA’s Alternative Fuel Corridors program. The
ranges of modern CNG, propane, and electric vehicles may be considerably longer than these
thresholds, but the conservative approach to utilize the distance thresholds established by FHWA
was used for this analysis in order to account for the potential for older, lower-range models to
operate with auxiliary loads in a variety of temperatures and road grades. The resulting service
areas (also called isochrones) from the algorithm represent the places AFV drivers can reliably
navigate to flood-safe fueling stations. Figure 23 shows the resulting Level 2 EVSE potential
areas as an example.
Figure 23. Level 2 EVSE and related 50-mile radius EV service map
Evacuation Routes
The designated evacuation routes in Florida were used as the core network for escaping a
hurricane or flood in Florida. They are assumed to be structurally secure for utilization during a

39
This report is available at no cost from the National Renewable Energy Laboratory at www.nrel.gov/publications.
flooding event by virtue of their designation as emergency evacuation routes. They also provide
adequate coverage in each county. A 1-mile buffer was created around the evacuation routes.
This buffer area is assumed to be close enough to the route to be able to fuel a vehicle quickly
without going too far from the main road, potentially driving back into inundated areas. Flood-
safe AFV stations within these buffers were extracted and used as the stations for the
aforementioned service area isochrone generation.
Next, the evacuation route buffers were clipped by the flood-safe service areas for each AFV
type based on AFV range. These resulting areas are deemed the potential areas of new AFV
station installation due to their proximity to the evacuation routes but exclusion from the service
area of current AFV stations. Figure 24 shows an example of this result for propane vehicles.
Figure 24. Propane vehicle vulnerability map
Evacuation Shelters
Evacuation shelter locations were used in this analysis as potential locations for new AFV
infrastructure installation. This is due to their presumed security from flooding, transportation
needs, and grid connectivity or emergency electrical capability. They are also already ingrained
in the Florida emergency management system and would therefore likely be easy to track and

40
This report is available at no cost from the National Renewable Energy Laboratory at www.nrel.gov/publications.
monitor by emergency managers. The emergency shelter locations that intersect with the
modeled AFV infrastructure potential areas near evacuation routes were extracted and used as
the final output map layer for new possible flood-secure AFV station locations.
To determine how the potential locations would strengthen the evacuation route network for
AFV travel, the modeled stations were added as new facilities in the original service area
process, and then a new service area was generated with the merged stations. This service area
and the original service area layer were each used to clip the evacuation routes layer. These two
resulting service areas were used to determine the percentage of the evacuation route gaps that
can potentially be filled with new stations, as indicated by the cross-hatched areas in Figure 25.
Key Findings of GIS Analysis
The results from this analysis highlight the state of Florida’s strong potential to build out the
AFV refueling networks along evacuation routes. After removing stations that are at risk of
flooding, the percentage of the evacuation routes that are covered by each of the AFV service
areas averaged to 87.6%. However, after integrating the new station location possibilities, the
coverage increased to an average of 99.0%. Table 5 shows the coverage broken down by each
alternative fuel type. Figure 25 shows the results of the model for CNG stations.
Table 5. AFV Corridor Coverage Change with Proposed New Stations
Fuel Type Current Evacuation Route Coverage
Without Flood-Prone Stations
Evacuation Route Coverage
With Proposed New Stations
DC Fast (EV) 85.9% 98.2%
Level 2 (EV) 85.3% 98.7%
Propane 84.2% 99.5%
CNG 95.1% 99.
6%
Note: For new station locations, visit the web tool listed at the end of this section.
The EVI-Pro projections for needed EVSE were generated and mapped at the county level. From
there, the current DCFC stations were spatially joined to the county layer. This spatial join adds a
count of stations and a sum of their ports to each county. Calculations were done to determine
each county’s progress toward EVI-Pro’s 2030 predictions.

41
This report is available at no cost from the National Renewable Energy Laboratory at www.nrel.gov/publications.
Figure 25. Best new CNG station locations identified by the analysis
The other key result from this work is each Florida county’s progress toward the 2030 DCFC
plug count needs based on the EVI-Pro results. These values are displayed as their total port
count toward meeting those goals in Figure 26.

42
This report is available at no cost from the National Renewable Energy Laboratory at www.nrel.gov/publications.
Figure 26. Number of DCFC Ports Required to Meet 2030 Goals
The map in Figure 26 highlights varying progress toward meeting the 2030 goals for DCFC
ports. Several of the more populated counties needed over 200 stations to meet their goals, and
other counties were at or near their 2030 targets. Table 6 provides the values of current and
future DCFC plug counts for each county.
Table 6. Current and Modeled DCFC Port Counts by Florida County
County Current DCFC Port Count 2030 Port Count Target
Brevard 7 195
Columbia 2 11
Gadsden 0 7
Jefferson 0 3
Leon 5 90
Orange 16 443
Putnam 1 12
Seminole 5 148

43
This report is available at no cost from the National Renewable Energy Laboratory at www.nrel.gov/publications.
County Current DCFC Port Count 2030 Port Count Target
Taylor 2 2
Washington 1 3.
Citrus 2 50
Escambia 2 70
Gilchrist 0 3
Hamilton 0 1
Lee 4 207
Liberty 0 1
Miami-Dade 28 427
Okeechobee 11 5
Osceola 9 84
Madison 0 2
Santa Rosa 0 45
Marion 2 96
Gulf 0 3
Suwannee 1 7
Lake 7 115
Pinellas 14 280
Dixie 0 2
Nassau 0 26
Bradford 0 4
Flagler 1 39
Holmes 0 2
Monroe 4 31
St. Johns 5 108
St. Lucie 4 75
Sarasota 3 177
Alachua 2 102
Broward 17 484
Charlotte 4 58
Collier 4 123
Hendry 4 4
Indian River 2 49
Jackson 1 7
Lafayette 0 0
Manatee 1 123

44
This report is available at no cost from the National Renewable Energy Laboratory at www.nrel.gov/publications.
County Current DCFC Port Count 2030 Port Count Target
Palm Beach 13 465
Clay 0 51
Hardee 0 2
Levy 0 8
Bay 2 42
Okaloosa 1 56
Baker 0 3
Pasco 6 132
Glades 0 2
Martin 1 56
Highlands 5 25
Volusia 11 141
Duval 15 207
Walton 1 26
Hernando 0 49
Sumter 3 64
Union 0 1
Calhoun 0 2
Hillsborough 11 346
Franklin 1 3
Wakulla 0 7
Polk 9 147
DeSoto 0 0
The resulting spatial layers from this analysis were compiled and shared as a web map tool,
which was made available for the local emergency managers in Florida to use in their alternative
fuel resilience plans.
13
More supplementary information for the web map is available on the
homepage.
14
The following section provides an example of how one might use this tool to
identify possible locations for a new AFV station.
Florida Alternative Fuel Resilience Web Map Local Usage Example
The result of this analysis is the Florida Alternative Fuel Resilience web map on ArcGIS Online:
an interactive web map that emergency management practitioners can utilize for making
alternative fuel resilience plans in their counties. The results shown in the previous section
indicate some counties may be further along in the infrastructure rollout than others. This section
13
https://nrel.maps.arcgis.com/apps/mapviewer/index.html?webmap=70d980d59f39453387d8286fcb505ae1
14
https://nrel.maps.arcgis.com/home/item.html?id=70d980d59f39453387d8286fcb505ae1

45
This report is available at no cost from the National Renewable Energy Laboratory at www.nrel.gov/publications.
provides an example of how one could utilize the web map tool for DCFC implementation in
Dixie County.
When navigating the app, users can interact with the map and sidebar items—as is typical with
interactive web maps. Users can click on stations or shelters to gather more information about
the location. This can be used to get contact information for a current station or location
information about a shelter as a potential installation location, as shown in Figure 27.
Figure 27. Resilience web map features while planning EV resilience in Dixie County
Additionally, the areas of potential EVSE siting based on proximity to the emergency road
network were included in the application. In addition to all the data layers outlined above, users
have the ability to upload data for other facilities that they are considering for station siting, or if
they know the areas for temporary charger placement for further on-site research as part of their
plan. By clicking the “Add” button, users can add their own location data from several format
options, as shown in Figure 28.

46
This report is available at no cost from the National Renewable Energy Laboratory at www.nrel.gov/publications.
Figure 28. Example of the ability to add new data to the resilience web map
The example in Figure 29 shows the addition of a Florida natural gas station data set from
ArcGIS Online. The new stations on the map can then be further selected to see the station
attributes so that the user may discern further potential in these added stations.

47
This report is available at no cost from the National Renewable Energy Laboratory at www.nrel.gov/publications.
Figure 29. Example use case after adding gasoline station data to the resilience web map
The example in this section shows a brief typical usage of the Florida Alternative Fuel Resilience
web map. From here, the user can proceed with whatever necessary steps are next (e.g., site
evaluation) to determine which of the locations identified in this map can be used for a new
alternative fuel station. Additionally, ArcGIS Online has the capability to interface with other
web map layers or web tools that the local GIS practitioners in Florida can also utilize as they see
fit.
Comparison to Florida’s EV Roadmap and EV Master Plan
Two other Florida-based alternative fuel plans were in development in tandem with NREL’s
Florida Alternative Transportation Fuel Resilience Plan: the Florida Electric Vehicle Roadmap
from the Florida Department of Agriculture & Consumer Services (Burk et al. 2020) and the EV
Infrastructure Master Plan from FDOT (FDOT 2021). Each of these three plans addresses fuel
resilience to some degree, so it is important to identify the distinguishing factors between them.
First, both of the other projects focus exclusively on electric vehicles, whereas this project
addresses CNG and propane vehicles in addition to EVs. Secondly, the other plans focused on
EV infrastructure broadly for the state of Florida with small subsections regarding resilience,
whereas this report focuses centrally on resilience.
48
This report is available at no cost from the National Renewable Energy Laboratory at www.nrel.gov/publications.
When comparing the resilience aspects of each of these three reports, each adds value by
approaching the question with different methods and applications of input data, all while
adhering to similar MCDA workflows. The Florida Electric Vehicle Roadmap approached the
problem by incorporating land use and demographic data, such as employment locations, in
conjunction with EV adoption projects and current infrastructure. This project also identifies
near-term temporary station locations that serve rural areas and bolster key corridors. The EV
Infrastructure Master Plan has a more demand-focused approach to identify gaps for DCFCs
along the state highway system. The key difference in this methodology is the utilization of
traffic data and a focus on drive time to identify priority locations for DC fast stations along the
state highway system. The distinguishing factor of this project’s methodology behind the
development of the web mapping tool is a focus on spatial network connectivity of Florida’s
evacuation routes, and filling gaps within that network regardless of normal traffic demand or
local demographics. This methodology was created under the assumption that although the state
highway system and the emergency evacuation routes often overlap, travel demand would likely
dramatically shift during a flooding event. However, normal demand was considered under the
EVI-Pro section as it relates to county-level projections, but this aspect of the project is separate
from the specific resilience-related station siting.
GIS Summary
This section introduces the data, methods, and resulting web map tool of the Florida alternative
fuel resilience project. The analysis uses an MCDA spatial analysis approach that identifies areas
along Florida’s emergency evacuation routes that are vulnerable to flood or storm surge events
for each fuel type including propane, CNG, DCFC EV, and Level 2 EV. After using emergency
shelter location data to fill in the vulnerable areas, it was found that using just these locations
could increase the evacuation route corridor coverage from 87.6% to 99.0% across all alternative
fuel types.
The analysis in this section showed strong potential for bolstering Florida’s alternative fuel
infrastructure along emergency routes by inclusion of emergency shelters alone as possible
locations for new AFV stations. These results, however, were based on baseline assumptions
about the vulnerability of current stations based on overlap with flood zones and a lack of other
data for new station options for each county. Local officials will have a better understanding of
local geography, government programs, and other factors that might allow them to identify better
locations for new stations. These local officials can then import their own data into the Florida
Alternative Fuel Resilience web tool for more refined analyses based on their local expertise.
The objective of this analysis was ultimately to identify a pathway for completing alternative fuel
corridors along Florida’s emergency evacuation routes for both evacuations and emergency
operations. However, it did not factor travel demand or load for the alternative fuel stations.
Future iterations of this work might include more of this type of data to determine where stations
should be installed from both a spatial and travel demand perspective. Lastly, this analysis was
generalized to the entire state of Florida, but storms and flood events impact different parts of the
state and affect the emergency management system dynamically. A case study incorporating the
results of this analysis using data from a historical flood event could better refine the
methodology of this analysis and provide further direction on broadening this analysis to be more
impactful.

49
This report is available at no cost from the National Renewable Energy Laboratory at www.nrel.gov/publications.
8 Laws, Regulations and Organizations Relevant to
Resilience Planning
This Alternative Transportation Fuel Resilience Plan must complement other actions that the
state of Florida and local governments have taken to prepare for natural disasters and improve
resilience. It must utilize existing laws and regulations, leverage the work of regional planning
councils, and build upon work done by the state government.
Relevant Laws and Regulations
The peninsular geography of Florida requires planning officials to incorporate resilience goals
into planning documents for a variety of natural hazard scenarios. The State Comprehensive Plan
provides long-range policy guidance for the orderly management of state growth (Section
187.101(1), F.S.), while local governments are required to adopt local comprehensive plans to
manage future growth of their localities (Section 163.3167(2), F.S.). Local development must
conform to the local Plan’s provisions,
15
which may include provisions to better utilize
alternative fuel vehicles for hurricane-related evacuation, emergency, and recovery operations.
16
Local comprehensive plans must include principles, guidelines, standards, and strategies for
orderly and balanced future land development, which reflect community commitments to
implement these plans (Section 163.3177(1), F.S.) and identify procedures for monitoring,
evaluating, and appraising implementation (Section 163.3177(1)(d), F.S.). Mandatory elements
of these plans include the following:
• Capital improvements (Section 163.3177(3)(a), F.S.);
• Future land use plan (Section 163.3177(3)(a), F.S.);
• Intergovernmental coordination (Section 163.3177(3)(h), F.S.);
• Conservation (Section 163.3177(3)(d), F.S.);
• Transportation (Section 163.3177(3)(b), F.S.);
• Sanitary sewer, solid waste, drainage, potable water, and aquifer recharge (Section
163.3177(3)(c), F.S.);
• Recreation and open space (Section 163.3177(3)(e), F.S.);
• Housing (Section 163.3177(3)(f), F.S.); and
• Coastal management (Section 163.3177(3)(g), F.S.).
Regional Planning Councils
In 1980, the Florida Legislature passed the Florida Regional Planning Council Act, finding that
“there is a need for regional planning agencies to assist local governments to resolve their
common problems, engage in areawide comprehensive and functional planning, administer
15
For a discussion of the requirement that Florida localities maintain comprehensive plans informed by an analysis
of “relevant and appropriate data,” see David L. Markell, Emerging Legal and Institutional Responses to Sea-Level
Rise in Florida and Beyond, 42 Colum. J. Envtl. L. 1, 23–26 (2016).
16
In their local government land development regulations, counties and municipalities must include a provision for
“Ensuring safe and convenient onsite traffic flow, considering needed vehicle parking.” Section 163.3202(2)(h), F.S.

50
This report is available at no cost from the National Renewable Energy Laboratory at www.nrel.gov/publications.
certain federal and state grants-in aid, and provide a regional focus in regard to multiple
programs undertaken on an areawide basis.” (Section 186.502(1)(b), F.S.)
The state’s 10 regional planning councils (RPCs) have “a duty to assist local governments with
activities designed to promote and facilitate economic development in the geographic area
covered by the council.” (Section 186.502(5), F.S.). Additionally, RPCs have a duty “to
cooperate, in the exercise of its planning functions, with federal and state agencies in planning
for emergency management,” (Section 186.505, F.S.) which they have historically fulfilled by
conducting regional evacuation studies to assist county emergency management departments as
they develop operational evacuation plans.
Resilient Florida
The FDEP Office of Resilience and Coastal Protection offers technical assistance and funding to
communities dealing with coastal flooding, erosion, and ecosystem changes through various
programs related to coastal issues. The Coastal Construction Control Line Program
(https://floridadep.gov/rcp/fcmp) and the Florida Resilient Coastlines Program
(https://floridadep.gov/rcp/florida-resilient-coastlines-program) prepare coastal communities and
habitats for the effects of sea level rise.
An additional resource is the Florida Adaptation Planning Guidebook, made available by FDEP
for use by local governments to develop and update adaptation plans for sea level rise (FDEP
2018. The adaptation planning process outlined in the guidebook is intended to be used by local
government planners in cities and counties of any size, especially as they identify adaptation
strategies and prioritize adaptation needs, which may include protection, accommodation, retreat,
and avoidance strategies.
Functions of the Florida Department of Agriculture and Consumer
Services
The first laws governing the sale of propane (termed “liquefied petroleum gas”) were enacted by
Florida’s legislature in 1947 in order to provide the industry with uniform regulation of products
in the state. The original law was contained in Chapter 526, Florida Statutes, and entitled “Sale
of Liquid Fuels.” In 1961, Chapter 527, Florida Statutes, was created to govern the safe storage,
transportation, sale, and use of propane in Florida.
Personnel from FDACS’s Division of Consumer Services perform functions such as weighing
and measuring device inspections and motor fuel testing.
17
The Bureau of Compliance is
currently responsible for licensing, examinations and training. The Bureau of Standards (bureau)
is responsible for the administration and enforcement of Chapter 527 of the Florida Statutes and
rules promulgated in accordance with that chapter. These laws and rules, and the national safety
codes adopted therein, afford the bureau broad enforcement powers over all propane activities
within Florida. The bureau’s public responsibility for propane safety begins when the product
enters the state's borders and continues until the product is safely consumed by the public.
17
FDACS, Division of Consumer Services, “Liquified Petroleum Gas Laws and Rules” (Oct. 2020 Edition),
available at: https://www.fdacs.gov/content/download/73844/file/Florida-Laws-and-Rules-Guide.pdf
51
This report is available at no cost from the National Renewable Energy Laboratory at www.nrel.gov/publications.
Additionally, FDACS enforces the following rules, standards, and regulations: Rule Chapter 5J-
20, Florida Administrative Code, which adopts NFPA 58, Liquefied Petroleum Gas Code; NFPA
54, National Fuel Gas Code; NFPA 110, Standard for Emergency and Standby Power Systems;
and Title 49, Parts 191-192 and 199, Code of Federal Regulations. These laws, codes, rules, and
regulations require the bureau to inspect any site within Florida where propane is stored
(including bulk plants, dispensing units, bulk storage sites, trucks, etc.), and authorize the bureau
to perform certain duties. These duties include investigating all propane-related accidents,
licensing all propane activities in this state, and training and administer competency
examinations to industry personnel. These licensing, inspection, investigation, and training
activities enable the department to ensure that only competent persons engage in LP gas business
activities and that compliance with acceptable safety codes and standards is achieved statewide.
9 Vehicles in Standing Water
To better understand what issues real-world fleets are dealing with when it comes to flooding
and high-water conditions, NREL performed a literature review and had multiple discussions
with fleets in hurricane- and flooding-prone areas of the country. The goal of these discussions
was to learn specifics about any history with vehicles in high-water conditions, including what
vehicles they use in these situations (if any) and why they may or may not fare better than other
vehicles in the fleet. NREL also wanted to identify if any vehicles were specifically purchased
because of their abilities in high water, or if any modifications were made to existing vehicles in
the fleet to allow them to operate better in standing water. Finally, we discussed alternative fuel
vehicle use in the fleet, including any plans for incorporating alternative fuels in the future and
the impact on the fleet’s capabilities to drive through standing water.
The following subsections discuss key findings from the literature search and fleet interviews,
including components of high-water-capable vehicles, fleet-preferred high-water vehicles, and
the feasibility of alternative fuel use in these fleets.
Important Components of High-Water-Capable Vehicles
In the literature review (Appendix F), NREL identified common damage to vehicles that have
been through high-water conditions, including damage to engines and transmissions, electrical
components, and vehicle interiors. Some of these occur immediately, leaving vehicles stranded,
and others set in later after the vehicle has performed its emergency mission. Subsequently,
NREL’s discussions with fleets reinforced many of the findings of the literature review, as
discussed here and summarized in Figure 30.
First, fleets with vehicles using any kind of combustion (including diesel, CNG, and propane)
must consider how high the vehicles’ engine air intake systems are to ensure the engines do not
stall. If enough water entered the air intake system, the engine would stall immediately, thus
leaving the vehicle inoperable. Second, electrical components are part of the car that can sustain
substantial damage from flooding (Scott 2020). Most electrical components are sealed to be
water-resistant and can handle water for short periods of time. However, submersion is a
potential cause of failure during these situations because wires can short and saltwater will cause
corrosion in the longer term. One of the propane school bus fleet managers that was interviewed
pointed to transmission control modules as being one of the lowest electronic devices that was
not waterproof.
52
This report is available at no cost from the National Renewable Energy Laboratory at www.nrel.gov/publications.
Third, fleets must ensure that other air intakes or vents are prepared to avoid or withstand water
intrusion. To do this, it is important to remotely mount the transmission and differential vent tube
separate from the components at the highest points possible. This will allow for the vehicle to
operate longer while in high-water situations. Another important consideration is the automatic
transmission vent; the automatic transmission needs fluid to stay in a viscous state for it to
operate properly. If water were to be introduced into this fluid, it would lower its effectiveness
and even possibly prevent it from operating. The cabin air system also has air intakes that are a
point of vulnerability. This intake is higher than the engine’s air intake system or transmission
vent and doesn’t lead to engine stall or transmission seizure but is still detrimental to the
operability of the vehicle.
While air intakes and vents are the most vulnerable to water intrusion, other components are
vulnerable to slower seepage. The differential, which is a set of gears that sits beneath the vehicle
and transmits engine power to the wheels, is one such component. While water in the differential
is not ideal, it could operate for some amount of time if water seeped into the drive axle housing.
The differential operates with gears meshing with gears, and its fluid mechanism allows for both
lubrication and cooling. Therefore, it can tolerate water intrusion for some period before failure.
That said, it is important to ensure that all vehicle components are protected in the case of a high-
water situation to safely operate the vehicle.
Another key consideration is vehicle buoyancy. A fleet may have taken all the precautions to
prevent water from entering key operating components, but the vehicle may still have the
potential of being swept away in high water. Typical passenger vehicles can begin to float in less
than 2 feet of water. Buoyancy liftoff occurs later (deeper) in vehicles with higher clearance,
greater mass, smaller footprint, and better tire traction. It occurs earlier (shallower) if the water is
flowing quickly. However, it should be kept in mind that vehicles with greater mass tend to be
less efficient and spend limited fuel reserves more quickly.

53
This report is available at no cost from the National Renewable Energy Laboratory at www.nrel.gov/publications.
Figure 30. Medium-duty vehicle and its points of vulnerability to standing water.
Source: Josh Bauer, NREL
Electric Vehicles and Flooding
Electric vehicles are the only vehicles that do not require oxygen to operate. This has enabled the
EV company Rivian to claim in the specifications of their R1S and R1T than these vehicles can
drive through 43 inches of standing water.
18
However, this capability has not yet been enshrined
in their warranty. Likewise, Dannar claims that its electric offroad work vehicles can operate in
up to 4 feet of water.
19
According to an article in Green Car Reports (Evarts 2018), all-electric
vehicles typically have waterproof parts, such as the battery, traction motor, or inverter. In
addition, battery cells are generally sealed and watertight. Therefore, the most important parts of
the vehicle on an EV are typically less susceptible to water damage. However, the waterproofing
generally cannot be trusted if the battery is fully submerged in standing water—particularly salt
water. If that is the case, it is more likely that there will be damage done to the battery and
possibly fires. Evarts also notes that it is possible for larger battery packs and wiring to become
waterlogged and damaged in some EVs during flooding. Other than engines and transmissions,
EVs are generally susceptible to the same water damage already discussed.
High-Water Fleet Experiences
For many of the fleets that NREL spoke with, vehicle ground clearance was one of their main
considerations. The best high-water vehicles have good ground clearance. This higher ground
clearance raises the height of most of the vulnerable components previously mentioned. It also
will allow for the water to pass under the vehicle, allowing the weight of the vehicle to keep it
18
https://rivian.com/support/article/what-is-the-water-fording-height
19
https://www.dannar.us.com/
54
This report is available at no cost from the National Renewable Energy Laboratory at www.nrel.gov/publications.
from losing contact with the road surface. Many fleets indicated that they would choose vehicles
that were considered 1 ton or more to indicate a ground clearance and weight that would enable
the tires to stay on the ground.
For example, the city of Tampa chose several Fords for this purpose. Specifically, they chose F-
350 or larger (3500 series or larger in General Motors or Ram). Tampa also installed tires taller
than stock. Doing this allows them to go into higher water than they would be able to with a
standard pickup truck. Tampa also chose to make some of their heavier equipment, like their
Class 6–8 vehicles, capable of multiple uses. For example, vehicles that might be used for street
repair or other service applications could be used in high-water situations if need be. These
vehicles typically have higher air intake systems, with the transmission and differential vents
already relocated when the trucks have their body upfits completed. It is important to note that
these vehicles could run on a variety of fuels, but in most cases, they were either diesel or
gasoline. There are also options for natural gas in these applications, which have sealed fuel
systems without vulnerable vapor recovery systems.
During discussions with multiple fleets, NREL found that many of them, such as Hillsborough
County, rely on special equipment ordered for their fire departments for just these types of
situations. It was not uncommon to find that they had a few special-purpose vehicles that could
help in high-water situations. They also rely on different types of watercrafts that can be
deployed when the water surpasses a certain level. The key is to not become part of the problem
themselves by requiring rescue. Safety is always paramount.
NREL also spoke with the Medical University of South Carolina (MUSC) and discussed how
they handle their fleet when the water rises in their area. MUSC’s first building was built in
1829; since then, the university has grown into a much larger campus. The university is built in
an area that is prone to flooding, which has forced the staff to investigate creative ways to move
its staff between buildings. One of these ways is the use of a simple dinghy, a small boat, that
can move staff from building to building during flood conditions. The boats are not powered, so
they are typically walked through the water by guides on each side. This can be done if the water
is not much more than 2 feet in depth and the undercurrent is what they would consider
acceptable to move staff safely.
Another way MUSC moves staff is with a Light Medium Tactical Vehicle (LMTV) truck. These
are vehicles originally used by the military for standard operations. They have two of these
vehicles. One is an H1 Hummer made by AM General, and the other is a Stevenson M1079
LMTV 4x4 that they acquired when they were ready to be cycled out of the military system.
When military vehicles are ready to be cycled out, the military typically gives local jurisdictions
an opportunity to receive these vehicles as a donation. MUSC repurposed the vehicles to be able
to transport staff from building to building when flooding occurs. These work well when the
water is too deep to use safely.
Municipalities and governmental jurisdictions are responsible for the health and safety of their
communities. After multiple discussions with various municipalities and governmental
jurisdictions, it became clear that the primary focus of these fleets is to move citizens and
vehicles away from the possible affected area before the storm surge arrives. This proactive
measure is the best way to ensure vehicle and citizen safety in the case where waters rise very
55
This report is available at no cost from the National Renewable Energy Laboratory at www.nrel.gov/publications.
quickly. NREL also found that local governments work with their respective school districts to
utilize their school bus fleets to move large numbers of people in a short period of time to safe
locations. School buses typically operate on diesel, with the option for propane and electric
becoming more common. School uses are ideal with their closed fuel systems, as described in the
following section.
High-Water Vehicle Conclusions and Recommendations
As discussed in this section and in Appendix F, most designated high-water vehicles have good
ground clearance to allow for the water to pass under the vehicle, allowing the weight of the
vehicle to keep it from losing contact with the road surface. Higher-ground-clearance vehicles
also keep the vulnerable components farther off the ground and safer from water damage.
Therefore, for fleets looking to incorporate high-water-capable vehicles into their fleets, we
recommend identifying vehicles that have good ground clearance and have their components as
high off the ground as possible. Some examples discussed here include the Ford F-350 and
LMTV trucks.
For fleets looking to incorporate alternative fuels, AFVs may be a good option for use during
high-water situations. This is because, for example, vehicles that are powered by propane or
natural gas have completely sealed fuel systems. Therefore, at no point would water be allowed
to infiltrate the fuel system until it is combined with air in the combustion chamber. In addition,
natural gas and propane vehicles do not require a vapor recovery system, which is prone to water
damage for conventionally fueled vehicles, and thus would not be a concern for high water.
Not only are alternative-fueled vehicles themselves possibly more reliable during high water, but
it is also important to note that alternative fueling stations can be designed with backup
generation to provide power during times where the standard power sources are interrupted. For
example, natural gas stations can utilize natural gas compressors to power the sites without
interruption in the case of a power outage.
As discussed in Appendix F, EVs are the only vehicles that do not require air intake to operate.
Therefore, the most important parts on an EV are typically less susceptible to water damage.
Some EV manufacturers, such as Rivian and Dannar, advertise that their vehicles are capable of
crossing high water without damage to the vehicle. Rivian notes a water fording height of up to
43 inches in some of their vehicle models, whereas Dannar states that their work vehicles can
operate in up to 4 feet of water. However, before taking any EV through standing water, both the
vehicle warranty and the owner’s manual should be consulted. In some cases, driving a vehicle
through standing water may void the vehicle warranty. Furthermore, corrosion from extended
periods of submersion in saltwater can result in EV auto-ignition. This resulted in 11 EVs
burning after Hurricane Ian (Weise 2022), accelerating research into the impact that extended
periods of saltwater submersion has on EVs.
56
This report is available at no cost from the National Renewable Energy Laboratory at www.nrel.gov/publications.
10 Conclusions and Recommendations
Diversifying transportation fuels to include natural gas, propane, and electricity can improve
transportation resilience in the face of hurricanes in Florida. The FDACS, NREL, and the
University of South Florida have come together to develop this Alternative Transportation Fuel
Resilience Plan so that Florida can take the necessary steps to be ready to utilize their AFVs in
evacuation and recovery operations. All three organizations reached out to key stakeholders and
convened a workshop to better understand the needs and challenges of transportation during
hurricanes.
Communication is a problem for transportation operations during hurricanes—a problem that the
reduced number of refueling stations exacerbates. To alleviate this problem, NREL created a
web tool that provides fleet managers with key resilience preparation information, including the
compatibility of refueling stations to their vehicles and emergency contact information. Since
EVs are projected to increase quickly in Florida, NREL ran EVI-Pro to determine the EVSE
needs in 2030 and 2050. By 2030, Florida is expected to need 45,485 nonresidential charging
stations, with 54% being work L2, 34% public L2, and 12% DCFC. Broward County will need
the most charging stations and Lafayette will need the fewest.
Utilizing alternative fuels for evacuation and emergency purposes requires geographical logistics
and planning. NREL performed a GIS analysis to determine which corridor (key to connectivity)
stations are likely to be inundated during a hurricane and where new stations could be located to
improve that connectivity. One strategy the analysis pursued was placing alternative fueling
stations at emergency evacuation shelters, since these are in relatively safe areas and they are
central to much of the evacuation and essential supply transportation. This analysis found that
statewide, placing stations at shelters could increase the evacuation route corridor coverage from
87.6% to 99.0% across all alternative fuel types. The highest value of the GIS tool is using it at
the local level with specific fuel types and scenarios. Therefore, NREL made the GIS tool
available to the public and used the tool to run a case study of Dixie County to show how to use
it.
One of the main vulnerabilities that vehicles have to hurricanes is standing water. Through a
literature search and fleet interviews, NREL assessed the vehicle components that are vulnerable
to standing water, categorized the severity of this vulnerability, and charted them based on
relative height. NREL also highlighted differences between AFVs and preparations that can be
taken to enable vehicles to withstand greater depths of standing water.
The Florida Alternative Transportation Fuel Resilience Plan lays a pathway for resilience and
emergency planners to strategically bolster their alternative fueling infrastructure and fleets so
they can be ready to provide evacuation, emergency, and recovery operations during future
hurricanes. Many of the preparations outlined in this plan can be transferred to other states or
regions of the world, and similar tools can be developed for other regions. Furthermore, many of
the general strategies can be adapted to be helpful in the face of other disasters such as floods,
forest fires, or freezing stretches due to the polar vortex.

57
This report is available at no cost from the National Renewable Energy Laboratory at www.nrel.gov/publications.
References
Adderly, Shawn A., Daria Manukian, Timothy D. Sullivan, and Mun Son. 2018. “Electric
vehicles and natural disaster policy implications.” Energy Policy 112: 437–448.
Belson, Ken. 2011. “After Disaster Hit Japan, Electric Cars Stepped Up.” The New York Times,
May 6, 2011. https://www.nytimes.com/2011/05/08/automobiles/08JAPAN.html.
Burk, Kelley, April Combs, Doug Kettles, and Kaitlin Reed. 2020. Florida Electric Vehicle
Roadmap: Executive Report. Tallahassee, FL: FDACS.
www.fdacs.gov/ezs3download/download/95682/2638040/Media/Files/Energy-Files/EV-
Roadmap-Report/EV_ROADMAP_REPORT_2020.pdf.
Bushnell, J.B., E. Muehlegger, and D.S. Rapson. 2022. Energy Prices and Electric Vehicle
Adoption. Cambridge, MA: National Bureau of Economic Research.
Crisostomo, Noel, Wendell Krell, Jeffrey Lu, and Raja Ramesh. 2021. “Assembly Bill 2127:
Electric Vehicle Charging Infrastructure Assessment.” California Energy Commission.
Dziuk, Brian. 2020. “Municipalities, GPS Tracking, and Hurricane Season: What to Know.”
Rastrac, July 30, 2020. https://info.rastrac.com/blog/vehicle-fleet-safe-hurricane-season.
Energy Information Administration, “This Week in Petroleum” (Sep. 14, 2022), available at:
https://www.eia.gov/petroleum/weekly/propane.php
Energy Information Administration, “Florida State Profile and Energy Estimates”. (Dec 16,
2021), available at https://www.eia.gov/state/analysis.php?sid=FL
Evarts, Eric. 2018. “What Happens to Electric Cars that Have Been Flooded?” Green Car
Reports, Sept. 25, 2018. https://www.greencarreports.com/news/1118889_what-happens-to-electric-
cars-that-have-been-flooded.
FDEP 2018. Florida Adaptation Planning Guidebook: Glossary, available at
https://floridadep.gov/sites/default/files/AdaptationPlanningGuidebook.pdf.
Federal Highway Administration (FHWA). 2017. “National Household Travel Survey.”
https://nhts.ornl.gov/.
———. 2021. “Alternative Fuel Corridors.”
https://www.fhwa.dot.gov/environment/alternative_fuel_corridors/.
Feng, K., N. Lin, S. Xian, and M.V. Chester. 2020. “Can we evacuate from hurricanes with
electric vehicles?” Transportation Research Part D: Transport and Environment 86: 102458.
Fereiro, Stephanie. 2018. “How to prevent damage to your vehicle during a flood.” Economical
Insurance, Sept. 19, 2018. https://www.economical.com/en/blog/economical-blog/september-
2018/prevent-damage-to-your-vehicle-during-a-flood.

58
This report is available at no cost from the National Renewable Energy Laboratory at www.nrel.gov/publications.
Florida Department of Transportation (FDOT). 2021. EV Infrastructure Master Plan.
Tallahassee, FL: FDOT. https://fdotwww.blob.core.windows.net/sitefinity/docs/default-
source/planning/fto/fdotevmp.pdf
Florida Division of Emergency Management (FDEM). 2020. State of Florida Comprehensive
Emergency Management Plan. Tallahassee, FL: FDEM.
https://www.floridadisaster.org/globalassets/cemp/2020-cemp/2020-state-cemp.pdf.
———. 2021. “GATOR GIS Tool.”
https://floridadisaster.maps.arcgis.com/apps/webappviewer/index.html?id=f5628cfc02ca42b4a3853c69d8
ff804b
Florida Solar Energy Center (FSEC). 2021. “Resilient Florida Buildings: Alternative Fuel
Options for Maintaining Power During Outages.” Cocoa, FL: University of Central Florida.
http://fsec.ucf.edu/~carlos/FDACS/BLDG-89_FDACS-Resiliency-2020-0201.pdf.
Force, Kristen. 2005. “Hurricanes Show Resilience of Florida Fleet Departments.” Government
Fleet, Jan. 1, 2005. https://www.government-fleet.com/145226/hurricanes-show-resilience-of-florida-
fleet-departments.
Ge, Yanbo, Christina Simeone, Andrew Duvall, and Eric Wood. 2021. There's No Place Like
Home: Residential Parking, Electrical Access, and Implications for the Future of Electric
Vehicle Charging Infrastructure. Golden, CO: National Renewable Energy Laboratory.
NREL/TP-5400-81065. https://www.nrel.gov/docs/fy22osti/81065.pdf.
Glasheen, Jasmine. 2020. Fleet Playbook for Today’s Emergency Preparedness. Boston, MA:
NAFA Fleet Management Association. Edison, NJ.
Hodges, Tina. 2011. Flooded Bus Barns and Buckled Rails: Public Transportation and Climate
Change Adaptation. Washington, D.C.: Federal Transit Administration. FTA Report No. 0001.
https://www.transit.dot.gov/sites/fta.dot.gov/files/FTA_0001_-
_Flooded_Bus_Barns_and_Buckled_Rails.pdf
Jensen, Andy. 2019. “Fixing a Flood-Damaged Engine: Where to Start.” Advance Auto Parts,
Oct. 10, 2019. https://shop.advanceautoparts.com/r/advice/car-maintenance/fixing-a-flood-damaged-
engine-where-to-start.
Jerew, Benjamin. 2020. “Car Flood Damage Repair: Is It Possible?” NAPA Know How Blog,
July 22, 2020. http://knowhow.napaonline.com/car-flood-damage-repair-is-it-possible/.
Kavanagh, Bernie. 2020. “Hurricane Preparedness for Fleets.” Fleet Management Weekly.
www.fleetmanagementweekly.com/hurricane-preparedness-fleets/.
Kolpakov, A., Sipiora, A., Johnson, C. & Nobler, E. 2021. Transportation Fuel Resiliency: Case
Study of Tampa Bay. Transportation Research Board, Transportation Research Record, number
20-07146. https://trid.trb.org/view/1759462

59
This report is available at no cost from the National Renewable Energy Laboratory at www.nrel.gov/publications.
Kossin, James P. "A Global Slowdown of Tropical-Cyclone Translation Speed." Nature 558, no.
7708 (2018): 104-107.
Knutson, Tom. “Global Warming and Hurricanes: An Overview of Current Research Results.”
National Oceanic and Atmospheric Administration’s Geophysical Fluid Dynamics Laboratory.
Accessed 9/8/2022 at https://www.gfdl.noaa.gov/global-warming-and-hurricanes/
MarketsandMarkets. 2021. Electric Vehicle Market by Component, Vehicle Type, Vehicle Class,
Propulsion (BEV, PHEV, FCEV), Vehicle Drive Type (FWD, RWD, AWD), Vehicle Top Speed
(<125 mph, >125 mph), Charging Point Type, Vehicle Connectivity, End Use, Region - Global
Forecast 2030. Pune, India: MarketsandMarkets. https://www.marketsandmarkets.com/Market-
Reports/electric-vehicle-market-209371461.html.
Moniot, Matthew, Clément Rames, and Eric Wood. 2019. Meeting 2025 Zero Emission Vehicle
Goals: An Assessment of Electric Vehicle Charging Infrastructure in Maryland. Golden, CO:
National Renewable Energy Laboratory. NREL/TP-5400-71198.
https://www.nrel.gov/docs/fy19osti/71198.pdf.
Morris, Charles. 2015. “PG&E exportable power truck saves the day in California wildfire
evacuation.” Charged, Oct. 19, 2015. https://chargedevs.com/newswire/pge-exportable-power-
truck-saves-the-day-in-california-wildfire-evacuation/.
National Weather Service. 2020. “Turn Around Don’t Drown.” Accessed Aug. 3, 2020.
https://www.weather.gov/safety/flood-turn-around-dont-drown.
Phiophuead, T., and N. Kunsuwan. 2019. “Logistic regression analysis of factors affecting travel
mode choice for disaster evacuation.” Engineering Journal 23: 399–417.
Pioneer Power Solutions, Inc. 2022. “Pioneer Power Sells Mobile EV Charging Solution E-
BOOST to Commercial EV Charging Infrastructure Solutions Company.” PR Newswire, March
28, 2022. https://www.prnewswire.com/news-releases/pioneer-power-sells-mobile-ev-charging-
solution-e-boost-to-commercial-ev-charging-infrastructure-solutions-company-301511613.html.
Rajaeifar, M.A., P. Ghadimi, M. Raugei, Y. Wu, and O. Heidrich. 2022. “Challenges and recent
developments in supply and value chains of electric vehicle batteries: A sustainability
perspective.” Resources, Conservation and Recycling.
Roberts, Jack. 2019. “Weathering the Storm: How Truckers and Fleets Can Prepare for
Hurricanes.” Truckinginfo, Aug. 20, 2019. https://www.truckinginfo.com/339563/weathering-the-
storm-four-ways-truckers-and-fleets-can-prepare-for-hurricanes.
Scott, Kim. 2020. “Problems With Flooded Cars.” It Still Runs, accessed Aug. 3, 2020.
https://itstillruns.com/problems-flooded-cars-5685699.html.
Selective Insurance. 2014. “Flood Vehicle Management Guidelines.”
https://www.selective.com/~/media/Files/S/Selective/documents/resource-center/resources/flyer-flood-
vehicle-management-guidelines.pdf.

60
This report is available at no cost from the National Renewable Energy Laboratory at www.nrel.gov/publications.
Sharone. 2018. “Preparing Your Fleet for Disasters.” Fleet Clean USA, Sept. 24, 2018.
https://www.fleetcleanusa.com/preparing-your-fleet-for-disasters/.
State Farm. 2020. “What to do if your car has flood damage.” Accessed Aug. 3, 2020.
https://www.statefarm.com/simple-insights/auto-and-vehicles/what-to-do-if-your-car-has-flood-damage.
Stradling, Richard. 2018. “What to do if your car has been flooded — and how to avoid buying a
water-damaged vehicle.” The News & Observer, Oct. 1, 2018.
https://www.newsobserver.com/news/business/article219303470.html.
Texas A&M Transportation Institute. 2013. Gulf Coast Climate Change Adaptation Pilot Study.
Washington, D.C.: Federal Transit Administration. FTA Report No. 0072.
https://www.transit.dot.gov/sites/fta.dot.gov/files/FTA_Report_No._0072.pdf
Thompson, Joe. 2017. “Propane is a first responder.” FleetOwner, Nov. 15, 2017.
https://www.fleetowner.com/perspectives/ideaxchange/article/21701481/propane-is-a-first-
responder.
Trop, Jaclyn. 2019. “What to Do If Your Car Is Flooded: A Step-by-Step Guide.” U.S. News &
World Report, May 8, 2019. https://cars.usnews.com/cars-trucks/what-to-do-if-your-car-is-flood-
damaged.
Unrau, Jason. 2016. “How to Reduce the Damage to a Flooded Car.” Your Mechanic, July 20,
2016. https://www.yourmechanic.com/article/how-to-reduce-the-damage-to-a-flooded-car-by-jason-
unrau.
U.S. Census Bureau. 2020. 2014—2018 American Community Survey 5-Year Data Profile.
U.S. Department of Energy (DOE). 2014. United States Fuel Resiliency, Volume 1: U.S. Fuels
Supply Infrastructure – Infrastructure Characterization. Washington, D.C.: DOE.
https://www.energy.gov/sites/prod/files/2015/04/f22/QER%20Analysis%20-
%20United%20States%20Fuel%20Resilience%20Volume%20I.pdf.
U.S. Department of Energy Office of Energy Efficiency and Renewable Energy (EERE). 2014.
“National Clean Fleets Partnership.” Washington, D.C.: EERE. https://doi.org/10.2172/1034217.
U.S. Energy Information Administration (EIA). 2014. “Florida Gasoline Supply Sources and
Prices Reflect Broader Market Shifts.” Today in Energy, April 1, 2014.
www.eia.gov/todayinenergy/detail.php?id=15651.
———. 2020. “Annual Energy Outlook 2020.” Jan. 29, 2020.
https://www.eia.gov/outlooks/archive/aeo20/.
———. 2021. “Annual Energy Outlook 2021.” Feb. 3, 2021.
https://www.eia.gov/outlooks/archive/aeo21/.
Wade, David. 2010. Driving Apparatus on Flooded Roadways Safely and Effectively. Virginia
Beach, VA: Virginia Beach Fire & Rescue. https://www.hsdl.org/?view&did=685845.

61
This report is available at no cost from the National Renewable Energy Laboratory at www.nrel.gov/publications.
Weiss, Elizabeth. “Something surprising can cause electric vehicles to catch on fire. Here's what
experts want you to know.” USA Today. October 26, 2022.
www.usatoday.com/story/money/cars/2022/10/26/electric-vehicle-fires-florida-flooding-what-
happened/10553207002/
Wong, S., S. Shaheen, and J. Walker. 2018. Understanding Evacuee Behavior: A Case Study of
Hurricane Irma. Berkeley, CA: UC Berkeley Transportation Sustainability Research Center.
https://escholarship.org/uc/item/9370z127.
Wood, Eric, Clément Rames, Matteo Muratori, Sesha Raghavan, and Marc Melaina. 2017.
National Plug-In Electric Vehicle Infrastructure Analysis. Washington, D.C.: U.S. Department
of Energy Office of Energy Efficiency and Renewable Energy. DOE/GO-102017-5040.
https://www.nrel.gov/docs/fy17osti/69031.pdf.
Wood, Eric, Sesha Raghavan, Clement Rames, Joshua Eichman, and Marc Melaina. 2017.
Regional Charging Infrastructure for Plug-In Electric Vehicles: A Case Study of Massachusetts.
Golden, CO: National Renewable Energy Laboratory. NREL/TP-5400-67436.
https://www.nrel.gov/docs/fy17osti/67436.pdf.
Zhang, L., S. Wang, and X. Qu. 2021. “Optimal electric bus fleet scheduling considering battery
degradation and non-linear charging profile.” Transportation Research Part E: Logistics and
Transportation Review 154: 102445.

62
This report is available at no cost from the National Renewable Energy Laboratory at www.nrel.gov/publications.
Appendix A. SAIDI Zone Data Provided to NREL
63
This report is available at no cost from the National Renewable Energy Laboratory at www.nrel.gov/publications.
Appendix B. Site Visit Summaries
Waste Pro Facility and CNG Fueling Site
Waste Pro’s conversion to CNG began in 2016 with the construction and installation of CNG
stations at the Sanford and Sarasota Waste Pro facilities, and was fully operational by 2017.
The Sanford CNG station can accommodate fueling a maximum of 110 CNG refuse trucks, but
as of the writing this report, Waste Pro has a fleet of 48 CNG haulers and 20 diesel refuse trucks
(capable of handling 16 tons of garbage). Florida Utility (Infinite Energy) supplies natural gas to
support Waste Pro’s fueling system, and Waste Pro receives 120,000 gallons of diesel fuel
delivered daily from Lynch Oil to fuel the diesel refuse haulers, which are fueled nightly.
Although Waste Pro does not store diesel on-site, they do have on-site fueling.
The Waste Pro CNG fueling system has two 250-horsepower Clean Energy compressors that
pressurize Waste Pro’s CNG at a higher rate compared to rates that similar fleets use, but there
are lower-pressure options. Waste Pro receives natural gas at 100 psi from the natural gas service
line (Infinite Energy) and compresses it to slightly above 3,800 psi. CNG is delivered at 3,800
psi to the fueling nozzles.
The city of Sanford provided the land for building the CNG station, and Clean Energy built and
also maintains the CNG fueling infrastructure. To construct the CNG fueling system, Waste Pro
bored under the ground fuel lines. Harland Chadbourne, Director of Purchasing for Waste Pro,
noted that Waste Pro prefers the aboveground infrastructure (e.g., pipeline) because it can be cut
and reconfigured as needed. The fueling hosts (gas lines fueling the trucks) comprise 20–25-foot
hoses. There are 80 dual-fuel fueling hookups to fuel the trucks parked in the lot. The dual-fuel
posts can be changed to quad if needed. It was noted that there is a gas line as well as electrical
to power the fueling equipment.
For Waste Pro’s needs, time-fill was the best option for refueling at the Sanford facility, though
Waste Pro does operate fast-fill stations at other locations. Considering the Waste Pro trucks are
typically within 30 minutes of the main fueling depot in their service territory, it is not necessary
to fuel outside of the Sanford station unless there are extenuating circumstances (e.g., fuel supply
is disrupted or the truck travels outside of the service territory). Waste Pro is able to do a quick
fuel-up of the trucks if needed. While the Sanford station is time-fill, it is capable of also doing a
fast fill (but not all vehicles are able to be fast-filled at the same time). Waste Pro can
accommodate a fast fill for 1–2 trucks, but if many trucks are filling at the same time, it will not
be able to fill quickly. Fast-fill usually takes 15–20 minutes. Drivers usually look at tank
pressure to determine fill status of the tank (and do not have to rely on vehicle gauges, which can
be inaccurate). A pressure of 3,800 psi means a full tank, 1,200 psi is 1/4 of a tank, and 600 psi is
close to empty engine stall. To obtain access to fueling, each truck has a barcode.

64
This report is available at no cost from the National Renewable Energy Laboratory at www.nrel.gov/publications.
Figure B-1. Gauge above 400 psi at WastePro.
Source: Tampa Bay Clean Cities
The CNG rear haulers have dual nozzles, which can accommodate a quick charge of up to 3,800
psi. Waste Pro operates purpose-built Cummins 6-cylinder, 10.7-liter engine refuse haulers,
which are the same size as the diesel trucks.
Fuel redundancy is an important strategy for Waste Pro. There needs to be redundancy so one
pump is able to rest while the other pump is working. In terms of backup power, the Sanford
facility has a diesel generator (140 kW) that can potentially operate for up to a week with its
1,000-gallon diesel storage. In the past, Waste Pro ran the diesel generator for 2 days nonstop.
The only natural gas interruption that Waste Pro experienced in the past was when a gas line
ruptured in Sanford that disrupted supply to the station for 2 days.
When evaluating the payback period on CNG, Waste Pro determined that there is approximately
a 5–6-year payback period on CNG and found that if a fleet has 50 or more trucks and requires
200,000+ gallons of fuel per year, it makes economic sense to have a bulk diesel or CNG station
instead of receiving daily fuel deliveries. Waste Pro plans to continue integrating on-site diesel
tanks and CNG fueling.

65
This report is available at no cost from the National Renewable Energy Laboratory at www.nrel.gov/publications.
Figure B-2. Natural gas line service inlet at 100 psi.
Source: Tampa Bay Clean Cities
Regarding maintenance, Waste Pro is contracted with a third party to conduct inspections of the
CNG tanks. There are three different maintenance bays on property. The refuse trucks have
methane detectors both in the truck and in the maintenance bays. Waste Pro conducts its own
driver training through a 4-day course.
Although Waste Pro has not experienced flooding with past hurricanes, there have been instances
when the CNG supply was impacted. Waste Pro has a mobile tank and rescue truck capable of
filling a quarter tank of diesel to get the truck back to the yard. The mobile tank is charged at the
fueling facility. There are capabilities for sharing fueling. Since the air intake is located high on
the refuse trucks, they can handle standing water up to the windows (though this would not be
recommended). Waste Pro is considered an essential service and has fueling capabilities.
The overall cost of the Sanford CNG station was $1.5–$1.7 million. Waste Pro pays for this in
the price of the CNG gallon of gasoline equivalent. The diesel-powered backup generator cost
approximately $70,000-$150,000. Clean Energy offers finance deals when you pay for station
construction in terms of the price of the gallon. Harland also mentioned that cities can have deals
in place beforehand to reduce capital costs. The payback is usually 5–7 years. Diesel and CNG
refuse haulers can cost anywhere in a range of $350,000 to $400,000, whereas electric refuse
66
This report is available at no cost from the National Renewable Energy Laboratory at www.nrel.gov/publications.
trucks are approximately $700,000–$750,000. At this price point, electric trucks are hard to
justify at this time, and there is barrier to entry because of the capital costs required to invest in
electric refuse haulers.
Waste Pro is considering renewable natural gas and will be signing their first such contract.
Seminole County Schools
Seminole County Schools (“Seminole”) began adopting propane (LPG) in 2015. There are two
county school-owned facilities: the Midway Transportation Complex and the Winter Springs
Transportation Compound. Seminole County Schools run approximately 140 school buses at the
Midway Transportation Complex and 310 school buses at the Winter Springs Compound.
Approximately 30% of the fleet are propane-powered (the rest are diesel). Seminole’s goal is to
have 75% of the fleet transitioned to propane. The Midway facility is the primary fueling station.
They have two 1,000-gallon propane tanks (owned by AmeriGas) that includes one dispenser
and two hoses with euro nozzles (Strobli nozzles) to perform propane fueling. The LPG school
buses are fueled once or twice per day. Seminole County Schools finds they get approximately
4–5 miles per gallon on the propane school buses. They estimate that 1.35 gallons of propane
autogas is equivalent to 1 gallon of diesel, but propane fuel costs are lower, and this is where
savings are found. There is a secondary fueling site with a 2,000-gallon propane tank at the
Winter Springs complex. Seminole County Schools receives 1–2 daily deliveries from
AmeriGas, depending on the need. Seminole is currently working on purchasing an 18,000-
gallon propane tank to move away from the daily AmeriGas deliveries. Seminole has never
experienced issues with AmeriGas LPG deliveries.
Seminole County Schools uses Thomas (LPG), Blue Bird (LPG), and International (diesel)
buses, and the buses run approximately 100–200 miles per day. They get slightly lower range
with LPG. There are 75- to 100-gallon tanks in each school bus (the LPG buses can store 60 to
70 gallons on board), but these onboard tanks are only filled up to 80%. Seminole also stores
diesel on-site. At the Midway Complex, there are two 20,000-gallon diesel tanks. At the Winter
Springs Compound, there are three underground 20,000-gallon diesel tanks and one 20,000-
gallon unleaded gasoline storage tank.
Seminole has not experienced interruption of their LPG deliveries/supply, even during hurricane
and tropical storm events. They rely on historical fuel use data from prior hurricanes to estimate
fuel needs for an impending storm, but there is no perfect way to predict fuel needs fully
accurately during an emergency. Seminole fuels buses prior to the storm (diesel and propane)
and also ensures that the diesel generator located at the Winter Springs Compound is topped off
and diesel storage tanks are full.
Seminole County Schools credits good communication with AmeriGas as the reason the district
has not experienced fuel shortages or interruptions. They can also modify regularly scheduled
delivered with AmeriGas, depending on fueling needs. AmeriGas has a mobile refueling system
(Seminole would need to call AmeriGas and arrange to utilize the mobile refueling system). This
mobile refueling system can be used if the LPG bus is stranded on the road without fuel. During
past hurricane events, Seminole County Schools had loose agreements in place to fill up at Lynx
if needed (diesel fuel). School buses are not equipped to deal with standing water. Seminole is
tasked with performing evacuations (“Emergency Evacuation Team”), and there is high demand

67
This report is available at no cost from the National Renewable Energy Laboratory at www.nrel.gov/publications.
for wheelchair-capable buses for evacuation (these are diesel-powered school buses). Emergency
evacuations are done, but roads are required to be cleared from debris (especially relevant for
post-storm activities to resume operation of the school buses on roadways). Seminole uses both
LPG and diesel school buses to perform these evacuations and other transport duties.
Figure B-3. 400-kW genset at Seminole County Schools.
Source: Tampa Bay Clean Cities
Figure B-4. Diesel storage at Seminole County Schools (2,877 gallons).
Source: Tampa Bay Clean Cities
68
This report is available at no cost from the National Renewable Energy Laboratory at www.nrel.gov/publications.
Wind speeds are the determining factor for operating school buses during hurricanes. Once wind
speeds reach 35–40 mph, the buses are pulled off the routes. The Midway Complex does not
have a diesel generator on-site, but there is a diesel generator located at the Winter Springs
Compound. Seminole received a grant for a diesel generator to provide power for emergency
fueling. This generator provides enough fuel to supply a week’s worth of diesel fuel without
refilling. This is a large diesel generator (Generac 3-phase, 400 kW) sitting on top of a storage
tank, manufactured by Fidelity in Ocala. The generator is served by a 2,877-gallon diesel storage
tank. Since LPG fueling requires electricity, the ability to fuel could be disrupted if power is lost.
Seminole County Schools considered cost-effectiveness when evaluating propane and diesel
school buses. Propane infrastructure would have cost the county schools around $20,000. CNG
infrastructure is much more expensive in terms of capital costs. LPG school buses are more cost-
effective to maintain because they do not require technologies such as exhaust gas recirculation
valves or turbo).
Seminole is exploring other alternative fuel options and is committed to transitioning 75% of
their school bus fleet to propane. Seminole applied for 10 new LPG school buses under the
Diesel Emissions Reduction Act (DERA), which provides about $25,000 per bus. The county has
also applied to participate in the Electric School Bus Project – Initial Phase through the Florida
Diesel Emissions Mitigation Program (DEMP), which utilizes funds from the Volkswagen
Settlement and the U.S. Environmental Protection Agency’s Diesel Emissions Reduction Act
State Grant Program. Seminole has not yet heard results of that application decision. Since our
site visit with Seminole County Schools, the Florida Department of Environmental Protection
has released funding availability ($57 million) for the purchase of electric Type C or Type D
school buses to replace eligible diesel school buses. It is unknown if Seminole will be pursuing
that funding opportunity. Seminole County Schools has explored solar arrays and electric school
buses, but there are many issues to address, including concerns over wattage, charging times, and
backup power options.
City Furniture
The City Furniture fleet facility in Tamarac spans over 1 million square feet. The fleet operates
63 electric forklifts and tugs. City Furniture runs Peterbilt CNG trucks and conducts all
maintenance in-house. The company has had to make a few changes to the maintenance facility
to accommodate CNG vehicles, including lowering lighting and increasing ventilation. The CNG
trucks achieve 7 miles per diesel gallon equivalent, versus 4–5 mpg for similar diesel trucks.

69
This report is available at no cost from the National Renewable Energy Laboratory at www.nrel.gov/publications.
Figure B-5. CNG fleet using time-fill.
Source: Tampa Bay Clean Cities
City Furniture also operates two electric Kalmar Ottawa yard trucks on-site and has three on
order. These battery-electric trucks can operate 12–15 hours before they need to be recharged. It
takes approximately 4 hours to recharge them using a 480-V charger. City Furniture has had
those yard trucks for 2–3 years now without encountering any operational issues.

70
This report is available at no cost from the National Renewable Energy Laboratory at www.nrel.gov/publications.
Figure B-6. City Furniture electric Kalmar Ottawa yard truck.
Source: Tampa Bay Clean Cities
City Furniture started with 150 diesel trucks and began converting its fleet to CNG in 2012–
2013. They used several companies in the past to convert vehicles to CNG. Currently, City
Furniture uses companies in Texas (Net G and Momentum Fuels) to retrofit trucks to CNG. The
company currently operates 207 CNG delivery trucks and has the goal of converting 100% of the
fleet to CNG and electric. All trucks are owned by City Furniture. In their conversion, City
Furniture took advantage of a Florida Natural Gas Rebate previously offered by the FDACS.
CNG vehicles perform better than gasoline and cost less to maintain. Additionally, even with
conversion costs, CNG trucks end up costing $4,000 less than gasoline trucks.
City Furniture has its own employees certified to inspect CNG tanks (required every 36 months
and after each accident 5 mph or higher). The Natural Gas Vehicle Institute (NGVI) provides
CNG training that City Furniture uses to train its staff. However, 80% of NGVI training is basic.
Most CNG training received by City Furniture staff (e.g., drivers, mechanics) comes from on-
the-job training.
The company uses private time-fill CNG fueling on-site that can also be used for fast-filling for a
few vehicles. The CNG fueling station has two ANGI compressors on-site and no fuel storage, as
the vehicles are fueled directly from the compressor. The current natural gas supplier is Center
Ice. City Furniture is extremely happy with the quality of gas they have been receiving (very
clean and dry). They check filters daily. City Furniture handles routine maintenance of the
station/compressors (daily/weekly preventative maintenance) internally and uses an outside
company for larger (more complicated) maintenance items.

71
This report is available at no cost from the National Renewable Energy Laboratory at www.nrel.gov/publications.
Figure B-7. City Furniture CNG station.
Source: Tampa Bay Clean Cities
City Furniture receives some credits for renewable natural gas, though the fuel is sourced in
another state. Renewable natural gas is priced equivalent to CNG.
City Furniture has developed a preparation plan to deal with emergency events and natural
disasters. During hurricane events, standard procedures include staging vehicles against the wall
(to protect from debris and wind), locking everything down, and zip-tying all CNG station
nozzles. All vehicles are stored on-site. The company suspends operation when sustained wind
reaches 35 mph, which is a standard threshold for many fleets. The company uses a hotline and
the City Furniture app to communicate with employees during emergencies.
The company has 2,000 gallons of gasoline stored for its fleet. The company also has a diesel
generator to power the building and a CNG-powered generator to support vehicle fueling, which
can fuel CNG vehicles without power. The City Furniture fleet has never experienced issues with
flooding, as the facility is located outside of major flood zones. As a contingency plan, City
Furniture has an agreement with TruStar to deliver CNG on-site in the event the City Furniture
fueling station is completely down. This scenario, though, is highly unlikely and has never
happened in the past. During Hurricane Irma, the city of Sunrise asked for CNG, and the
company provided CNG fuel for the municipality’s priority fleet vehicles. The request for CNG
fuel was managed through the local EOC.
City Furniture is researching electric delivery trucks and is interested in fleet electrification. City
Furniture representatives have visited several vehicle manufacturers to explore suitable models
for City Furniture. The company has eight Teslas on order to be used as company cars. City

72
This report is available at no cost from the National Renewable Energy Laboratory at www.nrel.gov/publications.
Furniture has enough electric power infrastructure to support EVs and is investigating the
potential of solar energy.
Key areas to address during hurricanes/disasters:
• Planning, communication, and follow-through.
• Redundancies (e.g., City Furniture operates two compressors at the CNG station to
ensure uninterrupted operation).
Figure B-8. City Furniture CNG delivery fleet.
Source: Tampa Bay Clean Cities
Broward County Transit – Paratransit Division
Broward County Transit (BCT) serves Broward County and segments of Palm Beach and
Miami-Dade Counties through coordination with Palm Tran and Miami-Dade Transit.
The BCT Paratransit Division operates 377 vehicles, of which 277 are propane and the
remainder are gasoline-powered. BCT used the company ICOM NA to convert vehicles to
propane. BCT uses several types of LPG vehicles: Ford E-450s (12–18-passenger vehicle), Ford
Transit cutaways, and Ford Tauruses. The Ford E-450 came with the ROUSH LPG system. They
have 41 usable gallons of propane that give an approximate 200-mile range. The newer vehicles
have 65 usable gallons and can provide 300+-mile range. ROUSH did not have an LPG
conversion system for the smaller Ford transit buses. The LPG Ford transit cutaway buses
achieve great mileage (12 mpg). BCT mainly uses bi-fuel propane vehicles (propane and
gasoline). It is not clear if drivers are incentivized enough to run mainly on propane rather than
on gasoline. Gasoline is more expensive than LPG, so running on gasoline would increase

73
This report is available at no cost from the National Renewable Energy Laboratory at www.nrel.gov/publications.
operating costs. BCT is working with ICOM NA (propane converter) to develop a mono-fuel
(LPG-only) system for the buses.
BCT purchases propane from AmeriGas, who also maintains propane fueling infrastructure on-
site. The station has two storage tanks with 1,990 gallons of propane each (3,800 gallons of
propane total). The dispensers are wired to the internet, so it is easy to monitor usage. All
vehicles using the station have fobs that allow for monitoring fuel use. Additionally, those fobs
allow for use with other Broward County fleet propane stations.
Figure B-9. BCT paratransit bus fueling with propane.
Source: Tampa Bay Clean Cities
BCT uses county fueling stations for gasoline vehicles and does not have gasoline fuel storage
on-site.
During previous hurricanes (such as Hurricane Irma in 2018), gasoline and diesel were not
available through the port. However, BCT performed all evacuation using LPG vehicles, since
propane supply was not interrupted. The county has 60,000 gallons of LPG storage.
Additionally, AmeriGas is able to come on-site and “wet-fuel” vehicles if needed. As a result,
BCT had no issues with fuel supply during past hurricanes. During hurricanes, BCT often gets
requests from city agencies to fuel with propane.

74
This report is available at no cost from the National Renewable Energy Laboratory at www.nrel.gov/publications.
Figure B-10. BCT propane paratransit buses.
Source: Tampa Bay Clean Cities
When the county put a bid for propane supply, they put a requirement that the supplier have a
local storage of at least 300,000 gallons of fuel in Broward County. With 600,000 gallons of
LPG storage, AmeriGas meets that requirement easily. Given an important role of BCT for
evacuation and other critical functions, BCT has priority fueling for both gasoline and propane.
A new contract with AmeriGas added three additional LPG stations in the county.
Fuel is typically rationed based on the routes the buses run. Buses get 1/4 1/2, or a full tank of
fuel depending on the route and required range. This system is used for everyday operation. The
BCT propane station allows for filling up the full tank in 6 minutes, accommodated by a larger
pump motor installed.
Broward County is planning to continue expanding its LPG fleet and also plans to replace
community shuttles with propane vehicles.
Paratransit service in Broward County is operated by Transportation America (contractor).
Fixed-route transit service is handled by Broward County internally. BCT maintains the fleet.
There are no issues finding mechanics to work on propane vehicles. ROUSH provided some
initial training with LPG vehicles, but there is not much significant difference compared to
gasoline/diesel vehicles.
ROUSH is also very responsive with any technical issues. BCT had an issue in the past with
buses stalling for no apparent reason. ROUSH helped with finding the problem. The issue turned
out to be related to an electric system rather than fuel (LPG). BCT also worked with ROUSH to
design a bleeding system used to empty the tanks when maintenance on the vehicles is

75
This report is available at no cost from the National Renewable Energy Laboratory at www.nrel.gov/publications.
performed. As result, LPG is not vented from the vehicle but rather collected into an external
tank, resulting in cost savings for the agency.
Figure B-11. BCT propane fueling facility.
Source: Tampa Bay Clean Cities
There was an instance when one of the LPG buses caught on fire caused by vehicle electrical
issues. Since the bus was propane, the city fire department did not know how to handle it. They
decided not to put out the fire and let the bus burn to the ground. BCT propane buses had been
involved in several severe accidents, but none of them caused fuel leaks.
The biggest issue with LPG infrastructure is compliance with local ordinances and zoning rules.
This is especially relevant for larger-capacity fueling sites. For example, the city of Deerfield
only permitted for the installation of one propane fueling station.
Broward County Schools runs approximately 200 buses on propane, so the market for propane in
the county is healthy and growing. Additionally, BCT is talking to AmeriGas about getting
renewable propane. BCT fixed-route service runs some battery-electric buses (Proterra), but
paratransit service does not. For paratransit service, it is possible to use light-duty EV sedans,
since not all paratransit vehicles need wheelchairs.
One obstacle for electrification is the need for EV charging infrastructure, which is expensive.
Additionally, paratransit service is contracted out with a 5-year contract. That time period may
not be enough for the contractor to recoup the investment in infrastructure. This will be
challenging to do given a 5-year planning horizon, and the contract may need to be extended
beyond 5 years.
Lessons learned from LPG implementation:
76
This report is available at no cost from the National Renewable Energy Laboratory at www.nrel.gov/publications.
• Ensure to carefully plan and prepare for alternative fuels to mitigate surprises. The
Propane Education and Resource Council (PERC) was a great resource for BCT. BCT
saves approximately $8.5 million in fuel cost over 5 years with LPG compared to
gasoline.
• Account for a range of vehicles. Broward County is primarily urban, which affects duty
cycle and fuel usage (fuel usage needed to be estimated while running a bid for
AmeriGas).
• The partnership with the fuel provider is very important.
• BCT did not use a lock-in fuel rate. The price of propane is low enough to do so, but at
market/sport price. BCT uses a fixed per-gallon administrative cost on top of the regular
price. BCT currently pays $1.5 per gallon of propane.
During past hurricanes, BCT received a request from only one fleet to share LPG. Usually BCT
does not advertise that they have propane. In an emergency, fuel availability and sharing is
typically handled by the EOC, so requests for fuel would usually come through the EOC. Since
Broward County Schools also runs propane buses, BCT can combine efforts with them in
emergency situations.
Procedures before the hurricane include topping-off all vehicles with fuel and parking vehicles
on the property in a pattern that allows for protecting newer vehicles from being damaged by
debris (newer vehicles are parked in the middle, surrounded by older ones). BCT also has a local
call-in number for AmeriGas and local support, which is very handy in emergencies. BCT
paratransit facility has a diesel generator on-site that is enough to support the building and
fueling operations. The BCT fleet did not experienced any problems with standing water.
The BCT paratransit division does not stage buses in different locations before a hurricane. All
paratransit buses are stationed at the facility during hurricanes. BCT gets great support from
AmeriGas in terms of fueling infrastructure. AmeriGas is located 10 minutes away from the BCT
facility and can dispatch techs very fast to troubleshoot problems with the station.
Transportation America (operator of paratransit service) uses an interactive voice response (IVR)
system to communicate with employees during emergencies (automated robocalls). Broward
County uses a similar system to communicate with its employees.
Jacksonville Transportation Authority
The Jacksonville Transportation Authority (JTA) provides public transit service to the city of
Jacksonville, Florida. JTA began converting its fleet to CNG buses in 2015, citing environmental
benefits as the primary reason for converting to the alternative fuel. This justification is also
spurring the agency’s exploration into electric transportation. The agency is also exploring the
potential use of renewable natural gas, which is not yet available in the Jacksonville area.
In 2013, JTA commissioned the Alternative Fuel Study to identify alternatives to diesel that
would reduce emissions and be cost-effective. That study recommended CNG as the most
promising option. JTA also made the decision to use CNG buses for its bus rapid transit (BRT)
system (called First Coast Flyer), which launched in late 2015.

77
This report is available at no cost from the National Renewable Energy Laboratory at www.nrel.gov/publications.
JTA currently runs 118 CNG buses, 71 diesel buses, 7 hybrids and 3 Gillig battery-electric buses
(BEBs). The agency is also planning to acquire additional CNG buses and a CNG tow truck.
The agency is installing two ChargePoint depot chargers (four outlets) that can charge BEBs in 3
hours.
Figure B-12. JTA battery-electric bus.
Source: Tampa Bay Clean Cities
JTA has two CNG stations on property, one private and one public. Stations are built and
operated by Clean Energy through a public-private partnership. JTA entered into a fuel purchase
agreement with Clean Energy, which specifies that JTA would convert an average of 20 buses
per year for 5 years, for a total of 100 buses. The agency has always exceeded the minimum
number of CNG buses stipulated in the agreement. The existing CNG stations can accommodate
a fleet of 150 CNG buses, with some limited capacity for additional buses. Clean Energy
committed to construct and operate CNG fueling stations for a period of 15 years. The station
was constructed in 12 months and was completed at the end of 2015. JTA received a $2.7-
million Transportation Regional Incentive Program (TRIP) grant from FDOT to construct the
station. One of the provisions of that grant required JTA to make the CNG station open to the
public. As a result, Clean Energy essentially constructed two stations: one public and one
private.

78
This report is available at no cost from the National Renewable Energy Laboratory at www.nrel.gov/publications.
Figure B-13. JTA CNG fueling station.
Source: Tampa Bay Clean Cities
JTA does not store CNG on-site; therefore, fuel supply interruption can cause disruptions,
though this has not happened yet. The agency has large storage of both diesel fuel and gasoline
on-site (275,000 gallons of diesel).
Figure B-14. JTA on-site diesel fuel storage.
Source: Tampa Bay Clean Cities

79
This report is available at no cost from the National Renewable Energy Laboratory at www.nrel.gov/publications.
Many years ago, the CNG station had problems that caused it to be down, raising concerns of
reliability. The station has four compressors and can handle one or two of the compressors being
down for maintenance or repairs.
While there are plenty of sources for CNG training, there is a lack of robust training for
maintenance people to handle BEBs. Original equipment manufacturers may provide some
assistance with training, but not much. Gillig provides some training for BEBs, but it is very
basic. JTA is looking to find a way to maintain batteries longer, given the high cost of battery
replacement.
JTA’s current BEBs have 169 miles of range. The agency plans to continue expanding its BEB
fleet. In order to install EV chargers for the two buses, JTA had to do electrical upgrades,
including adding a transformer. One of the challenges with using BEBs is long routes. JTA
covers the entire Duval County, which is a large geographical area. The range of BEBs may not
be suitable for all routes.
Figure B-15. Electric bus charging station installation.
Source: Tampa Bay Clean Cities
JTA considered using propane for its Connection fleet (JTA’s paratransit service), though this
turned out to not be cost-effective.
One of JTA’s electric buses encountered standing water in operation. When the bus went through
standing water, a leak in the wheel well was discovered. Standing water did not cause any issues
for electrical components of the bus. The battery is located on top of the bus and was unaffected.
The general rule of thumb given to drivers about standing water is: “if you can’t see the road,
don’t go.”
80
This report is available at no cost from the National Renewable Energy Laboratory at www.nrel.gov/publications.
One BEB had a balancing problem when charging (would not charge above 80%). The
manufacturer (Gillig) addressed this issue with the battery (under warranty).
JTA has outfitted their maintenance shop with fall protection to service the vehicle battery
located on top of the bus.
JTA also has five techs trained as CNG tank inspectors. Tanks need to be inspected after every
accident of 5 mph or higher, regardless of where the impact was. It is expensive to invite outside
inspectors, and they may not come on short notice. JTA decided to invest in its own tank
inspectors.
The public CNG station is available to other fleets and accepts credit cards. Refuse haulers and
medium-duty city fleets fuel there. The JTA facility has a 300-kW diesel generator that can be
used to power the facility (and support fueling) during power interruptions. Additionally, the
Clean Energy CNG station has its own 1,200-kW diesel generator. JTA will have to install
another generator for EV fueling in case of power interruption. The existing 300-kW generator
can only be used for diesel fueling and will not be enough to charge BEBs.
JTA does not store CNG on-site, but instead fills buses directly from the compressor. The fueling
system and bus-mounted tanks are monitored for gas leaks (color-coded gas leak system). There
was one instance when a CNG bus rolled over and all eight roof-mounted CNG tanks were
damaged and vented natural gas. Other than this accident, JTA has never had any serious gas
leaks at the facility.
The biggest issue with CNG is the requirement to inspect CNG tanks after every accident at or
above 5 mph. JTA expects this requirement to be lifted at some point. 5 mph is really not that
much, and there is no need to inspect the tanks if the area of impact did not involve parts of the
bus where tanks are located.
JTA has never experienced issues with fuel deliveries or fuel shortages. Petroleum fuel (diesel
and gasoline) comes from the Port of Jacksonville. JTA has developed a set of procedures to
manage emergencies, including natural disasters. These procedures include accounting for the
amount of fuel on hand, fueling all vehicles in preparation for hurricanes, and stationing buses in
different locations on high ground (JTA has three locations). All these measures are implemented
to make sure buses are available to provide service, evacuation, and emergency response.
In addition to supporting its own fleet, JTA also serves as a backup fuel storage for the city of
Jacksonville. The agency goes into lockdown before a hurricane hits. Operations are suspended
when sustained winds reach 35 mph. JTA uses several locations around the city to stage buses
(e.g., Northdale facility is the secondary staging site).
The EOC coordinates fuel sharing during emergencies. JTA communicates its fuel availability to
EOC during disasters. If other government fleets (e.g., fire department, police) need fuel, they
will reach out to the EOC, who will direct them to go to JTA to fuel. Fuel availability during
emergencies is communicated through a web-based application “WebEOC.” JTA also runs
regular evacuation drills with the city of Jacksonville.
Lessons learned from previous hurricane events:
81
This report is available at no cost from the National Renewable Energy Laboratory at www.nrel.gov/publications.
• JTA should have staged bus recall procedures. When operations were suspended at 35
mph, all buses were instructed to return back to the facility. As a result, 200 buses were
waiting for vault to deposit fareboxes.
• JTA has a robust remote work capability that worked really well during previous
hurricane events.
• Use satellite phones to communicate during emergencies. The phones have wireless
priority service (available for government agencies), which allows for pushing the caller
to the front of the line when all circuits are busy. This worked very well during
emergencies.
• JTA has never had issues with fuel deliveries coming through the Port of Jacksonville.
The port operates in a similar way as JTA.
• JTA is independent of Colonial Pipeline, so JTA’s fuel deliveries were not impacted by
the recent Colonial Pipeline interruptions.
• During previous power interruptions, it was discovered that one building on the property
and one rear gate on the facility were not wired to the generator, so the gate becomes
inoperable if central power is out. Other than that, the facility is rather resilient to power
interruptions. In fact, the bus facility is wired to two utility blocks (if one loses power,
only part of campus loses power).
Advice to other agencies:
1. Give enough time to prepare for last-minute issues before a hurricane. Have a plan.
2. Implement previously developed plans.
JTA coordinates with the city and county to update evacuation plans regularly. JTA is the lead
agency for the city of Jacksonville transportation evacuation. The agency sends a copy of
updated emergency plans to the city. During emergencies, JTA uses two-way communication
apps to communicate with the public and employees. They use this app to blast public
notifications during emergencies and also have an employee hotline.

82
This report is available at no cost from the National Renewable Energy Laboratory at www.nrel.gov/publications.
Appendix C. Alternative Fuel Vendors
Last Name First Name Title Organization Fuel Type E-mail Location Phone Cell
Magwood John
American
Homegrown
Fuel Corporation
Hydrogen,
biofuels
john@fcbio.com
Rifenbary Jared American
Natural Gas
CNG
jrifenbary@america
nnaturalgas.com
Westberg Joe AmeriGas Propane
joseph.westberg@
AmeriGas.com
Jacksonville,
FL
904-652-6132
Franscell Lance S
ales Manager AmeriGas
Propane
Propane
lance.franscell@A
meriGas.com
Tampa, FL
33610
813-210-4763
Wheeler Joe Senior Account
Manager
AmeriGas/Herita
ge Propane
Propane
joe.wheeler@Ameri
Gas.com
Tampa, FL
33610
813-626-9111 727-423-6424
Josephs Ste
ve Co-Founder,
Director of
Engineering
ampCNG Natural gas
sjosephs@ampCN
G.com
Chicago, IL
60607
630-235-9841
Johnson Jeremiah Dir of Agriculture/Alt
Energy Programs
Be-Ev.Com EVSE
infrastructure
jeremiah64@gmail.
com
727-463-0020
De Antonio Jose C
EO BioDiesel Las
Americas
(BDLA)
Biodiesel
production
jdeantonio@bdlaus.
com
Miami, FL 305-851-6974 954-980-9538
Ballestero Carlos Commercial &
Procurement
Manager
BioDiesel Las
Americas
(BDLA)
Biodiesel
production
cballestero@bdlaus
.com
Miami, FL 305-851-6974 954-512-7587
Noicely Adr
ianne Executive Sales
Manager
Blink EVSE
infrastructure
Anoicely@BlinkCha
rging.com
Miami, FL 305-521-0200
ext. 200
305-720-0958
Cox Brandon NE Florida Business
Development
Manager
Blossman Gas Propane
bcox@blossmanga
s.com
Jacksonville,
FL 32219
336-963-3939
Giabaldi Mik
e Sales Manager Brickell Energy EVSE
infrastructure
mgibaldi@brickelle
nergy.com
Miami, FL 305-389-4615

83
This report is available at no cost from the National Renewable Energy Laboratory at www.nrel.gov/publications.
Last Name First Name Title Organization Fuel Type E-mail Location Phone Cell
Rothe Jeff Sales Director,
Florida
ChargePoint,
Inc.
EVSE
infrastructure
jeff.rothe@chargep
oint.com
954-644-2944
Dunn David
Facilities
Management
City of Orlando Electric
DAVID.DUNN@orl
ando.gov
Orlando, FL
32802
407-246-3873 321-231-2904
Clean Energy
Customer Service
Clean Energy
CNG Station
Orlando Airport
CNG Orlando, FL
32827
866-809-4869
Torlai Eme A
ccount Manager Clean Energy
Fuels
Natural gas
eme.torlai@cleane
nergyfuels.com
Dallas, TX
75225
214-572-6591 972-750-6850
Carlos Andres National Account
Manager
Clean Energy
Fuels
Natural gas
andres.carlos@clea
nenergyfuels.com
562-370-6695
Moore Sher
ika Business
Development
Manager
Clean Energy
Fuels
Natural gas
sherika.moore@cle
anenergyfuels.com
603-724-6648 404-230-4043
Langille Brian Interim Director
Clearwater Gas
System
Natural gas
brian.langille@clear
watergas.com
Clearwater, FL
33755
727-562-4911
Tindal Ch
ris Assistant Director Commercial
Aviation AF
Initiative
(CAAFI)
Aviation fuel
tindal.caafi.ad@gm
ail.com
Meyer Matt Sales & Business
Development
Dannar Off-road
EV/mobile
power station
mmeyer@dannar.u
s.com
Muncie, IN 574-329-9768
Magalhães Ri
cardo Sales US and
Canada
Efacec USA EVSE
infrastructure
ricardo.magalhaes
@efacec.com
(+351) 933
030 928
Araujo Ricardo
Sales Manager for
Europe and North
America
Efacec USA
EVSE
infrastructure
ricardo.araujo@efa
cec.com
(+351) 912
302 671
Sousa Iv
an Director of Sales Efacec USA EVSE
infrastructure
ivan.sousa@efacec
.com
(+351) 932
790 032

84
This report is available at no cost from the National Renewable Energy Laboratory at www.nrel.gov/publications.
Last Name First Name Title Organization Fuel Type E-mail Location Phone Cell
Shapiro Ben Business
Development
Manager
Endera EVSE
infrastructure
ben@enderacorp.c
om
307-776-9400
Dodd David Account Manager Ferrell Gas -
Pinellas Park
Service Center
Propane
daviddodd@ferrellg
as.com
Pinellas Park,
FL 33782
727-544-1416
Glander Richard Operations
Supervisor
Ferrell Gas -
Pinellas Park
Service Center
Propane
richardglander@fer
rellgas.com
Pinellas Park,
FL 33782
727-544-1416
Wike Andy P
resident Fleetwing
Corporation
Biodiesel,
ethanol
andywike@fleetwin
goil.com
Lakeland, FL
33802
863-665-7557
Moyer Elda Account Executive Florida City Gas CNG
Elda.Moyer@nexter
aenergy.com
Doral, FL 786-459-3814
Bowers Bet
h
Electric Vehicle
Specialist
Florida Power &
Light Company
Electric
beth.bowers@fpl.co
m
Juno Beach,
FL 33408
561-304-5670 561-262-6656
Earley Patti Fleet Fuel
Operations
Specialist
Florida Power &
Light Company
Electric
patti.earl[email protected]o
m
561-904-3222
Thompson Mark B
usiness
Development
Manager
Florida Public
Utilities
Natural gas,
propane,
electric
mthompson@fpuc.
com
DeBary, FL
32713
386-747-6553
McGoldrick Bill Key Accounts
Manager
Florida Public
Utilities
Natural gas,
propane,
electric
bmcgoldrick@fpuc.
com
West Palm
Beach, FL
33409
561-202-5131
Ricre Romer
o
Florida Public
Utilities
Electric, CNG
rsicre@fpuc.com
Fernandina
Beach, FL
Erik GAIN Clean
Fuel
CNG Kissimmee,
FL 34758
800-438-7912
Hoover Buz
z Gate Petroleum Ethanol, CNG,
electric
brhoover@gatepetr
o.com
Jacksonville,
FL
904-448-2922
Glover Oil Biodiesel 20
Melbourne, FL
32901
321-723-3953

85
This report is available at no cost from the National Renewable Energy Laboratory at www.nrel.gov/publications.
Last Name First Name Title Organization Fuel Type E-mail Location Phone Cell
Swarthout Cindy GoSpace EVSE
infrastructure
cswarthout@gospa
cego.com
Henderson Rock GoSpace
EVSE
infrastructure
rhenderson@gospa
cego.com
813-421-5121 813-843-8430
Mills Andr
ea District General
Manager
Heritage
Propane
Propane
andrea.mills@Amer
iGas.com
Tampa, FL
33610
813-626-9111
Traversa Xan Jacksonville
Transportation
Authority
CNG
atraversa@jtafla.co
m
Jacksonville,
FL
904-632-5501
McKee Dav
e Electrification
Program Manager
JEA Electric
mckewd2@jea.com
Jacksonville,
FL 32202
904-665-4336
Clemmons Cynthia Manager of
Legislative &
Regulatory
Relations
Lakeland
Electric
Electric Cindy.Clemmons
@LakelandElectri
c.com
863-834-6595 863-430-1368
Davis Spe
ncer NASA Traffic
Management
Specialist
NASA/KSC Electric/B20/
E85/hydrogen
spencer.c.davis@n
asa.gov
Kennedy
Space Center,
FL 32899
321-861-1633 321-289-7268
Locke Jack President & Chief
Operating Officer
Nopetro Natural gas
jlocke@nopetro.co
m
Coral Gables,
FL 33134
305-775-9647
No
Petro CNG
(LYNX)
CNG Orlando, FL
34804
Ovitt David General Manager Northside
Propane Inc.
Propane
dave@northsidepro
pane.com
Lutz, FL
33549
813-949-4286
McDevitt Jody S
ales Director NovaCharge EVSE
infrastructure
jody@novacharge.
net
Rigsby Will NovaCharge Electric
willrigsby@novacha
rge.net
Oldsmar 404-229-3603
Paul Luis Mana
ging Director OBE Power
Networks
EVSE
infrastructure
lpaulk@otepi.com
Miami, FL 832-260-1384
Burgana Alejandro Managing Director
OBE Power
Networks
EVSE
infrastructure
aburgana@brickell
energy.com
Miami, FL 305-546-5407

86
This report is available at no cost from the National Renewable Energy Laboratory at www.nrel.gov/publications.
Last Name First Name Title Organization Fuel Type E-mail Location Phone Cell
Caceres Christin Sustainability
Business Support
Specialist
Orlando Utilities
Commission
Electric
ccaceres@ouc.com
Orlando, FL
32802
407-434-2859
Westlake Peter Manager, New
Products and
Solutions
OUC Electric
pwestlake@ouc.co
m
Orlando, FL
32801
407-434-2036 407-417-7646
Dennis Bre
tt Palatka Gas CNG
bdennis@palatkaga
s.com
386-983-4267
Guerrero Richard Equipment Sales &
Service Manager
Pioneer Critical
Power
Generators/
mobile
rguerrero@pioneer
criticalpower.com
Miami, FL 305-599-2045 305-764-4905
Bradley Sco
tt Director of Sales Pioneer Power
Mobility
Mobile EVSE/
propane
Scott@Pioneer-
eMobility.com
Champlin, MN 617-337-3537
Kuenzli Eric Pivotal LNG LNG
ckuenzli@pivotallng
.com
Carroll Br
ian Fleet Manager Port Canaveral Electric/LNG
bcarroll@portcanav
eral.com
Cape
Canaveral
321-783-7831
x 285
Pearson Amber Director of
Marketing
Protec Fuel
Management
LLC
Ethanol
amber@protecfuel.
com
Boca Raton,
FL 33487
573-268-6853
Kaiyalethe Da
vid Marketing Manager Protec Fuel
Management
LLC
Ethanol
david@protecfuel.c
om
Boca Raton,
FL 33487
561-392-3667
Linn Jason Marketing Director Rack Electric EVSE
infrastructure
creative@rackelectr
ic.com
Boca Raton,
FL
561-391-3550
Ka
yla Ross Plumbing CNG Leesburg, Fl
34748
352-728-6053
Nordsiek Jeff St. Johns
County
CNG
jnordsiek@sicfl.us
904-209-0283
McAllister Ala
n Regional Account
Representative
Suburban
Propane
Propane
amcallister@suburb
anpropane.com
Tampa, FL
33610
352-303-4505
Cole David Suburban
Propane
Propane
dcole@suburbanpr
opane.com

87
This report is available at no cost from the National Renewable Energy Laboratory at www.nrel.gov/publications.
Last Name First Name Title Organization Fuel Type E-mail Location Phone Cell
Fernald Donald President Superior Energy
Systems
Propane
infrastructure
donald@superiornr
g.com
Columbia
Station, OH
44028
440-236-6009
Cozma Samy Biofuels Analyst Targray Biodiesel,
ethanol
scozma@targray.c
om
Kirkland,
Quebec
514-695-8095 438-889-0551
Hernandez Ken
neth Program Manager,
Alt Fuel Vehicles
TECO Energy Electric
kxhernandez@teco
energy.com
Tampa, FL
33602
813-228-1392
Cervantes Horacio TECO Peoples
Gas
CNG
hcervantes@tecoe
nergy.com
Tampa, FL
33602
Bahadue Geor
ge Market Lead,
Charging
Infrastructure
Tesla Electric
gbahadue@tesla.c
om
Palo Alto, CA
94304
703-992-3698
Bolger Shaun Senior Category
Manager - Fuel
Pricing
Thorntons Inc. Ethanol
shaun.bolger@myt
horntons.com
502-572-1562 502-727-7886
Duley Hand
lin Senior Category
Manager - Retail
Fuel
Thorntons Inc. Ethanol
handlin.duley@thor
ntonsinc.com
Louisville, KY
Flynn Anthony Southeast Sales
Director
TruStar Energy Natural gas
aflynn@trustarener
gy.com
Rancho
Cucamonga,
CA 91730
678-215-2762
Watson
Co
lon
Yara UCF Office of
Sustainability
University of
Central Florida
Electric/
propane
Yara.Watson@ucf.
edu
Orlando, 407-823-3353
Butler Brian President VISTRA Electric, natural
gas
brian@consultvistra
.com
Tampa, FL
33613
813-961-1077
Chadbourne Har
land
Director of
Purchasing
Waste Pro CNG
hchadbourne@w
asteprousa.com
2101 West SR
434
Longwood, FL
32779
407-937-2663 305-506-7911
Withlacoochee
Electric
Cooperative
Electric Dade City, FL

88
This report is available at no cost from the National Renewable Energy Laboratory at www.nrel.gov/publications.
Appendix D. MCDA Algorithm for Potential New Fuel
Station Identification

89
This report is available at no cost from the National Renewable Energy Laboratory at www.nrel.gov/publications.
Appendix E. Workflow for Future EVSE Needs
Mapping
90
This report is available at no cost from the National Renewable Energy Laboratory at www.nrel.gov/publications.
Appendix F: Literature Review for Vehicles in
Standing Water
Background and Purpose
The purpose of this literature review is to inform Task 5 of the Florida Statewide Alternative
Fuel Resilience Plan Funding Opportunity Announcement (FOA) project. Specifically, this
literature review assesses information on vehicles and their ability to withstand hurricanes,
standing water, and flooding. Critical transportation vehicles such as first-responder fleets, as
well as AFV technologies, are focus areas of the literature review. It is important to understand
the limitations of vehicles in these scenarios and potential modifications that could be made to
improve their durability in order to recommend which vehicles should be added to a fleet for use
in emergency response situations.
The literature review was the first step in our standing water assessment (Section 9). It serves as
a background for virtual site visits (due to COVID-19) by a mechanic from NREL to fleets that
have had a variety of vehicles deal with flooding issues.
Vehicle Water Damage
This section explores a variety of issues related to vehicles and flooding, including how to help
prevent vehicle damage during a hurricane or flood, as well as common vehicle damage and how
to assess and repair it.
Preventing Water Damage
When a hurricane or flooding event is imminent, there are things that vehicle and fleet owners
can do proactively to attempt to prevent or minimize damage to their vehicles. According to an
article in Economical Insurance (Fereiro 2018), there are a handful of actions that can be taken:
• Move vehicles to higher ground. As floodwaters accumulate in low-lying areas first,
move and park vehicles on top of a hill or on the top level of an aboveground parking
structure. Also ensure vehicles are away from trees or other objects that may damage
them during a storm.
• Close all windows and doors. Ensure all openings are sealed to prevent water from
getting inside the vehicle during rainfall or rising floodwaters.
• Consider disconnecting the battery. If floodwaters are expected to reach the vehicle,
consider disconnecting the battery to prevent electrical shorts and damage to the
computer and electronic equipment.
If a vehicle is being driven during a hurricane or flooding event, drivers should be careful not to
drive through large puddles or standing water. In many cases, water is deeper than it appears and
can therefore get into the vehicle’s engine (more detail in the subsequent Engine and
Transmission section). Even a small amount of water in an engine can cause irreparable damage.
Furthermore, according to the National Weather Service, 12 inches of water can carry away most
passenger vehicles, and 2 feet of water can sweep away SUVs and trucks (National Weather
Service 2020).
91
This report is available at no cost from the National Renewable Energy Laboratory at www.nrel.gov/publications.
Common Vehicle Damage and How To Assess and Repair It
When a vehicle is involved in a hurricane or flooding event, there are many common issues that
could occur. According to an article in Your Mechanic (Unrau 2016), it is common for metal
surfaces to rust prematurely and for nuts and bolts to seize. In addition, water damage can occur
inside the airbag, as the module and other connectors for the airbag controls are often located
under the seats of the vehicle.
Other common areas for damage with flooded vehicles are outlined in an article in the National
Automotive Parts Association Know How Blog (Jerew 2020), including water in the brake fluid,
power steering, and coolant reservoirs. If water enters the brake fluid, it can cause it to evaporate,
leading to a loss of braking power. In addition, brake pads and shoes can rust and spread the rust
to rotors and drums. Therefore, it is important to dry a flooded vehicle thoroughly and work
immediately to remove rust from a vehicle as soon as it is identified.
Assessing and Repairing Common Damage
According to an article in U.S. News & World Report (Trop 2019), the first thing to do after a
vehicle is involved in a flood or standing water (once it is safe to do so) is to evaluate how high
the floodwaters came on the vehicle. Look at the depth of the water or for evidence of a water
line by mud and debris. Water that didn’t rise above the bottom of the doors is unlikely to have
caused any significant damage. Water any higher than that could lead to significant damage or
even a totaled vehicle. As soon as it is safe to do so, start drying out the vehicle completely to
minimize damage and rust. Also pay attention to whether the water was fresh or salt water, as
salt water is much more corrosive and damaging than fresh water and is more likely to lead to a
totaled vehicle.
According to Unrau (2016), there are several next steps to take to assess initial damage from
flooding. First, check any controls that were submerged and ensure the emergency brake is
operational and that the pedals move when pressed. Also check that any manual (non-electric)
seat adjustments work properly and that the fuel tank, truck, and hood releases work.
Because water can enter brake and power steering fluids, Jerew suggests flushing the brake and
power steering systems and potentially draining the fuel tank to eliminate water contamination
(depending on the level of flooding). According to Jerew (2020), repairing flood damage is an
uncertain venture, and drying out the vehicle as quickly as possible will increase the chances of
being able to salvage it. However, according to an article in Advance Auto Parts (Jensen 2019),
in the worst-case scenario, flood damage can be beyond the repair of even the most skilled
mechanic. This is partially because modern vehicles have so many electronics (further discussed
in the subsequent Electrical Components section) that are not designed to get wet. Jensen also
echoed that the higher the level of the water, and especially if it is salt water, the harder it will be
to repair the vehicle and the higher the likelihood of totaling. If a vehicle is repairable, it is likely
that there could be hundreds of failure points over the next several years in delayed flood damage
and that the car will likely never drive the same again.
An example of a fleet assessing vehicle damage after a flooding event is described in an article in
Government Fleet (Force 2005). Dan Croft, Fleet Management Director for Collier County,
Florida, indicates that after a hurricane has passed, a garage is set up for hood checks for all
92
This report is available at no cost from the National Renewable Energy Laboratory at www.nrel.gov/publications.
operating vehicles. Four employees are used to check the tires, fluid levels, and lights. Vehicles
that are used for extended period are given new oil and windshield wiper fluid.
Engine and Transmission
Common Damage
According to an article in The News & Observer (Stradling 2018), vehicle owners should not
start the engine of a flooded vehicle until it has been fully examined to ensure there is no water
in the engine. If water is in the engine or transmission, starting it can do serious damage.
According to an article in It Still Runs (Scott 2020), water in an engine can cause not only rust,
but also damage to the cylinders if there is water in the engine when it is started. If the cylinders
are full of water, the water will not be compressed like air is, and therefore everything connected
to the cylinders will bend or break. This phenomenon is called “hydrolocking” and will ruin an
engine instantly (Jensen 2019). In addition, water mixed with the transmission fluid or oil will
reduce the lubricating qualities, resulting in damage.
Stradling states that even driving through 6 inches of water in a vehicle with limited clearance
could allow water to get into the engine. If in doubt, an experienced mechanic should examine
the engine (Stradling 2018).
Assessing and Repairing Damage
According to State Farm (2020), the first way to check the engine for water is to check the oil
dipstick. On the dipstick, look for water droplets, which likely indicate that there is water in the
engine. If water is found, remove the water-damaged cylinders and check for corroded spots.
Next, check the fuel tank and line, using a siphon pump to remove some of the fuel to see if
water is present. If there is water in the fuel, empty the fuel tank completely.
Jerew (2020) states that the oil level should also be checked. If the oil level seems abnormally
high, it is indicative that water likely got into the crankcase (because oil floats on water). The
next step is to remove the spark plugs and turn the engine over by hand to get the water out of
the cylinders, drain the oil, and replace the oil filter.
Regarding the transmission, Jensen states that it is typically more sensitive to water damage than
an engine. To assess and repair it, first change the transmission fluid and filter and monitor it for
unusual behavior. Jerew indicates that automatic transmission discs and bands can delaminate in
water, and manual transmission synchronizers can be ruined with lack of lubrication. Also
change the axle differential fluid either by removing the differential cover or drain bolt or using a
fluid pump (Jerew 2020). Jensen (2019) also suggests checking the engine air filter and intake
ducting.
Finally, State Farm (2020) suggests changing the oil and transmission fluid right away and doing
it again after the car is in good condition and it has been driven for several hundred miles.
93
This report is available at no cost from the National Renewable Energy Laboratory at www.nrel.gov/publications.
Electrical Components
Common Damage
According to Stradling (2018), vehicle owners want to know whether the air bags, electronics,
and computers were exposed to water, as water exposure to those components will cause damage
in the future. Newer vehicles have up to 60 different computer processors in them, and if you
submerge a computer in water, it is likely that it will not work the same again. A flooded vehicle
may run at first but will likely develop problems later, which can in turn cause vehicle functions
to fail. Stradling also echoed earlier statements that the higher the water on the vehicle, the more
electronics and parts of the vehicle will be affected.
According to Scott (2020), the electrical system in a vehicle is the part of the car that typically
sustains the worst damage from flooding. Scott indicates that electrical damage can take months
to appear and can be extremely expensive to repair. Because the electrical and computer system
can be thought of as the brain of the car, damage affects a multitude of aspects including electric
seat controls, windows, door locks, starter, headlights, anti-lock brakes, airbags, and horn, to
name a few.
Assessing and Repairing Damage
There are a few ways to assess initial damage to the electrical systems in a vehicle, according to
Jensen (2019). As previously stated, before turning on the engine to assess, make sure the engine
is dried out and safe to start. Turn on the heat and smell for a burning smell that would suggest
damaged wires. Also feel the wires under the dashboard and in the engine for brittleness. Listen
to the sound system to see if it is not working or sounds bad, which could be signs of water
damage (Jensen 2019). In addition, Unrau (2016) suggests checking the dashboard indicators by
starting the car and checking for any warning lights or new indicators. In addition, check power
windows and door locks. When checking power seat controls, check not only that they work but
also that they move the seat in the right direction when the button is pressed.
Interior Considerations
Assessing and Repairing Damage
Unrau (2016) states that the interior of a vehicle that has been flooded can develop mold,
mildew, and odors from saturated carpet and upholstery. To help prevent this from happening,
remove excess water from the vehicle and remove and dry any loose objects. Also hang floor
mats and other parts that can be removed to dry. Next, take out the console, seats, and carpets if
there was standing water in the vehicle to prevent rust. Finally, wash the carpeting and mats and
remove dirt and silt from the interior of the vehicle before replacing all interior items. Replace
items with new parts as needed.
Case Study: Virginia Beach Fire and Rescue
David Wade from the Virginia Beach Fire and Rescue Department (VBFD) wrote a report in
2010 about VBFD’s experience with flooding and the damage caused to their fire trucks (Wade
2010). This report is especially relevant because fire trucks are important first responders during
natural disasters, and the lessons learned can be transferred to multiple fleets of heavy-duty
diesel vehicles. This section provides a summary of their findings.
94
This report is available at no cost from the National Renewable Energy Laboratory at www.nrel.gov/publications.
During several severe weather events around 2009, VBFD responded to calls for service, as it is
the duty of the fire department to do so despite weather conditions. During these situations,
drivers encountered flooded roadways, which in turn led to VBFD trucks being damaged, some
extensively, from being operated on flooded roadways.
Following these events, the department evaluated the damage, cost of repairs, and need for driver
education and outlined their findings in a report. They also conducted outreach to national,
regional, and local department leaders requesting information on similar problems with flooding
and possible solutions. Apparatus manufacturers and private industry were also contacted for
information and recommendations. They concluded that flooding is not common, and that many
organizations do not know how to address flooding events.
Equipment Used and Damage Found
VBFD uses several different manufacturers of diesel fire trucks in their fleet: Pierce (primary),
American LaFrance, and Boardman. Damage from driving the equipment through flooded
roadways was found to be extensive, including:
• Wheel hubs filled with water and had to be serviced, including replacing the seals.
• Brakes were affected by the rapid heating and cooling and had to be replaced before their
normal service times.
• Air horns were damaged from water entering their inner working parts.
• Transmissions, rear-end differentials, and pump transfer cases had to be checked,
drained, flushed, and refilled with the proper fluids.
While these issues were able to be fixed relatively easily, the following issues were much more
serious and costly:
1. Water entered the air intake on the engine of one of the vehicles, and the engine stopped
working immediately in the field.
2. Damage to hydraulic lines and the front bumper from driving over unseen objects
underwater.
3. Damage to the electrical components. The location of the electrical box allowed it to be
submerged in the floodwaters, which caused systems on the truck to stop working that
could have ultimately threatened the safety of the first responders in the vehicle.
The air intake for the engine is below and behind the bumper, allowing water to enter the engine
and cause major damage, voiding the manufacturer’s warranty. VBFD was ultimately able to
negotiate the continuance of the warranty but did have to agree to have the engine torn down at a
higher cost to allow for water damage to be accurately assessed. It was found during this process
that the apparatus systems did their job successfully and shut down the engine before serious
damage occurred.
Potential Vehicle Modifications To Avoid Damage
Through VBFD’s research, they came across San Antonio Texas’ fire department, who
encountered similar issues with water entering the air intake and damage to the electrical box on
their Pierce Manufacturing fire trucks. San Antonio worked with Pierce to minimize the risk of
these issues happening during future flooding events. They moved the air intake to the side of the
truck over the passenger side front wheel and moved the electrical box into a compartment of
95
This report is available at no cost from the National Renewable Energy Laboratory at www.nrel.gov/publications.
choice. These modifications can be done by the manufacturer or done aftermarket via a retrofit
kit.
Driver Training
VBFD found that lack of driver training and direction from the department on driving through
floodwaters was a contributor to vehicle damage. Young drivers with no flood experience made
poor decisions and drove the vehicle directly into the scene through floodwaters rather than walk
in and check the situation first, leaving the truck on higher ground. Vehicle drivers were not
aware of the repercussions of driving the vehicle through standing water. VBFD offers detailed
insight into driver training needs and future improvements in their report.
Results
VBFD found that the major causes of damage to the vehicles were water exposure and the design
of the vehicle being conducive to water damage. The most impacted parts were the engine air
intake and the electrical systems. They also found that vehicles suffered the costliest damage
from striking objects hidden underwater, water entering the engine, and water entering the
transmission pump, which pumps transmission fluid throughout the system.
VBFD planned work with the manufacturers to determine how to address the issues of air intake
and electrical systems, with the hope of modifying the vehicles similarly to what San Antonio’s
fire department did. Ultimately, VBFD was able to work with Pierce to obtain vehicles with
modified options for the air intake. Pierce also offers an option to relocate the electrical boxes to
an area that is less prone to water damage, placing them 5 ft off the ground as opposed to the
original position of 18 inches off the ground.
Preparing Fleets for Hurricanes and Flooding
An article in Fleet Management Weekly (Kavanagh 2020) provides tips for fleet managers on
preparing their fleet for a hurricane or flooding event. To prepare fleet garages and facilities,
patch roofs, secure windows, and check for loose items that may blow away. Also check security
lighting and that the emergency backup generator is operational. In addition, confirm that
communications equipment is in working order and take precautions to protect any vital paper
records. For drivers, Kavanagh suggests checking with managers or dispatchers before driving,
as well as strategizing routes prior to departing. If drivers hit heavy rain or flooding, exit the road
and stay in the vehicle, but do not drive into flooded areas. Finally, avoid electrical equipment
that may be submerged in water.
The Federal Transit Administration report Flooded Bus Barns and Buckled Rails: Public
Transportation and Climate Change Adaptation (Hodges 2011) discusses steps that transit
agencies should take prior to flooding events. First, when building major transportation facilities,
take caution to not build them in flood zones. In addition, before and during a flooding event,
clear debris from drainage systems to prevent flooding. Other actions include implementing
green infrastructure stormwater management like stormwater ponds, rain gardens, pervious
pavement, and native vegetation buffers to prevent localized flooding and reduce runoff.
An article in Truckinginfo (Roberts 2019) suggests making sure drivers are prepared for flooding
events by ensuring they have emergency items in their vehicles. This includes bottled water,
96
This report is available at no cost from the National Renewable Energy Laboratory at www.nrel.gov/publications.
nonperishable foods, flashlights, and rain gear. In addition, knowing the path and timeline of the
storm and preparing for areas that might be hardest hit is crucial for planning.
Force’s (2005) article includes additional thoughts from fleets in Florida. In the article, Dan
Croft indicates that prior to a storm, routine vehicle services are put on hold to give priority to
repairs and maintenance that may be needed before the storm hits. This includes equipping all
emergency vehicles with extra tires, wheels, and 5-gallon cans of tire sealant. Croft also indicates
that vehicles that will not be used for post-storm services are pooled together and used for
evacuations.
Emergency Operating Plans
NAFA Fleet Management Association’s article (Glasheen 2020) discusses preparing fleets for
natural disasters. The primary piece of advice is creating a disaster or emergency operations plan
to remain operational during a storm and training staff and practicing dry runs to ensure seamless
execution. When creating a plan, fleet managers should consider a variety of topics, such as how
to operate if employees cannot get to work, determining critical employees and their roles, how
to protect vehicles and how to handle the repairs or replacements of damaged vehicles, backup
operations location if a facility is damaged, and a communication plan in the event of loss of cell
coverage. Finally, capture lessons learned during an emergency event and update the plan
accordingly. The Federal Transit Administration report echoes the need for an emergency
operating plan or standard operating procedure for extreme weather events considering their
increasing frequency.
Fleet Clean USA’s article “Preparing Your Fleet for Disasters” (Sharone 2018) adds to these
recommendations and suggests including a plan for having a power supply should the power go
out in an emergency operating plan. It also recommends ensuring extra parts are on hand that
may be needed for emergency repairs to vehicles or facilities. Also include emergency routes in
case of road closures and evacuation procedures.
Selective Insurance’s “Flood Vehicle Management Guidelines” (Selective Insurance 2014)
suggests designating an emergency operating plan coordinator, along with a backup, prior to any
emergency event. The plan included parameters around when to enact and the order of
operations for each step in the plan. Selective echoes the need to identify roles and
responsibilities for employees, including who will enact certain aspects of the plan, such as
securing facilities and clearing debris, and readying backup communications should the power or
cell towers go out. Finally, they recommend developing a plan for alternative vehicle storage
locations, which is discussed in more detail in the Vehicle Planning and Repositioning section.
Emergency Fuel Plans
A good emergency operating plan should also include a plan for emergency fuel. Kavanagh
(2020) suggests investing in an emergency fuel plan, which functions similar to an insurance
plan; paying a monthly fee and signing a contract that ensures access to a set amount of fuel that
will be delivered to fleet vehicles even if the normal fuel distribution network is out of
commission. He especially recommends this for first responders and other critical fleets like fire
fighters and utility companies, as an emergency fuel plan guarantees the fleet can continue to
operate during a storm.
97
This report is available at no cost from the National Renewable Energy Laboratory at www.nrel.gov/publications.
Roberts (2019) suggests filling a fleet’s tanks ahead of a storm, as fuel can be difficult and
expensive to come by in the aftermath. This is another way to ensure fleet vehicles can operate
during or after a storm. Glasheen (2020) recommends filling up not only fleet vehicles prior to a
storm, but also employees’ personal vehicles to ensure they are able to report to work. In
addition, ensure the emergency fuel plan includes access to the variety of fuels the fleet uses, as
well as generators to prevent power outages for any on-site fueling equipment and fleet facilities.
This is also reiterated by Force (2005), who interviewed Doug Brock, Orange County’s fleet
manager. Brock states that the success of his fleet operations directly correlates to good fuel
management, including access to fuel and generator availability. He also states that he plans to
buy a new refueling system with more redundancy built in for emergency situations.
The city of Ocala was awarded a grant from the Federal Emergency Management Agency to
offset the cost of installing natural gas generators. These natural gas generators will be used to
supply the power necessary to charge five electric refuse trucks and the lift site, in addition to
lighting the building and powering the city’s on-site diesel fueling station.
Vehicle Planning and Repositioning
Another key aspect of preparing a fleet for a storm is planning for how to move vehicles and
assets out of harm’s way. The Federal Transit Administration states that a standard operating
procedure should be planned and implemented to move vehicles and other portable assets out of
harm’s way to an alternative location or two when flooding in predicted. Determine where assets
can be moved prior to the storm and work out an agreement with that facility, if needed. Also
ensure that the responsibility for moving vehicles is clear (Hodges 2011).
Selective Insurance also recommends this practice. They suggest identifying alternative storage
locations and entering into a contractual agreement to ensure the location will be available when
needed. It is suggested for larger fleets that two or more locations are identified, and that drivers
who will be responsible for moving the vehicles are aware of their roles. If the fleet is large,
consider arranging a contract with a transport service company to move the vehicles (Selective
Insurance 2014).
Roberts (2019) suggests parking trailers as closely together as possible when parking truck
trailers in an alternate location, with empty trailers tightly placed between the loaded trailers to
decrease the chance of being blown away by high winds.
Several examples of fleets moving their vehicles out of harm’s way are included in Force’s
article (Force 2005). Fleet manager Jon Crull states that in the city of Daytona Beach, Florida,
vehicles were parked in a stadium about 7 miles inland. Although the area sustained considerable
damage, the fleet remained intact. Croft indicated that any vehicles not being used during the
storm for evacuations or other purposes are repositioned away from trees and low-lying areas at
risk for flooding. Finally, in a phone interview conducted by NREL with the city of Tampa fleet
department in June 2020, the department indicated that one of their primary emergency protocols
is to move vehicles to higher ground prior to a storm. They have several parking structures in the
city, and vehicles are placed at the highest point of the structure.
98
This report is available at no cost from the National Renewable Energy Laboratory at www.nrel.gov/publications.
Driver Training
As discussed in the Emergency Operating Plans section, drivers in a fleet need to be trained on
all aspects of the plan and be clear on what they are responsible for prior to an emergency. In
Force’s article (Force 2005), Croft echoes the need for driver training, as several police cars lost
engines during a flooding event due to city employee errors and lack of judgement in high
waters. The importance of driver training is also discussed in the VBFD case study.
For example, the Federal Transit Administration’s Gulf Coast Climate Change Adaptation Pilot
Study (Texas A&M Transportation Institute 2013) describes how the Hillsborough Area
Regional Transit (HART) in Tampa has trained their drivers to respond to street flooding
encountered en route. When drivers encounter street flooding, they radio into dispatch with the
location and description of the flooding, and a HART supervisor is then sent out to examine. A
reroute is made accordingly. All drivers are instructed to decrease speed by at least 5 miles per
hour during rainfall.
Other Considerations
One other aspect for fleet operators to consider when preparing for a hurricane and flooding is
investing in a GPS, as described in an article in Rastrac (Dziuk 2020). GPS tracking can help
prepare fleets for an upcoming storm and keep vehicles and drivers safe by tracking the locations
of vehicles and their drivers. For example, GPS tracking can assist in locating migrated vehicles
after a storm and increases odds of recovering assets. Some GPS tracking devices also provide
drivers with panic buttons and emergency alerts. Kavanagh (2020) also suggests the use of a
GPS tracking solution to help optimize routing and avoid chokepoints in bad weather.
Preferred Vehicles for Driving Through Floodwaters
Although no literature was found on preferred vehicles for driving through floodwaters (e.g.,
vehicles that can typically make it through floodwaters with minimal damage), some information
can be gleaned from the phone interview with the Tampa fleet department and the VBFD case
study.
Tampa indicates that they do have vehicles in their fleet that were added specifically for their
ability to drive through floodwaters of up to 4 feet. Specifically, the HUMVs in their fleet can
sustain up to 30 inches of water. However, the best vehicle in the fleet for floods are dump trucks
and sewage trucks, as the engines vent on top of the transmission and can sustain up to 4 ft of
water. In addition, VBFD indicates that they modified their fire trucks so that instead of being
capable of sustaining 18 inches of water, they can now sustain up to 5 feet.
Therefore, it can be concluded that the higher the vehicle, and specifically the higher the engine
is off the ground, the better it will fare in floodwaters. However, this is an area with a clear gap
in literature that would benefit from additional insights from the fleet managers interviewed as
part of this effort.
Conclusion
This literature review consulted a total of 21 resources, including reports, articles, websites, and
notes from one phone interview. Most of the available resources were online articles or websites,
as few reports were found on vehicle resilience in hurricanes and floods.
99
This report is available at no cost from the National Renewable Energy Laboratory at www.nrel.gov/publications.
A sufficient amount of information was found regarding common vehicle damage, as well as
how to assess and repair it, if possible. All the information identified, except for some
information on EVs, was for conventionally fueled vehicles. Therefore, there is a gap in
knowledge for how AFVs fare in hurricanes, standing water, and floods.
In addition, the majority of the information available was specific to passenger or light-duty
vehicles, with the exception of the VBFD report and the Tampa fleet interview. That said, there
is a gap in knowledge around how medium- and heavy-duty vehicles, especially those part of
critical fleets such as police, emergency, and utility vehicles, may sustain flooding.
Some information was available on potential vehicle modifications to help prevent floodwater
damage, particularly for the VBFD fire trucks. In addition, it can be inferred from the literature
that the higher the important vehicle components are off of the ground (e.g., engine air intake
and electrical components), the best chance a vehicle has at making it through floodwaters with
minimal damage. Another important factor is the placement of the critical vehicle components.
As previously stated, there is a knowledge gap here that would benefit from discussions with
fleets.
Finally, information on preparing fleets for hurricanes and floods, including emergency
operating plans, was readily available. In-depth information was found on best practices and
considerations for fleets that may experience extreme weather events.
