
Canadian Health Policy Failures

Canadian
Health Policy Failures
What’s Wrong? Who Gets Hurt? Why Nothing Changes
by Brett J. Skinner
FRASER
I N S T I T U T E
Fraser Institute
2009
is book is an edited version of the author’s earlier published Ph.D. thesis, titled
Barriers to Health Policy Liberalization in Canada: Institutions, Information, In-
terests and Incentives, Copyright © Brett J. Skinner (), accepted by the
University of Western Ontario and catalogued in the National Library of Canada.
Large portions are direct excerpts from this earlier work. e author retains and
reserves all copyrights to previously published content reproduced in this book,
but has granted the Fraser Institute non-exclusive license to reprint content from
the earlier publication.
Copyright © by the Fraser Institute. All rights reserved. No part of this book
may be reproduced in any manner whatsoever without written permission except
in the case of brief passages quoted in critical articles and reviews.
e author of this book has worked independently and opinions expressed by him
are, therefore, his own, and do not necessarily reflect the opinions of the support-
ers, trustees, or staff of the Fraser Institute. is publication in no way implies that
the Fraser Institute, its trustees, or staff are in favor of, or oppose the passage of,
any bill; or that they support or oppose any particular political party or candidate.
Date of issue: September
Printed and bound in Canada
Library and Archives Canada Cataloguing in Publication
Skinner, Brett J. (Brett James), –
Canadian health policy failures : what’s wrong, who gets hurt, and why
nothing changes / Brett J. Skinner.
Includes bibliographical references.
ISBN ----
. Medical policy--Canada. I. Title.
RA.CS . C--
www.fraserinstitute.org | Fraser Institute
Contents
About the author / v
Acknowledgments / vii
Summary
/ ix
Introduction /
Chapter Unsustainable costs /
Chapter Shortage of medical professionals /
Chapter Shortage of medical technology /
Chapter Long waits for medical treatment /
Chapter Inflated generic drug prices and wasted spending /
Chapter Lack of access to new drugs /
Chapter Who gets hurt? /
Chapter Problematic Canadian health policies /
Chapter Economically liberal solutions /
Chapter Why nothing changes: Ideology and information /
Chapter Why nothing changes: Interest group incentives /
Chapter Why nothing changes: Political incentives /
Chapter Prospects for reform in Canada /
References and resources /
About this publication /
www.fraserinstitute.org | Fraser Institute
About the author
Brett J. Skinner is the Director of Bio-Pharma, Health, and Insurance
Policy at the Fraser Institute. He has a Ph.D. from the University of
Western Ontario (London) where he has taught courses in both the
Faculty of Health Sciences and the Department of Political Science.
He earned a BA (Hon.) from the University of Windsor (Ontario) and
an MA through joint studies at the University of Windsor and Wayne
State University (Michigan).
Since , Dr. Skinner has authored or coauthored major origi-
nal pieces of applied economics and public policy research. In ,
he was co-author of a paper that was awarded the Atlas Economic
Research Foundation’s Sir Antony Fisher International Memorial
Award for innovative projects in public policy. His research has
been published through several think-tanks including the Fraser
Institute, the Atlantic Institute for Market Studies (Halifax), and the
Pacific Research Institute (San Francisco). His work has also been
published in several academic journals including Economic Affairs,
Pharmacoeconomics, and Alimentary Pharmacology & erapeutics.
Dr. Skinner appears and is cited frequently as an expert in the Canadian,
American, and global media. He has presented his research at confer-
ences and events around the world, including twice testifying before
the House of Commons Standing Committee on Health in Ottawa, and
twice briefing bipartisan congressional policy staff at the US Capitol
in Washington, DC.
www.fraserinstitute.org | Fraser Institute
Acknowledgments
I would like to thank several people for their contributions to this book.
Mark Rovere, Senior Policy Analyst at the Fraser Institute, provided
research assistance as a coauthor on several studies that I reference
from my own body of work and also contributed research assistance
on parts of this book. Nadeem Esmail, Director of Health System
Performance Studies at the Fraser Institute reviewed and commented
on early drafts. Kendal Egli and Bill Ray from the Fraser Institute’s
publications department were responsible for layout and design.
www.fraserinstitute.org | Fraser Institute
Summary
Canadian health policy is increasingly failing patients and taxpayers.
Canadians spend a lot on health care relative to comparable countries,
yet our high relative level of spending does not buy Canadians as many
health care resources as patients in other countries enjoy. Shortages
of medical resources, as well as improper economic incentives within
the Canadian health system, have resulted in growing waits for access
to publicly funded, medically necessary goods and services. e avail-
able evidence indicates that wait times are longer in Canada than in
almost all other comparable countries. Not only has our high level
of spending not produced better access to health care, government
health spending has also been growing at rates that are faster than
our ability to pay for it through public means alone. is has resulted
in health care consuming ever greater shares of the revenue available
to governments, leaving proportionally less available for other public
responsibilities and obligations.
Economic research and international experience suggest that eco-
nomically liberal policy alternatives could dramatically improve the
financial sustainability and the value for money spent in the Canadian
health system. e expected result of introducing such policies in
Canada would be to reduce wait times and increase access to health
professionals, medical technologies, and new medicines. Most other
countries that share Canada’s social goal of publicly guaranteeing
universal health insurance coverage are increasingly introducing eco-
nomically liberal reforms into their health systems. Canada has gone
the opposite direction in effectively prohibiting user fees for publicly
funded services, extra-billing by health providers above public fee lev-
els, and private payment or private health insurance for physician and
x Canadian Health Policy Failures
Fraser Institute | www.fraserinstitute.org
hospital services. Yet, all or some of these policies have been used suc-
cessfully in other countries that also have publicly guaranteed universal
health insurance systems, and those countries achieve better access to
health care resources on a more economically efficient and financially
sustainable basis than Canada.
ere are four main political explanations for why economically
liberal health policy reform is resisted in Canada. First, policy makers
probably suffer from information asymmetry regarding health pol-
icy alternatives. An analysis of the health policy literature suggests
that there is a dominant ideology among Canadian experts that is
opposed to the liberalization of health policy. Ideological bias can
cause researchers to ignore or unfairly discount evidence and policy
options that are counter to their own preferences and worldviews.
Second, special interests in the health policy community benefit
economically from the state’s involvement in health care and there-
fore face incentives to favor interventionist public policies and oppose
liberalization.
ird, the electoral incentives produced by the distribution of the
tax burden and of illness are opposed to the introduction of economi-
cally liberal health policy reforms. e majority of the tax burden is
paid for by a minority of the population. is means most people
are disproportionally insulated from the price of public health insur-
ance programs. erefore, the majority of voters have significantly
reduced financial incentives to make cost-benefit calculations about
the performance of the health system. It also means that policy makers
face fewer political risks from raising taxes to fund health care than
from introducing price mechanisms that are paid by everyone. And
ill people—those most directly harmed by a lack of access to medi-
cal care—make up an extremely small percentage of the population,
therefore representing too few votes to have a decisive influence on
policy makers about declining access and coverage under Medicare.
e costs of public policy failure are not borne equally by policy mak-
ers and the public and this also can produce policy preferences that
do not optimize the public interest.
Summary xi
www.fraserinstitute.org | Fraser Institute
Finally, federalism, as it is actually practiced in Canada, represents
an institutional barrier to the adoption of liberal health policies. e
constitutional division of powers assigns to the provinces sole leg-
islative authority for medical services and medical insurance policy.
eoretically, this arrangement should facilitate health policy innova-
tion. However, the national (or federal) government has “gamed” the
formal division of powers under Canadian constitutional federalism
by intervening in an area of exclusive provincial policy jurisdiction.
rough the exercise of its spending power, the national government
has imposed legislative requirements on the provinces that shape and
constrain provincial health policy. e effect of federalism as it is actu-
ally practiced has been to create significant financial disincentives for
policy innovation at the provincial level and to thereby erect a de facto
institutional barrier to health policy liberalization.
Yet, despite these obstacles there are several reasons for optimism.
While the Canada Health Act (CHA) is a partial barrier to economi-
cally liberal policy reforms, there is still a surprising degree of freedom
under the act, and ultimately the provinces still have policy autonomy
if they choose to exercise it. e nature of health policy liberalization
as a wedge issue in a multiparty system also suggests that a reform plat-
form could work as a winning electoral strategy. And the results from
various public opinion polls indicate that when the right questions
are asked, most Canadians might actually tend to prefer economically
liberal and socially minimalist approaches to health policy.
Canadian Health Policy Failures
www.fraserinstitute.org | Fraser Institute
Introduction
Canada’s publicly funded single-payer health care system—commonly
known as “Medicare”—is no ordinary government program. Many
Canadians politically support Medicare with the kind of fervor often
reserved for fundamentalist religions. If Medicare is, for some, like a
national religion, then the Canada Health Act (CHA) is its sacred text.
e five “principles” of the CHA are recited like a catechism in introduc-
tory university courses on health policy. It is standard political doctrine
that the Canadian health care system is the best in the world. To suggest
that alternative health policy approaches might produce better outcomes
for patients, taxpayers, and health care providers is often treated like blas-
phemy. Faithful devotion to Medicare is considered by many to be the very
essence of what it means to be “Canadian.” Yet, despite all the rhetoric
used by Medicare’s advocates, the reality is that popular notions about the
superiority of Canada’s health care system are not supported by the facts.
Most other developed countries that share Canada’s core social goals for
health care actually have better health care systems.
International comparisons
One often ignored but enlightening fact is that no other developed coun-
try in the world has chosen to adopt the Canadian policy approach to
health care. e truth is that other countries typically have some kind of
pluralistic health insurance system which involves a mix of public- and
private-sector (both for-profit and non-profit) involvement in medical
insurance and the delivery of medical goods and services, accompanied by
varying degrees of public subsidy and government regulation. By contrast,

4 Canadian Health Policy Failures
Fraser Institute | www.fraserinstitute.org
Canada’s approach to health care policy could be characterized as extreme.
Canadian governments effectively ban private-sector funding of hospital
and physician services. ey also prohibit for-profit or competitive provi-
sion of publicly funded health care services. Canadian governments also
regulate, restrict, abolish, or distort prices for medical goods and services.
International differences in health policy might be expected to pro-
duce differences in overall system performance, and this assumption has
been the basis for comparative international rankings of health systems. It
may surprise many Canadians to know that most of the published reports
which use international comparisons either tend to rank Canada poorly or
only slightly above average on performance, even though Canada has one
of the most expensive health systems in the world. e relatively mediocre
ranking of the Canadian system remains fairly constant across published
studies, despite varying comparator groups and methods for measuring
international health system performance, including differing performance
criteria and emphasis on population health and social equity or economic
efficiency outcomes.1
For example, the United Nations World Health Organization (WHO)
published a report in ranking international health systems on the
basis of overall performance for the year (WHO, ). In the com-
parison of countries of varying economic development, Canada ranked
th in the report’s overall health attainment index and th in a second
composite index of overall health system performance. According to the
criteria used by the WHO, this places Canada in the top to percent
ere are only a few studies that analyze and rank overall health system perfor-
mance in terms of public interest indicators (e.g., access to medical resources and
treatment, value for money, health outcomes, etc.), use large groups of comparator
countries, and which do not rely on subjective survey data to compare the performance
of international health systems. Other studies have compared Canada’s health system
against smaller groups of countries, or have measured performance in terms of subjec-
tive perceptions among patients and health care providers using data collected from
opinion surveys. Some of these studies include Blendon, Kim, and Benson ();
Ramsay (); Schoen, Osborn, Huynh et al. (); Davis et al. (); Schoen,
Osborn, Doty et al. (); Anderson, Frogner, and Reinhardt (); and Willcox,
Seddon, and Dunn et al. ().

Introduction 5
www.fraserinstitute.org | Fraser Institute
of countries in the world. However, in the context of a global comparator
group that includes both rich and poor countries, this is probably not as
high as many Canadians might expect.
Another study ranked the performance of Canadian health care
in a group of countries belonging to the Organisation for Economic
Co-operation and Development (OECD)2 in terms of being “consumer
friendly” (HCP/FCPP, : ). e member countries of the OECD
are considered to have generally comparable levels of economic develop-
ment and are often used for “apples to apples” international comparative
analyses. e overall rankings were based on five separate indexes mea-
suring patient rights and information, waiting times for accessing medical
services, population health outcomes, the generosity of public health care
systems, and access to pharmaceuticals. ese five indexes were further
comprised of total variables used as proxies for each of these health
system values. e results placed Canada rd of in terms of overall
performance, excluding consideration of costs. When adjusted for the
level of health spending in each country, Canada’s rank fell to th of
countries compared.
Esmail and Walker () also regularly rank the performance of
Canadian health care in an international context using data published by
the OECD. eir study is built on comparative international performance
within a number of separate indicators of access to medical resources and
population health outcomes. e study compares Canada only to other
OECD countries that have the same social goals as Canada for health care,
which is to provide a state guarantee of universal health insurance cover-
age. e results of this annual study show that Canada tends to consis-
tently rank poorly against other OECD countries in terms of population-
adjusted comparisons of the number of physicians and the numbers of
four select diagnostic technologies (i.e., MRI, CT, mammography, and
lithotripters). e study also ranks Canada against the OECD according
to seven measures of population health outcomes. According to their data
covering OECD countries, Canada ranks between th and th on
three broad measures of overall mortality rates that are largely affected
For more information, please visit www.oecd.org.

6 Canadian Health Policy Failures
Fraser Institute | www.fraserinstitute.org
by factors other than medical care (i.e., healthy life expectancy/life expec-
tancy, infant mortality, and perinatal mortality), between th and th on
three measures of mortality that can be specifically affected by medical
care (i.e., mortality amenable to health care, potential years of life lost,
and breast cancer), and nd on mortality rates related specifically to colon
or rectal cancer. According to their aggregate results, Canada ranks th
overall on measures of population health outcomes. eir report also
ranks international health systems on the basis of the availability of vari-
ous medical resources (i.e., number per population), including physicians,
and four types of advanced medical diagnostic technologies suggested as
a proxy for overall access to an acceptable standard of high quality health
care. Averaged across all five measures of access to medical resources, the
aggregated results of their individual ranking comparisons would have
placed Canada in the bottom percent of the OECD countries compared.3
Overall, the weight of the available research comparing aggregate
health system performance in an international context tends to support
the view that the Canadian health system is not performing well relative
to its peers. In particular, the conclusions that tend to be drawn are that
Canadians spend a lot on health care relative to comparable countries, yet
this high relative level of spending does not buy Canadians as many health
care resources as patients in many other countries enjoy.
US-Canada comparisons
In the Canadian health policy debate, the international evidence is often
ignored by advocates of government-run health care who usually prefer
to focus only on the flaws (whether real, imagined, or exaggerated) of the
American health care system relative to Canada. Critics of the American
health care system are specifically concerned about comparatively higher
levels of health spending as a percentage of GDP4 and the lack of univer-
sal insurance coverage in the United States. Canada’s health care system
Author’s calculations.
GDP or Gross Domestic Product is a statistical measure of national economic output.
Introduction 7
www.fraserinstitute.org | Fraser Institute
is often presented as a model for health care reform in the United States.
Yet the reality is that the American health care system outperforms the
Canadian system in terms of access to medical resources. is is espe-
cially obvious with regard to the most advanced medical technologies
and treatments. It is true that Canadian governments promise universal
health insurance coverage for all medically necessary care. But govern-
ments define “medically necessary” according to what they are willing to
pay for. Increasingly, Canadian governments are reducing the real, practi-
cal economic value of public health insurance benefits. In terms of deliver-
ing actual access to medical goods and services, the Canadian system is not
really doing a much better job at universalizing effective health insurance
coverage than the American system. Access to a wait list is not the same
thing as access to medical care.
Canadian health care is neither as good as its advocates say it is, nor is
American health care as bad as its critics have asserted. Indeed, there are
many unsubstantiated myths about the American system that are never-
theless regularly cited by advocates of government-run health insurance
in both Canada and the United States, and are unquestioningly repeated
by the media. ese myths are easily dispelled by the facts.
The ‘cost’ of health care in Canada and the US
One myth concerns the relative cost of health care in Canada versus the US.
Some researchers have compared the growth of health spending in Canada
and the United States over time and argued that Canada’s system has been
better at cost control. In fact, before the introduction of government health
insurance, Canada’s total health spending was roughly the same proportion
of its GDP as total American health spending was of US GDP. e data
show that after single-payer health insurance was introduced in Canada in
, American health spending grew to a higher percentage of GDP than
Canadian health spending. is has led some to assume that centralized
government control of health insurance is better at controlling costs than
pluralistic public-private health insurance systems (Evans et al., ).
8 Canadian Health Policy Failures
Fraser Institute | www.fraserinstitute.org
However, Ferguson (a) analyzed the relative growth of per-capita
health spending in Canada and the US, separately from the relative growth
of per-capita GDP in Canada and the US, from –. Ferguson’s
analysis showed that total health spending in the US and Canada grew at
roughly similar paces until the late s. However, GDP in the US grew
slower than in Canada during much of the s and early s.
is, according to Ferguson, is why health spending, when measured
as a percentage of GDP, appeared to grow faster in the US than in Canada
during this period. If the different growth rates of GDP are not accounted
for, it creates the illusion that Canadian public health insurance was better
at cost control during this period. Ferguson (a: ) further showed
that if Canadian GDP had grown at the same rate as GDP in the US,
Canada would have been spending an even higher percentage of its GDP
on health care during the s and s than the US. According to
Ferguson (a), Canada’s spending rank relative to the US would only
have improved when governments began to restrict the scope of public
health insurance benefits, impose price controls, and ration health spend-
ing in Canada during the late s and early s. e truth is that
Canada’s alleged success at cost control during the s and s was
an illusion created by different growth rates in GDP between Canada and
the US. Since the late s, Canada’s relative success at cost control has
been achieved from government rationing, not a more efficient allocation
of medical resources.
Hidden costs of Canadian health policy
As a matter of fact, a comparison of American and Canadian health care
shows that Canada’s particular approach to health care has significant
hidden costs that are not usually acknowledged by the advocates of single-
payer health care. e hidden costs of Canadian health care include:
significant unfunded liabilities and a financial sustainability crisis
facing governments because of the uncontrolled growth of public
health care spending;

Introduction 9
www.fraserinstitute.org | Fraser Institute
shortages of medical resources, especially for high technology and
the most advanced medical treatments;
significant numbers of people who lack actual effective access to
publicly insured and medically necessary health care;
significantly delayed access to the relatively fewer medically
necessary goods and services that are available;
government-imposed restrictions on the incomes of health
professionals at levels below market value; and
disincentives for medical innovation.
It is, of course, true that compared to Canadians, Americans spend more
of their incomes on health care, but it is equally true that Americans get
faster access to more and often better medical resources in return for the
money they spend.5 To illustrate this, table contrasts the availability of
medical resources and effective insurance coverage in the American and
Canadian health systems using comparable government sources of data.
e evidence is clear that the American health system tends to make more
medical resources available to its population than the Canadian system.
CIHI (a) data indicates that, at the provincial level, total health spending in
Canada in ranged from a low of .% of provincial GDP in Alberta to highs of
.% in Nova Scotia and .% in Prince Edward Island. Incidentally, this means that
health spending in Nova Scotia and PEI is roughly just as proportionally expensive
as health spending in the United States overall. orpe () also found that health
spending grew faster in several Canadian provinces compared to several US states
when studied over the same time period. ese findings suggest that a single-payer
health insurance system does not inherently produce lower overall costs or cost growth
than a pluralistic insurance system; in fact, there are many complex economic, politi-
cal, and institutional factors which interact to create demand-side and supply-side
incentives in each system, and these incentives drive health spending.

Table : Comparison of health insurance system outputs in Canada and the
United States
Measures of system-wide health insurance benet,
coverage, and choice
US Canada Data sources
Number of practicing physicians per million population in
2006
2,400 2,100 OECD (2008)
Number of practicing nurses per million population in 2006 10,500 8,800 OECD (2008)
Number of MRI units per million population in 2006 26.5 6.2 OECD (2008)
Number of MRI exams per million population in 2004–05 83,200 25,500 CIHI (2006)
Number of CT Scanners per million population in 2006 33.9 12 OECD (2008)
Number of CT exams per million population in 2004–05 172,500 87,300 CIHI (2006)
Number of inpatient surgical procedures per million
population in 2004
89,900 44,700 OECD (2008)
Acute care hospital sta ratio, average number of sta
per bed in 2005
5.3 4.3 OECD (2008)
Average age (years) of hospital facilities in 2003
(Ontario as proxy for Canada)
9 40 OHA (2003)
Estimated percentage of the population uninsured or
“eectively” uninsured for non-emergency necessary medical
services in 2007
5.0% 7.4%
[1]
Herrick (2008);
Statistics Canada
(2008a)
Estimated percentage of the population legally prohibited
from directly buying local necessary medical services when
uninsured or “eectively” uninsured
0.0% 83.5%
[2]
Flood & Archibald
(2001); Statistics
Canada (2007)
Estimated percentage of the population legally prohibited
from buying private insurance for necessary medical services
0.0% 89.8%
[3]
Flood & Archibald
(2001); Statistics
Canada (2007)
Source: Adapted and revised from Skinner et al., 2008; other sources shown; most recent
available data.
[1] In 2007, Statistics Canada (2008a) estimated that 1,146,787 Canadians (of the non-aboriginal, non-
military, non-territorial population aged 12 and older) obtained access to primary-care physicians only
through urgent/emergency rooms in hospitals or through community health clinics, hospital outpatient
clinics, telehealth, etc., while 898,480 additional Canadians had no access to a primary-care physician.
[2] Six of 10 Canadian provinces accounting for 83.5% of the national population legally ban direct private
payment for necessary medical services (provided in province).
[3] Six of 10 provinces accounting for 89.8% of the national population legally ban the purchase of private
insurance for necessary medical services (provided in province).

Introduction 11
www.fraserinstitute.org | Fraser Institute
Health insurance coverage in Canada and the US
e typical response to such comparisons of medical resource availability is
that Canada at least has universal access to these resources, whereas many
people in the US are uninsured. But, even on the issue of health insur-
ance coverage, the Canadian system does not perform much better than
the United States when it comes to actually delivering effective access to
“insured” medical care. Access to a wait list is not the same thing as access
to health care. For example, chapter two of this book examines the short-
age of physicians in Canada. e chapter shows Statistics Canada survey
data which estimates the number of Canadians in who did not have
access to a regular primary care physician, or only had access to primary
physician services through emergency rooms or community health clinics.
According to the analysis, .% of Canadians fall into this category. ese
Canadians have similar (if not exactly the same) practical status as “unin-
sured” Americans in terms of effective access to insured health services.
Without access to a family doctor it is very difficult to obtain regular pri-
mary care, referrals for elective specialty medical services, or access to most
prescription drugs. When Canadians can’t get access to health care because
they can’t find a physician or wait so long that they are effectively uninsured,
they are, in this sense, not much better off than uninsured Americans.
By comparison, American governments do not guarantee universal
health insurance coverage, but they do guarantee universal access to
urgent and emergency health services. American governments legally
require health professionals and hospitals to treat patients who need
urgent or emergent care regardless of ability to pay. It is also true that, in
practice, Americans who lack health insurance frequently utilize hospital
ERs or charitable and/or publicly funded community clinics to obtain non-
emergency primary health care services, often without securing payment
in advance.6 is is exactly how, according to Statistics Canada, .% of
According to the US National Association of Community Health Centers, com-
munity health centers are “non-profit, community-directed health care providers serv-
ing low income and medically underserved communities.” e centers are funded
by government as well as philanthropic donations. According to the Association’s

12 Canadian Health Policy Failures
Fraser Institute | www.fraserinstitute.org
Canadians obtain access to primary health care. is means that if, in its
Current Population Survey (CPS), the US Census Bureau asked Americans
about being without “access to health care” at any point during the survey
year instead of being without “health insurance,” figures in both Canada
and the United States might look more similar.
To illustrate this concept, consider that research shows that the actual
number of effectively uninsured Americans is less than half of the figure
usually reported by the US Census Bureau, and that being uninsured
is usually only a temporary condition (Herrick, ; Graham, ).
According to the US Census Bureau’s most recent Current Population
Survey (CPS), . million Americans lacked health insurance in
(DeNavas-Walt et al., ). However, estimating the number of people
without health insurance in the United States is the subject of much
debate. Table illustrates the problems with the CPS with reference to
the CPS survey. It shows the numbers for the estimated US popula-
tion in each of the survey categories for health insurance coverage. Note
that the total number of people with private health insurance, govern-
ment health insurance, plus those without health insurance, exceeds the
Census Bureau’s estimate for the entire population of the United States—
an obvious impossibility. e number of responses to the CPS question-
naire is inaccurate by a margin of at least million people.
An accurate estimate must take account of the particular character-
istics of the survey population, including (BCBS, ; Herrick, ):
people who are temporarily uninsured only for a short period
because they are between jobs and have, for the time being, lost
employer-based health insurance, or who are students transitioning
between family, school, and work coverage;
most recent statistics (), . million uninsured patients were served annually by
community health centers, with million people in total served. e Association
states that patients are served “regardless of their insurance status or ability to pay”
(
NACHC, ).

Introduction 13
www.fraserinstitute.org | Fraser Institute
people who are eligible for public health insurance programs like
Medicaid, Medicare, and the State Children’s Health Insurance
Program (SCHIP) for children, but who are reluctant to enroll until
the moment they require health care services;
people who have sufficient income to buy health insurance but
choose not to; and
people who are uninsured for long periods of time because they lack
employer-based insurance or the income to buy health insurance
themselves.
Herrick () publishes an annual analysis of the CPS data to identify
the number of Americans whose income is too high to qualify for Medicaid
(i.e., the American State-run health programs for low-income people) but
still earn too little income to “easily afford” some of the best family health
Table : Inaccuracies in the US Current Population Survey (CPS)
questionnaire on health insurance coverage among Americans
Survey response Estimated population
Had private health insurance 201,690,000
Had government health insurance 80,270,000
No insurance coverage during the years* 46,995,000
Total of above 328,955,000
Total CPS US population 296,824,000
Estimated magnitude of inaccuracy 32,131,000
Sources: Skinner and Rovere, 2007e; Skinner, Rovere, and Warrington, 2008.
*The figures reported by the US Census Bureau for the year 2006 indicate values that are
potentially flawed. The report notes that the CPS estimates reflect point-in-time coverage
rather than the number of people uninsured for the entire year.

14 Canadian Health Policy Failures
Fraser Institute | www.fraserinstitute.org
insurance plans costing more than US$,7 annually. According to his
research, % of US residents in were privately insured or enrolled
in a government health program. Of the uninsured, million had house-
hold incomes above $, and could afford health insurance, and
million qualified for government programs but had not enrolled. Herrick
concluded that million people, or % of the uninsured, could obtain
coverage but have chosen to forgo insurance. at means % of US resi-
dents either have health coverage or access to it.
Based on Herrick’s () analysis, the estimated number of Americans
who were effectively uninsured for non-emergency, necessary medical ser-
vices during was roughly equal to % of the total population. e
estimated percentage of the American population who were effectively
uninsured in (%) is actually lower than the estimate for the per-
centage of Canadians in the same year whose effective access to primary
care was conceptually similar to uninsured Americans (.%). In fact, it is
not much higher than the percentage of Canadians (.%) who Statistics
Canada estimates do not have any access at all to a primary care physician,
and who therefore probably have very limited, if any, actual access to pub-
licly insured medical care. ese figures do not even include an estimate
of the number of Canadians who have access to a primary care physician
but who are on waiting lists to get publicly insured medical treatment.
In addition, lacking health insurance is not the same thing as lacking
access to health care. e uninsured in the United States are not prohib-
ited from obtaining health care through direct payment, and it is illegal for
hospitals to refuse urgent or emergency care. In other words, being unin-
sured in the United States is not an absolute barrier to getting necessary
medical care. By contrast, in Canada, six out of provinces accounting
for .% of the national population legally ban direct private payment
for necessary medical services (provided in province), and six out of
provinces accounting for .% of the national population legally ban the
purchase of private insurance for necessary medical services (provided
in province) (Flood and Archibald, ; Statistics Canada, ). is
means that Canadian patients who want to escape the delays in the public
According to Herrick (), many could potentially afford less generous coverage.
Introduction 15
www.fraserinstitute.org | Fraser Institute
system are prohibited from paying privately for health care services (in
addition to what they already pay in taxes for the public system). In prac-
tical terms, Canadian patients are unable to buy quicker access or better
care than what the government health insurance program provides. In
this sense, Canadian patients on waiting lists are worse off than uninsured
Americans who may at least legally use their own money or credit to buy
health care if they lack insurance coverage. Canadian patients can only pay
privately for health care if they leave their province of residence. Ironically,
the Canadian health care system encourages underserved patients to
spend their money not only in other provinces, but also often in other
countries, usually the United States. e absurdity of the policy is that
because Canadian patients are not allowed to spend their own money on
medical care provided at home, the economic benefit of this spending is
lost for their province, and sometimes for Canada altogether, as Canadians
are left to purchase health care from foreign economies.
Health insurance and bankruptcy in Canada and the US
e American debate about health care has been influenced by controver-
sial research (Himmelstein et al., ) claiming to show that nearly two
thirds of personal bankruptcies in the United States result from uninsured
medical expenses or loss of income due to illness. An earlier edition of this
research (Himmelstein et al., ) claimed that just over half of personal
bankruptcies were due to these “medical causes.” e authors of these
studies have argued that the problem of “medical bankruptcies” would
be solved by the adoption of a government-run health insurance system
like Canada’s. e medical bankruptcy myth is also frequently raised in
the Canadian health care debate and is regularly cited by the media north
of the border. Yet the medical bankruptcy study has been soundly refuted
by several researchers.
To begin, the idea that large numbers of Americans are declaring bank-
ruptcy due to medical expenses is a myth. For example, Dranove and
Millenson () critically analyzed the data from the edition of
the medical bankruptcy study. ey found that medical spending was a
16 Canadian Health Policy Failures
Fraser Institute | www.fraserinstitute.org
contributing factor in only % of US bankruptcies. ey also reviewed
other research, including studies by the Department of Justice, finding
that medical debts accounted for only % to % of the total debts among
American bankruptcy filers who cited medical debt as one of their reasons
for bankruptcy.
Second, the notion that greater government involvement in health
insurance will reduce bankruptcy can be tested by comparing personal
bankruptcy rates in the United States and Canada. Unlike the United
States, Canada has a universal, government-run health insurance system.
Following the logic of Himmelstein and colleagues, we should therefore
expect to observe a lower rate of personal bankruptcy in Canada com-
pared to the United States.
Yet the evidence (Skinner and Rovere, ) shows that in the only
comparable years, personal bankruptcy rates were actually higher in
Canada. Personal bankruptcy filings as a percentage of the population
were .% in the United States during and .% in . In
Canada, the numbers are .% in both and . e data are taken
from government sources and defined in similar ways for both countries,
covering the time period after the legal reforms to US bankruptcy laws in
and before the onset of the economic recession.
is is important because the reforms produced US legal stan-
dards for bankruptcy filing that are now very similar to Canada’s. Before
, it was much easier to file for bankruptcy in the United States,
making cross-border comparisons prior to the legal changes meaning-
less. Further, in , the United States was harmed by massive systemic
home-mortgage defaults that did not occur in Canada because of differ-
ences in mortgage lending practices. US mortgage defaults would have
been correlated with increased bankruptcy rates. erefore, Canada-US
comparisons in are not valid because the data is skewed by other
policy differences unrelated to health insurance.
ere is no reason to expect that bankruptcy would be affected by
other factors in Canada and the US. Aside from universal single-payer
health insurance, there are few significant health, social, or legal policy
differences between the two countries that could be causally linked to
bankruptcy rates.
Introduction 17
www.fraserinstitute.org | Fraser Institute
Both countries have employment insurance programs that provide
income support in the event of job loss. In fact, unemployment occurs with
roughly similar frequency among Canadians and Americans. National
unemployment rates in were .% in Canada versus .% in the
United States (Statistics Canada, ).
Drug insurance is also structured almost identically, so exposure to
drug costs is similar in both countries. While the entire Canadian pop-
ulation is universally eligible for publicly funded insurance for hospital
and physician services, only about one third of the Canadian population
is publicly insured for prescription drugs. In Canada, as in the United
States, low-income people, disabled populations, and seniors are eligible
for separate publicly funded drug programs, while most employed people
obtain drug insurance as a benefit of employment, and the rest of the
population pays cash.
Access to medical care for people who experience long-term unem-
ployment, disability from illness, and chronic low-income status is also
practically the same in both countries, being facilitated by non-profit,
publicly funded community health centers and public programs such as
Medicaid in the United States and government-run systems in Canada.
e truth is that the majority of debt among bankrupt consumers in
both Canada and the United States is comprised of non-medical expen-
ditures and therefore has little to do with health insurance coverage. On
the rare occasion that medical debts do partially contribute to bankruptcy,
they likely accumulate from patients’ demands for the kinds of expensive
cutting-edge or end-of-life treatments that would never be covered by
government insurance anyway. It is a fact that many of these same types of
expensive treatments are increasingly not insured by government health
care in Canada.
Indeed, if we define medical bankruptcies the way Himmelstein and
colleagues did for their study in the United States, we find such bankrupt-
cies also occur in Canada. Survey research commissioned by the Canadian
government (Redish et al., ) found that despite having a government-
run health system, medical reasons (including uninsured expenses) were
cited as the primary cause of bankruptcy by approximately % of bank-
rupt Canadian seniors ( years of age and older).

18 Canadian Health Policy Failures
Fraser Institute | www.fraserinstitute.org
Purpose of international comparisons
Does this mean that this book is advocating America’s health care system
for Canada? No. is comparison merely illustrates that much of what
Canadians are told about their health care system (and other health care
systems, including that of the US) is not correct. Across many objective
indicators, the performance of other health systems is most often better
than Canada. Indeed, by comparison with Canada, most other systems are
very pragmatic in their policy structures. Overall, the goal of most other
health systems is to help markets achieve universal health insurance cov-
erage with the lowest possible cost to taxpayers, the highest possible ben-
efit to patients, the fewest distortions to economic activity, and the least
restriction on professional freedom and consumer choice. By contrast,
the goal of Canadian health policy appears to be the egalitarian distribu-
tion of medical resources through the social redistribution of costs and
centralized gatekeeping on access to medical treatment. In practice, the
Canadian system is plagued by several serious failures, particularly regard-
ing its ability to provide timely access to high quality medical resources
at a sustainable economic price. In response to these failures, Canadian
health policy reform has become a series of “too little, too late” empty ges-
tures designed to maintain political support for a health care system that
increasingly restricts the practical value of the public insurance benefit in
order to keep costs growing at a financially sustainable pace.
Outline of the book
e purpose of this book is to focus on the “exceptionalism”8 of the
Canadian health care system as a textbook case of government failure in
medical insurance and medical services policy. Chapters one to six identify
six key areas where the Canadian health care system is failing. e focus is
on measuring and comparing the relative availability of medical resources
Evans (b) used this term to describe the American health care system in an
international context.

Introduction 19
www.fraserinstitute.org | Fraser Institute
(and costs) instead of overall population health outcomes in this paper.
is approach is consistent with the weight of research, which indicates
that there is no statistical correlation between spending on medical care
and population health outcomes.9 is is because only a small percent-
age of the population in any given year makes significant use of curative
medical treatment that could extend life. Population health statistics like
life expectancy, for instance, are largely determined by non-medical fac-
tors. is finding is important because it means that it is inappropriate to
judge the relative performance of international health insurance systems
on the basis of population health statistics.10
Including a study submitted to the federally commissioned National Forum on
Health by the Centre for International Statistics ().
Appropriate comparisons of international health spending should measure the
relative value received for the money spent on health care. Value for money means:
how much does one country spend relative to similar countries, and how many health
care resources are received in return for that money relative to similar countries? If
a country spends more of its GDP on health care than Canada, does it get more or
better health care resources (e.g., hospitals, physicians, nurses, high-tech equipment,
advanced medicines, etc.), or faster access to health care resources than Canada? It
is important to measure only the things purchased by the system of financing health
care instead of the health outcomes produced by medical treatment. e output “good”
produced by medical treatment is human health, but the output of health insurance
is access to medical goods and services. Of course it is true that health insurance
systems influence investment in and utilization of medical resources and therefore
indirectly affect the performance of the medical system and patient health outcomes.
However, it should be noted that the particular effects of the medical system are not
usually apparent in broad population health outcomes statistics like life expectancy
because only small percentages of the population have life-shortening health condi-
tions that can be remedied by medical treatment. Broad population health statistics
like life expectancy are more significantly affected by things that affect many people
and which are usually unrelated to the type of health insurance policy used by a coun-
try. For example, clean water, nutrition, the treatment of sanitary sewage and waste,
environmental pollution, auto accident rates, violent crime rates, poverty, infectious
disease control, mass vaccination programs, etc. have the most statistically signifi-
cant impact on population-wide health statistics. Once these factors are controlled
for, there tends to be little absolute difference in life expectancy between countries
that have similar levels of economic development. In order to accurately isolate and

20 Canadian Health Policy Failures
Fraser Institute | www.fraserinstitute.org
Chapter seven offers some qualitative support for the quantitative
analyses presented in earlier sections. e chapter provides a small sam-
ple of published media stories and journalistic reports that illustrate the
ways in which real people are often harmed by Canadian health policy.
Chapter eight identifies and discusses the key health and prescription
drug policies in Canada that are most problematic. Chapter nine provides
a discussion about various potential alternative policies that could provide
better outcomes. In both chapters, opposing opinions are discussed and
critically analyzed and compared to research that supports the arguments
presented in this book.
Chapters , , and identify the key political factors that act as bar-
riers to the adoption of more economically rational health care policies
in Canada. One of these barriers is that the ideological political values of
many in the academic research community tend to be opposed to the eco-
nomic liberalization of health policy, and this could partially contribute
to an information deficit for policy makers. Another is that some special
interest groups actually benefit economically from the state’s involvement
in health care and therefore could face strong incentives to favor interven-
tionist public policies and oppose liberalization. e electoral dynamics
produced by the distribution of the tax burden and of illness are also not
measure output produced by the medical system (i.e., quantity, quality, allocation, and
organization of medical resources) one should measure differences in the health out-
comes of patients actually treated by hospitals and doctors (assuming the populations
have similar risk profiles). According to this measure there is probably little reason
to doubt that the quality of medical care in Canada is among the best in the world. In
fact, for patients that actually receive medical treatment, we would expect to see little
difference in health outcomes between countries with similarly developed hospital
systems, medical science, and medical professionalism. erefore, I propose that the
best way to accurately compare the “output” performance between health insurance
systems is to know the number of people needing treatment and the number of peo-
ple receiving actual access to the best available global standard of treatment and the
cost of achieving this. Unfortunately, I am not aware of any international data source
that makes such an analysis possible. erefore, we are left with making comparisons
about variations in the “output” between different health insurance systems using
available international data on population, demographics, aggregate health spending,
and aggregate volumes of medical resources.
Introduction 21
www.fraserinstitute.org | Fraser Institute
favorable to the introduction of economically liberal health policy reforms.
e majority of the tax burden is paid for by a minority of the population.
is means most people are disproportionately insulated from the price
of public health insurance programs. erefore, the majority of voters
have significantly reduced financial incentives to make cost-benefit cal-
culations about the performance of the health system. It also means that
policy makers face fewer political risks from raising taxes to fund health
care than from introducing price mechanisms that are paid by everyone.
And ill people—those most directly harmed by a lack of access to medi-
cal care—make up an extremely small percentage of the population, and
therefore represent too few votes to have a decisive influence on policy
makers about declining access and coverage under Medicare. e costs
of public policy failure are also not borne equally by policy makers and
the public, and this might also produce policy preferences that do not
optimize the public interest.
e book concludes in chapter on an optimistic note, with a discus-
sion about the political feasibility of achieving economically liberal health
policy reform in Canada. While the Canada Health Act (CHA) is a partial
barrier to economically liberal policy reforms, there is still a surprising
degree of freedom under the act, and ultimately the provinces still have
policy autonomy if they choose to exercise it. e nature of health policy
liberalization as a wedge issue in a multi-party system is also discussed
to demonstrate that a reform platform could work as a winning electoral
strategy. is is accompanied by a review of the results from various pub-
lic opinion polls which indicate that when the right questions are asked,
the responses suggest that most Canadians might actually tend to prefer
economically liberal and socially minimalist approaches to health policy.
www.fraserinstitute.org | Fraser Institute
Chapter
Unsustainable costs
Health spending in Canada
An annually updated report from the Canadian Institute for Health
Information (CIHI) estimated that Canada’s total national spending on
health was $. billion dollars in , up from $. billion in
(CIHI, a). According to the report, this represents a real annual
increase of .% after controlling for general price inflation. e CIHI
report also estimated that total health spending accounted for .% of
Canada’s national gross domestic product (GDP) in , up from .%
of GDP in . On a per-capita basis, total national health expenditures
were estimated to be $, per person in , up from $, in .
International comparisons
On their own, these statistics tell us little about the performance of the
Canadian health care system in terms of economic efficiency. It is therefore
useful to compare Canadian spending figures in an international context.
At the international level, the relative costs of health insurance systems
are usually compared by estimating total publicly and privately funded
spending on health care as a percentage of the total national economic
output or gross domestic product (GDP). International data suggests
that Canada’s health care system is relatively expensive when compared

24 Canadian Health Policy Failures
Fraser Institute | www.fraserinstitute.org
with similar countries. Table displays total (public plus private) national
health spending as a percentage of domestic GDP for all OECD mem-
ber countries using the most recent -year period of available compa-
rable data.11 According to this analysis, Canada would rank, on average
over the period, as the seventh highest spender on health as a percentage
of its GDP. In a similar analysis using a more rigorous method, Esmail
and Walker () narrowed the comparison of Canada’s total health
spending relative only to OECD countries that have similar social goals
regarding medical insurance policy.12 ey also adjusted health spending
data to control for differences in the age profiles of domestic populations
that could skew international comparisons.13 eir most recent analysis
suggested that after adjusting for population age, in Canada ranked
Year to year percentage statistics and rankings are sensitive to fluctuations in GDP.
e -year average is used here to smooth the effects of changes in GDP on the statistics.
Esmail and Walker’s annually updated report excludes the United States and
Mexico because, with the exception of these two countries, all other OECD member
countries share Canada’s basic social goal for health care, which is a state guarantee
of universal health insurance coverage.
Countries with younger populations should be expected to spend proportionally
less because there should be less demand for medical goods and services. erefore,
a comparison of spending that does not adjust for the age characteristics of a popula-
tion will result in an underestimation of spending for younger populations. Research
indicates that % of lifetime per-capita health expenditures occur after the age of
(Brimacombe et al., ). According to data published by CIHI on provincial
and territorial government health care spending by age group, “Canadians younger
than the age of cost an estimated $, per person. From youths age to adults age
, spending averaged less than $, per person. ere was a pronounced increase
in per capita spending in the senior age groups: $, for age group to , $,
for to , $, for to and $, for age and older” (CIHI, a: xiv).
Similarly, data from the OECD confirms that health expenditures on seniors are signifi-
cantly higher than per-capita spending in general (OECD ). According to research,
Canada has the “seventh lowest proportion of seniors of the OECD countries com-
pared.” (Esmail and Walker, : ) For this reason, Canada should be expected to
face lower demands for health care, and therefore lower levels of health spending than
countries with older populations.

Table : Total public plus private health expenditure as a percentage of
gross domestic product (GDP), OECD, –, data not adjusted for
population age profile
Rank Country 10-year
average
2006 2005 2004 2003 2002 2001 2000 1999 1998 1997
1 United States 14.2 15.3 15.2 15.2 15.1 14.7 13.9 13.2 13.1 13 13.1
2 Switzerland 10.8 11.3 11.4 11.4 11.4 11 10.7 10.3 10.3 10.2 10.1
3 France 10.5 11.0 11.1 11 10.9 10.5 10.2 10.1 10.1 10.1 10.2
4 Germany 10.5 10.6 10.7 10.6 10.8 10.6 10.4 10.3 10.3 10.2 10.2
5 Austria 10.1 10.1 10.3 10.3 10.2 10.1 10 9.9 10.1 10 9.8
6 Iceland 9.4 9.1 9.4 9.9 10.4 10.2 9.3 9.5 9.6 8.9 8.1
7 Canada 9.4 10.0 9.9 9.8 9.8 9.6 9.3 8.8 8.9 9 8.8
8 Belgium 9.4 10.3 10.6 10.7 10.5 9 8.7 8.6 8.6 8.4 8.3
9 Norway 9.2 8.7 9.1 9.7 10 9.8 8.8 8.4 9.3 9.3 8.4
10 Portugal 9.1 10.2 10.2 10 9.7 9 8.8 8.8 8.2 8 8
11 Denmark 8.9 9.5 9.5 9.5 9.3 8.8 8.6 8.3 8.5 8.3 8.2
12 Sweden 8.8 9.2 9.2 9.2 9.4 9.3 9 8.2 8.3 8.2 8.1
13 Netherlands 8.6 9.5 – 9.5 9.4 8.9 8.3 8 8.1 8.1 7.9
14 Greece 8.5 9.1 9 8.3 8.5 8.2 8.4 7.8 8.6 8.4 8.4
15 Australia 8.4 8.7 8.8 8.8 8.6 8.6 8.4 8.3 8 7.8 7.6
16 Italy 8.3 9.0 8.9 8.7 8.3 8.3 8.2 8.1 7.8 7.7 7.7
17 New Zealand 7.8 8.0 – – 8 8.2 7.8 7.7 7.6 7.8 7.3
18 Japan 7.8 8.1 8.2 8 8.1 8 7.9 7.7 7.5 7.3 7
19 Spain 7.7 8.4 8.3 8.2 8.1 7.3 7.2 7.2 7.3 7.3 7.3
20 Finland 7.6 8.2 8.3 8.1 8 7.6 7.2 7 7.2 7.2 7.4
21 Hungary 7.6 8.3 8.5 8.2 8.4 7.6 7.2 6.9 7.2 7.1 6.8
22 UK 7.5 8.4 8.2 8 7.7 7.6 7.5 7.2 7.1 6.8 6.8
23 Ireland 7.0 7.5 8.2 7.5 7.3 7.1 6.9 6.3 6.2 6.2 6.4
24 Czech Rep. 6.9 6.8 7.1 7.2 7.4 7.1 6.7 6.5 6.6 6.6 6.7
25 Luxembourg 6.7 7.3 7.8 8.1 7.6 6.8 6.4 5.8 5.8 5.7 5.6
26 Slovak Rep. 6.1 7.4 7.1 7.2 5.9 5.6 5.5 5.5 5.7 5.6 5.7
27 Mexico 6.0 6.6 6.4 6.5 6.3 6.2 6 5.6 5.6 5.4 5.3
28 Poland 6.0 6.2 6.2 6.2 6.2 6.3 5.9 5.5 5.7 5.9 5.6
29 Turkey 5.2 5.7 5.7 5.9 6 5.9 5.6 4.9 4.8 3.6 4.2
30 Korea 5.1 6.4 5.9 5.4
5.4 5.1 5.2 4.5 4.4 4.2 4.2
Source: OECD, 2008.

26 Canadian Health Policy Failures
Fraser Institute | www.fraserinstitute.org
as the second highest spender on health (as a percentage of GDP) among
OECD countries with the same social goals (Esmail and Walker, ).14
ere are of course limitations to the conclusions that should be drawn
from simple international comparisons of health spending. More informa-
tion is required if such data is to be meaningful to policy makers, includ-
ing: an appreciation for the technical issues affecting data comparability15;
false assumptions defining high levels of spending on health as necessar-
ily negative16; and importantly, considerations of value for money. An
If the US and Mexico were to be included in this comparison, Canada would rank
third because, after age adjustment, the US still spends the most on health care as a
percentage of its GDP.
OECD data submitted by member countries is not perfectly comparable due to
differences in reporting compliance with OECD data definitions. Canadian expendi-
ture data, for example, does not include spending by automobile insurers on medical
rehabilitation or private-sector spending on occupational health care, whereas such
expenditures are included in the total reported by the US. ere may be other differ-
ences between jurisdictions, including incomplete reporting in some years. For details
see CIHI (a: –).
For instance, on the basis of such comparisons, some health policy experts have
argued that Canada’s government-run, single-payer health insurance system is less
expensive than systems that permit greater scope for private payment or insurance
for core health services (particularly the United States). is falsely assumes that the
quantity and quality of health care received across countries is the same in these
comparisons. To illustrate this point, consider that in , Ethiopia spent .%of its
GDP on health care, or . percentage points less than Canada, which spent .%
of its GDP on health care in the same year (WHO, ). Yet, on a per-capita basis,
Ethiopians spent only the equivalent (international currency adjusted) of $ per per-
son on health care in compared to $, per person in Canada (WHO, ).
ere is no doubt that Ethiopia’s health care system is not producing the same quality
or quantity of medical goods and services as the Canadian system. Moreover, research
shows that wealthier societies tend to spend proportionally more of their income on
health care. is is because people in wealthy countries have proportionally more
disposable income to devote to health care after other necessities like food, clothing,
housing, transportation, education, etc. (Gerdtham and Jönsson, ). As people
become wealthier, they simply have the capacity to spend a higher percentage of their
income on improving their health and extending their lives without sacrificing their
other needs and preferences. High levels of spending on medical goods and services
might simply reflect consumer preferences for better health versus alternative uses of

Chapter 1: Unsustainable costs 27
www.fraserinstitute.org | Fraser Institute
assessment of the economic value associated with the Canadian health
care system is considered in more detail in the subsections that follow.
Sustainability
Aside from the comparative overall level of health spending, an additional
concern when evaluating the macro-level financial performance of a health
care system is the overall growth rate in health spending. From a long-
term, macro-level perspective, sustainable health care financing requires
health insurance systems to have enough current and expected future
revenues to pay for current and expected future health care expenditures.17
their money. Another false but common assumption is to view health spending only
as a cost, without consideration of benefits received. e improved quality and length
of life that good health makes possible is actually one of the highest forms of wealth—
much more valuable than televisions, automobiles, and computers, for instance. Yet,
when we spend our money on any of these other things, we consider such purchases
to be contributing to our national economic wealth. It is therefore invalid to assume
that merely spending a larger percentage of GDP on health care is necessarily bad.
Pauly (, ) makes similar arguments about US health care spending levels.
Sustainability problems tend to be associated only with insurance plans that dis-
tort normal price signals by over-insulating consumers from the cost of consuming
insured goods and services, problems which are in turn more commonly associated
with health insurance systems characterized by a single insurer occupying a very large
share of the market. Sustainability problems are not normally a systemic concern in
pluralistic insurance systems because any financial problems caused by expenditures
exceeding revenues within any particular insurer are limited and contained, and do not
affect the viability of the entire market. In competitive pluralistic insurance markets,
spending and consumption are also typically influenced by price signals which create
sustainable supply and demand dynamics. Concerns about the financial sustainabil-
ity of the Canadian health care system are appropriate because it is characterized by
the absence of price signals for consumers, the politicization of spending, redistribu-
tive tax financing, and the system-wide monopoly provision of medical insurance by
government. Moreover, in a government-run system, the sustainability crisis is not
always fully obvious to the public because costs can be shifted to future generations
or to a minority of the taxpaying population.

28 Canadian Health Policy Failures
Fraser Institute | www.fraserinstitute.org
Using this definition, a growing number of researchers have suggested
that the Canadian health care system faces significant systemic challenges to
its financial sustainability, including government commissions in Quebec
(Clair, ; Menard, ), Alberta (Mazankowski, ), Saskatchewan
(Fyke, ), and the Senate (Kirby, ), as well as a report by the British
Columbia Ministry of Finance (Taylor, ). Other analyses by various
think tanks include the Conference Board of Canada (Brimacombe et al.,
), C.D. Howe Institute (Robson, ), Atlantic Institute for Market
Studies (Crowley et al., ), Organisation for Economic Co-operation
and Development (OECD, ), PriceWaterhouseCoopers (PWC,
), Institute for Research on Public Policy (MacKinnon, ), Fraser
Institute (Skinner, a, a, a, b, c; Esmail, ;
Mullins, a; Skinner and Rovere, , a, a), and most
recently University of Calgary, School of Public Policy (Di Matteo and
Di Matteo, ).
According to the most recent update to an annual analysis of the sus-
tainability of government health spending in Canada (figure ), over the
-year period between the fiscal years / and /, on average
GHEX TAREV GDP
7.3%
Figure 1: National average of 10-year provincial annual percentage
growth rates for government health expenditure (GHEX) and total avail-
able revenue (TAREV), 1998/99–2007/08; and gross domestic product
(GDP), 1998–2007
5.9%
5.8%
Source: Reproduced from Skinner and Rovere, 2008.
Note: To make Quebec comparable to other provinces, the extra tax room ceded to the
province by the federal government for policy areas that are under federal jurisdictions in
other provinces has been removed from the calculation of TAREV. TAREV growth rates for
Newfoundland & Labrador and Nova Scotia have been adjusted to remove the one-year
increase in revenue from the Atlantic Accord.
1
2
3
4
5
6
7
8
Annual average percentage growth
7.7%
6.3%
6.1%
Chapter 1: Unsustainable costs 29
www.fraserinstitute.org | Fraser Institute
across all Canadian provinces, government health expenditures grew at
a rate of .% annually, compared to .% for total available provincial rev-
enue from all sources, and .% for gross domestic product (Skinner and
Rovere, a). According to this research, in nine of provinces, gov-
ernment health spending has grown faster on average than revenue over
the last years. e only exception was the province of Alberta, which
kept the pace of health spending growth just slightly below the growth of
revenue over the trend period. e economic recession of – is
expected to worsen this scenario, even for provinces like Alberta.
Earlier research using government sources of data has shown that the
longer-term experience is similar (Skinner, b). Table displays the
nominal and real (inflation-adjusted) figures for national GDP and gov-
ernment health expenditures between and , as well as the cor-
responding annual growth rates. e comparator variables in this analy-
sis differ from the approach used in annual studies by Skinner (a,
a) and Skinner and Rovere (, a, a) because compa-
rable provincial revenue data was not available for the whole time period.
erefore, for the longer-term analysis, GDP was used by proxy following
the rationale that government revenues are ultimately taken from GDP
and cannot grow faster than GDP indefinitely. According to this analysis,
if health spending grew faster than GDP over the long run, it was there-
fore assumed to have grown faster than revenue too. e data show that
government health expenditures in Canada have tended to grow at a faster
average annual pace than GDP for the entire -year period for which data
is available. Figure illustrates that, with temporary interruptions in the
trend, government health expenditure has consumed an increasing share
of GDP over the period, going from .% in to .% by . is
analysis suggests that in Canada, government spending on health care
has grown faster on average than the absolute ability of the government
to pay for it over this period.
ese growth trends have resulted in health spending proportionally
reducing the revenue remaining for other government priorities over time.
To illustrate the fiscal challenge this creates for governments, a recent
edition of the only annually updated analysis of this question (Skinner
and Rovere, ) showed that the percentage of total revenue (from all

Table : Long-term annual growth in Gross Domestic Product (GDP) and
government health expenditure (GHEX), Canada, –
Year GDP,
millions
current $
Annual
% change
GDP 1992,
constant
millions $
Annual
% change
GHEX,
millions
current $
Annual
% change
GHEX,
millions
constant 1992 $
Annual
% change
1975 173,621 - 503,249 - 9,300 - 26,957 -
1976 199,994 15.2 539,067 7.1 10,817 16.3 29,157 8.2
1977 220,973 10.5 552,433 2.5 11,845 9.5 29,612 1.6
1978 244,877 10.8 561,644 1.7 13,041 10.1 29,909 1.0
1979 279,577 14.2 587,347 4.6 14,552 11.6 30,572 2.2
1980 314,390 12.5 599,981 2.2 16,842 15.7 32,141 5.1
1981 360,471 14.7 612,005 2.0 19,943 18.4 33,858 5.3
1982 379,859 5.4 581,714 -4.9 23,447 17.6 35,906 6.0
1983 411,386 8.3 595,349 2.3 26,080 11.2 37,742 5.1
1984 449,582 9.3 623,553 4.7 27,957 7.2 38,775 2.7
1985 485,714 8.0 647,619 3.9 30,095 7.6 40,127 3.5
1986 512,541 5.5 656,262 1.3 32,529 8.1 41,650 3.8
1987 558,949 9.1 685,827 4.5 35,055 7.8 43,012 3.3
1988 613,094 9.7 722,988 5.4 38,163 8.9 45,003 4.6
1989 657,728 7.3 739,020 2.2 41,911 9.8 47,091 4.6
1990 679,921 3.4 728,747 -1.4 45,446 8.4 48,709 3.4
1991 685,367 0.8 695,804 -4.5 49,382 8.7 50,134 2.9
1992 700,480 2.2 700,480 0.7 51,694 4.7 51,694 3.1
1993 727,184 3.8 714,326 2.0 51,980 0.6 51,061 -1.2
1994 770,873 6.0 755,758 5.8 52,599 1.2 51,567 1.0
1995 810,426 5.1 777,760 2.9 52,791 0.4 50,663 -1.8
1996 836,864 3.3 790,240 1.6 52,877 0.2 49,931 -1.4
1997 882,733 5.5 820,384 3.8 55,002 4.0 51,117 2.4
1998 914,973 3.7 842,517 2.7 59,028 7.3 54,354 6.3
1999 982,441 7.4 889,087 5.5 63,056 6.8 57,064 5.0
2000 1,076,577 9.6 948,526 6.7 68,995 9.4 60,789 6.5
2001 1,108,048 2.9 951,931 0.4 74,658 8.2 64,139 5.5
2002 1,152,905 4.0 968,828 1.8 79,782 6.9 67,044 4.5
2003 1,213,408 5.2 992,157 2.4 86,267 8.1 70,537 5.2
2004 1,290,788 6.4 1,035,945 4.4 92,054 6.7 73,880 4.7
2005 1,371,425 6.2 1,077,317 4.0 98,795 7.3 77,608 5.0
AVG 7.2 2.6 8.3 3.6
Source: Skinner, 2007b; Statistics Canada, 2006b; CIHI, 2005b; calculations by the author.

Chapter 1: Unsustainable costs 31
www.fraserinstitute.org | Fraser Institute
Percentage of GDP
4
5
6
7
8
1979
1981
1983
1985
1987
1989
1991
1993
1995
1997
1999
2001
2003
2005
1975
1977
Figure 2: Government health expenditure (GHEX) as a percentage of GDP,
Canada, 1975–2005
Source: Skinner, 2007b; Statistics Canada, 2006b; CIHI, 2005b; calculations by the author.
sources) consumed by health spending in each of the provinces increased
substantially between the fiscal years / and /. In order
to illustrate this, data was obtained from Statistics Canada’s Financial
Management System database and is displayed in figure a. e data show
provincial government health expenditures as a percentage of total pro-
vincial revenue from all sources for the fiscal years /, /, and
/. e bars in the graph show that health spending has accounted
for a progressively larger share of provincial revenues in every province
over this time period. Figure b looks at government health expenditure
more narrowly as a percentage of available revenues only. Of course, some
government revenue is “locked in” to paying off past debts, so it is not
currently available for program expenditures like health care. erefore,

0
8
16
24
32
40
AB BC NL NS ON PEI QC SK MB NB
Percentage of total revenue
Figure 3a: Provincial government health expenditure as a percentage of
total provincial revenue from all sources, 1996/97/, 2001/02, 2005/06
1996/97
2001/02
2005/06
22.4
27.8
27.8
30.3
36.6
36.6
20.6
31.2
22.1
27.6
31.8
32.4
34.3
35.0
38.2
22.5
27.8
30.5
24.4
28.8
27.9
23.4
29.5
31.1
27.5
29.1
33.4
24.3
28.3
30.1
Source: Skinner and Rovere, 2006; Statistics Canada, 2006a.
AB BC MB NB NL NS ON PEI QC SK
Percentage of total revenue
Figure 3b: Government health expenditure (GHEX) as a percentage of
total available revenue (TAREV) and available own-source revenue
(AOREV), 2007/08, by province
10
GHEX % of AOREV
GHEX % of TAREV
Source: Skinner and Rovere, 2008a; Statistics Canada, 2008b.
31.5
44.2
32.3
40.4
72.3
42.5
51.7
34.0
34.5
44.5
43.4
28.9
36.7
58.4
37.6
38.2
64.3
59.6
59.8
35.0
30
10
50
70
Chapter 1: Unsustainable costs 33
www.fraserinstitute.org | Fraser Institute
health care spending accounts for a much higher percentage of the actual
revenue that is currently available for program spending. Figure b shows
data for government health expenditures as a percentage of total available
revenues (including federal transfers) in each province, and also sepa-
rately as a percentage of provincial own-source revenue (federal transfers
excluded). is analysis illustrates that the provinces are facing a deep
financial crisis due to health spending pressures. As of , government
health spending already consumes between .% (Alberta) and .%
(Nova Scotia) of available provincial own-source revenues. Due to the fact
that the growth rate in government health spending continues to outpace
the growth of revenue in the provinces, this can be expected to rise to
even higher percentages in the future.
One way to illustrate the implications for the sustainability of govern-
ment health spending is to project observed trends forward into the future.
For example, in an annually updated projection analysis based on the most
recent -year trend (/ to /), Skinner and Rovere (a) esti-
mated that the average annual growth in government health spending in six
of provinces was on pace to consume more than half of total revenue from
all sources by , if the observed trends continued unabated. It is impor-
tant to note that future projections based on the trends indicated by these
data are built on cautious expectations because the data are not adjusted to
account for the impact of an aging population. All else being equal, as the
population ages the growth in health expenditure should accelerate faster
than projected above because research has shown that aging is associated
with greater demand for health care. Future revenue growth could also be
slower than recent trends because an aging population will proportionally
reduce the size of the working population from which income taxes (a large
source of revenue for governments) are drawn. e provincial revenue data
used in these analyses include all sources (e.g., federal transfers) and thus
represent the maximum provincial government capacity to pay for public
health spending.
Spending and revenue trends are creating a serious, growing future fund-
ing deficit for health care. Using Statistics Canada’s micro-simulation model
and detailed data from Statistics Canada and the Canadian Institute for
Health Information, one study estimated the unfunded liability associated
34 Canadian Health Policy Failures
Fraser Institute | www.fraserinstitute.org
with government obligations to pay for health care in the future (Palacios
and Veldhuis, ). e results suggested that as of , Canadian gov-
ernments faced future funding obligations for health care that exceeded
expected future revenues by $ billion (Palacios and Veldhuis, ), or
% of Canada’s total economic output (GDP) of just over $. tril-
lion (Statistics Canada, b). According to the researchers, the unfunded
liability for future public health care obligations grew by .% between
and , rising from $. billion to $. billion over the period
(Palacios and Veldhuis, ).
Other researchers are not persuaded that the growth in government
spending on health is unsustainable. For example, Boychuk (), Guyatt
et al., (), Dhalla (), and Béland () have all suggested that
relatively faster increases in health expenditures over the last few years are
merely a “catching-up” response to earlier spending restraint, and there-
fore expectations about future growth rates should not be based on trends
observed since the s. is argument is based on the observation that
by , provincial spending on health care was only at the same level it
would have been had there been no cutbacks in the s and spending
had remained at inflation-adjusted levels. However, analyses cover-
ing broader time periods suggest that the early to mid s represented
only a temporary halt to a long-term health care spending growth trend
(Skinner, b, c). Annual data covering the years to
(figure ) show that, except for a brief period in the early to mid-s,
provincial government spending on health has grown continuously in real
terms, even after adjusting for inflation and population growth.
Researchers have also argued that reductions in federal transfers are
the primary cause of the high rates of growth observed for provincial
health spending since the late s (Boychuk, ; Guyatt et al., ;
Evans, ; Dhalla, ; Béland, ). However, Esmail et al. ()
examined data on federal transfers finding that the federal government
provided the provinces with an estimated $. billion in cash transfers
for health care between / and /. e average annual rate of
growth in federal cash transfers to the provinces for health over this period
was .%. At the same time, it was estimated that the rate required to
keep health spending growing at the same pace as population and inflation

Chapter 1: Unsustainable costs 35
www.fraserinstitute.org | Fraser Institute
was only .%. Based on this data, it was further estimated that between
/ and /, Ottawa increased its cash transfers for health to the
provinces by $. billion more than needed to compensate for popula-
tion growth and inflation over the same period.
ere is also other case evidence indicating that in Ontario, for exam-
ple, federal transfers increased .% in absolute terms over the period
/ to /, growing from .% to .% of total provincial
revenue (table ). Despite the boost to provincial revenues from federal
transfers over this period, provincial government health expenditures in
Ontario still increased by a larger magnitude (.%) than total revenue
(.%) over the same period. e difference in growth resulted in health
expenditures accounting for a larger share of total provincial revenue,
Figure 4: Real (inflation-adjusted) per-capita (population-adjusted)
provincial government health expenditures, Canada, 1975–2008
Dollars
0
500
1,000
1,500
2,000
2,500
3,000
1979
1981
1983
1985
1987
1989
1991
1993
1995
1997
1999
2001
2003
2005
1975
1977
Source: CIHI, 2008a (Table A.2.5: 103).
2007

36 Canadian Health Policy Failures
Fraser Institute | www.fraserinstitute.org
going from .% in / to .% by /. e available evidence
does not seem to support the view that reductions in federal transfers
are causing unsustainable growth rates in provincial government health
spending.
Some researchers have also suggested that while the spending and rev-
enue trends observed since the mid s cannot be sustained indefinitely,
high rates of growth in government health spending might be “sustain-
able for the foreseeable future” without changing the financial structure
of the Canadian health care system if the public is willing to pay more for
health care through higher taxes, or to accept proportionately less spend-
ing on other functions of government (Dhalla, : ). Other research-
ers (Skinner, c) have criticized this argument on the grounds that it is
based on a series of implausible assumptions. For instance, the argument
assumes that future demand for additional non-health care spending will
continually decline relative to the demand for health care spending. It also
assumes that individual demand preferences for health care spending ver-
sus non-health care spending are universally similar. e argument also
does not acknowledge the economic limitations of chasing unrestrained
Table : Revenues and expenditure by category, Ontario, fiscal years
/–/, millions of current dollars
1988/89 1989/90 1990/91 1991/92 1992/93 Total % growth,
1988/89–1992/93
Total rev. from all sources $41,937 $46,829 $48,783 $46,642 $47,099 12.3%
Prov. own-source rev. $36,550 $41,093 $42,667 $40,014 $39,163 7.1%
Implicit federal transfer $5,387 $5,736 $6,116 $6,628 $7,936 47.3%
Gov’t. health expenditures $13,131 $14,790 $15,812 $17,932 $18,180 38.5%
Gov’t. health expenditures
as % of total rev.
31.3% 31.6% 32.4% 38.4% 38.6%
Source: Skinner, 2007c; Statistics Canada, 2006a.

Chapter 1: Unsustainable costs 37
www.fraserinstitute.org | Fraser Institute
spending with tax increases.18 It also assumes that a continually increasing
tax burden would be politically acceptable beyond the short term. Finally,
the unacknowledged alternative to tax increases is to constrain the growth
in health spending by centrally restricting or delaying access to publicly
insured goods and services by reducing the scope of public insurance
benefits and restricting the supply of and/or imposing price controls on
medical system inputs. e long-term feasibility of this approach is also
probably doubtful.
Finally, some experts have argued that unsustainable rates of growth
in government health spending are primarily driven by the excessive cost
of new medical technologies, in particular new drugs, and not the struc-
ture of Canadian health insurance policy (Evans et al., ; Morgan and
Hurley, ; Lee, ; Sanger, ). is argument is based on empiri-
cal observations that government spending on all types of prescription
drugs (patented and non-patented) has at times increased faster than
any other component of health spending, and new medicines also tend
to be more expensive compared to older generations of drugs and other
health treatments. On the other hand, Skinner and Rovere (b, b)
argue that patented prescription drugs have never accounted for a large
enough percentage of total health care costs to have a major impact on
overall growth rates in government spending on health. According to
their analysis, spending on all types of drugs (patented and non-patented,
prescription and non-prescription) together accounted for .% of total
government plus private health spending in Canada in (Skinner and
In a analysis of the introduction of the Ontario health premium (i.e., income
surtax), Skinner (a) demonstrated the problems with the logic of using tax
increases to “chase” after expenditure growth. e paper projected current trends
to show that in order for provincial health spending to remain at a constant percent-
age of provincial revenue, the new tax would have to increase to times its original
assessment cost in a decade without the increase or introduction of other taxes in its
place. is, of course, was unsustainable, as it would put taxes on pace to consume
ever-increasing shares of real income. In the meantime, increasing taxes would also
cause GDP growth to slow, ultimately constraining the tax base and reducing the pub-
lic money available for health or non-health related spending.

38 Canadian Health Policy Failures
Fraser Institute | www.fraserinstitute.org
Rovere, b).19 But, prescription drugs (patented and non-patented)
in particular accounted for only .% of government spending on health
care in the same year (Skinner and Rovere, b). Historical data also
show that the share of government health spending accounted for by
prescription drug expenditures has also been much smaller in the past.
Furthermore, Skinner and Rovere (b) present data showing that pat-
ented types of prescription drugs in particular accounted for only .%
of total annual government spending on health care in Canada in
and still smaller percentages in past years. erefore, they conclude that
even high growth rates for spending on patented drugs would not have
large statistical effects on the overall growth rate for total government
health expenditure.
Skinner and Rovere (b, b) also analyzed government health
spending according to the use of funds spent. e analysis shows that
spending between and on all the non-drug components of
health care consistently grew at an unsustainable rate while accounting
for between .% and .% (between and ) of total govern-
ment spending on health. On an average basis, spending on health pro-
fessionals, hospitals and institutions, and all other areas (including public
health, administration, and research) grew at an annual rate of .%, .%,
and .%, respectively. Over the same period, these annual growth rates
are between . and . times higher than the average annual growth in
national gross domestic product (GDP) of .%; between . and . times
higher than the average annual growth in general inflation (CPI) of .%;
and between . and . times higher than the average annual growth in
consolidated available provincial revenues from all sources of .%. is
means that even if governments spent zero on drugs, government spend-
ing on all other medical goods and services were still rising at an unsus-
tainable rate over this period.
CIHI data for drug expenditures accounts only for outpatient drugs. Drugs admin-
istered in hospital are counted under hospital expenditures and are not shown sepa-
rately. However, most drugs administered in hospital are likely to be for anesthesia or
to control pain and infection, which are almost always generic drugs.

Chapter 1: Unsustainable costs 39
www.fraserinstitute.org | Fraser Institute
Skinner and Rovere (b, b) also present data showing that
price inflation for existing patented drugs is not to blame for unsustainable
growth rates in government spending on health. e Patented Medicine
Prices Review Board (PMPRB), Canada’s federal drug-price regulator,
confirms that on average, post-market prices for patented drugs are not
growing over time. e PMPRB uses the Patented Medicine Price Index
(PMPI) to monitor the price trends of patented drugs in Canada. Since
, the PMPI has been used to measure the average annual change
in prices of patented drugs using a basket of products already on the
market (PMPRB, ). PMPRB data show that post-market prices for
patented drugs in Canada were stable or declining over the most recent
-year period, and that prices for patented drugs in Canada have actually
decreased in nominal terms in six of the last years. Overall, the aver-
age annual growth in prices for the entire -year period was only .%.
e PMPRB also compares the PMPI to the Consumer Price Index (CPI)
in order to determine the year-to-year changes in existing patented drug
prices in comparison to changes in general inflation for other goods and
services (PMPRB, ). Over the entire period from to ,
is the only year where the average annual price growth of patented drugs
exceeded general price inflation. e average annual percentage growth
in the CPI (.%) over this period exceeded the annual percentage growth
in the PMPI (.%) by . percentage points. By implication, this means
that prices for existing patented drugs are increasing at an even slower
rate than they are allowed to grow under federal price controls that per-
mit annual price increases matching the general rate of inflation (PMPRB,
). It also means that, after adjusting for inflation, prices for existing
patented medicines have declined in real terms in of the last years.20
Skinner and Rovere (b, b) also separately looked at other data from the
PMPRB comparing the average price of patented drugs in Canada to prices for the
same drugs in a select group of other countries. Overall, the PMPRB data on average
and median international prices suggests that patented drug prices in Canada are not
excessive compared to similar countries, and are therefore not especially to blame for
unsustainable growth in overall government health spending in Canada.
40 Canadian Health Policy Failures
Fraser Institute | www.fraserinstitute.org
Despite a multitude of excuses, the fact remains that since Canadian
Medicare was introduced in , government health spending in Canada
has always grown faster than the revenues available to governments, faster
than the overall growth in the economy as a whole, and almost always
faster than the general rate of inflation for other goods and services in the
economy. e only time when government health spending has slowed is
when governments have restricted public insurance coverage and rationed
access to medically necessary goods and services. Unsustainable growth
in government health spending is not caused by a lack of federal funding
for provincial health care systems. It is not caused by the price of drugs,
or the numbers of hospitals and physicians. e problem is not what we
spend our health care dollars on; the real problem is the flawed design of
health insurance in Canada.
The hidden price of Canadian health insurance
All available evidence suggests that Canadians are paying more for, but
getting less from, the government health insurance system over time. An
example of this is contained in a analysis examining the Ontario
budget (Skinner, b). at study found that the provincial govern-
ment had, at the time, underestimated the future long-term, annual aver-
age real (i.e., adjusted for inflation) growth in public spending on health
care by about .% per year, based on the most recent five-year trend. e
study showed that public financing of health care in Ontario was not on a
sustainable track. Furthermore, the study argued that provincial propos-
als for health policy reform, including a new progressive income-based
surtax (misleadingly labeled a “health premium”), would not adequately
address the difference between relative future growth rates for total rev-
enues and public health care spending. It was calculated that Ontario’s
new “health premium” tax would need to triple by and grow times
as large only a decade after its introduction in order to keep provincial
revenues growing at the same pace as public health care spending. From
the perspective of patients, this enormous tax increase was expected to
occur at the same time as the province was reducing the scope of public

Chapter 1: Unsustainable costs 41
www.fraserinstitute.org | Fraser Institute
health insurance coverage by making some previously insured services
ineligible for public reimbursement, and by refusing or delaying coverage
for new medical technologies. e province has since left the new tax in
place; but, in response to political backlash, the government has ruled out
future increases in rates, reluctantly acknowledging that it cannot rely on
such measures to fund future growth in public health care expenditures.
Yet, the cost and sustainability of government health spending has not
actually become a political issue until more recently. is is because many
Canadians have remained unaware of the full cost of government spending
on public health insurance. First, health care consumption in Canada is
financed through general taxes and therefore appears free at the point of
consumption or use. User fees and extra billing are prohibited by the CHA
and private payment is effectively banned by provincial policies. ere are
simply no direct monetary price signals to make Canadian patients aware
of the cost of the health care they receive. Second, research by Ferguson
(b) has shown that for much of Medicare’s history, provincial gov-
ernment spending has been subsidized by borrowing, so the full cost of
government health insurance has not been immediately appreciated by
taxpayers in general. My own analysis of this issue is displayed below.
Figure shows budget deficits as they occurred in each of the provinces
between (earliest available data) and (most recent available
data). e annual budget deficits in each province are grouped by the year
in which they occurred and stated as a percentage of total revenue in the
province each particular year.21 Key dates marking the introduction of
government hospital insurance (Medicare Phase I, ), full government
health insurance (i.e., extending public funding to include physician ser-
vices) in every province (Medicare Phase II, ), and the implementa-
tion of the Canada Health Act (CHA) are shown. e data show that the
full cost of government spending was not paid out of current revenues
over most of the history of Medicare, but was instead deferred to future
generations by accumulating government debt. ere is also a correlation
between the full introduction of Medicare by in all provinces and
Provincial deficits are not individually identified in each year due to lack of avail-
able space.

−45%
−30%
−15%
0%
Figure 14: Provincial Government Annual Budget Deficits, Canada, 1961
to 2007
Figure 5: Provincial government annual budget deficits, Canada, 1961–2007
Medicare
Phase I, 1961
Medicare
Phase II, 1970
Canada
Health Act, 1985
Timeline1961
2007
Source: Statistics Canada, 2007a, 2007c. Author’s calculations.
Annual deficit, percentage

Chapter 1: Unsustainable costs 43
www.fraserinstitute.org | Fraser Institute
the increasing frequency and severity of annual budget deficits in the
years following.
Policy makers eventually resorted to tax increases to pay for the inter-
est on the accumulating debt and the entrenched annual budget obliga-
tions, including public health insurance. e data in table illustrate how
the personal tax burden has risen in Canada since the introduction of
government health insurance. Researchers (Veldhuis and Walker, ;
Palacios and Veldhuis, ) have calculated the average total tax bill
and average cash income22 before taxes for Canadian families in
(the earliest year of data available), (the year before the extension of
public insurance coverage to physicians in all provinces), and . Table
shows that the average tax burden (i.e., average tax bill as a percentage of
average cash income) has increased from about one third of average cash
income in to almost half of average cash income by .
Despite the fact that the tax burden has risen, on average, since the
introduction of Medicare, the majority of the population has personally
been disproportionately insulated from the full cost of paying for the pub-
lic health care system. Redistributive taxation leads many Canadians to
underestimate the individual price they each pay for public health insurance.
Cash income equals total income minus non-cash items such as interest accu-
mulated on income from pension funds but not cashed by the recipient and therefore
subject to deferred taxation.
Table : Changes in average tax burden for Canadian families following
adoption of universal government health insurance coverage of hospital
and diagnostic services () and physician services ()
Year Average cash family
income, current $
Average family tax
bill, current $
Average tax bill,
% average cash income
1961 $5,000 $1,675 33.5%
1969 $8,000 $3,117 39.0%
2007 $83,775 $38,992 46.5%
Source: Veldhuis and Walker, 2006; Palacios and Veldhuis, 2008. Calculations by the author.
44 Canadian Health Policy Failures
Fraser Institute | www.fraserinstitute.org
Canadian income earners also bear different tax burdens based on the level
of their earnings. Given the nature of our tax system, higher income earn-
ers bear a greater proportion of the tax burden than lower income earners,
and thus contribute proportionally more to our public health care system.
In order to determine a more precise estimate for the cost of public
health insurance for the average Canadian family in , researchers deter-
mined how much an average family is expected to contribute (in taxes) to
all three levels of government. Under their analysis, the percentage of the
family’s total tax bill that pays for public health insurance is assumed to
match the share of total government (federal, provincial, and territorial)
tax revenues dedicated to health care, which was .% in the fiscal year
ending in (Esmail and Palacios, ). Table shows the estimated
price paid in taxes for public health care spending by income decile (%
of the population of Canadian families are in each decile, organized from
lowest income decile to highest income decile). For comparison, table also
displays the per-capita figure for public health care spending. According to
this calculation, the % of Canadian families with the lowest incomes paid
an average of $ for public health care insurance to cover the whole fam-
ily. is is a significant underpayment considering the average or per-capita
cost (or the expected use per person) in was $,. By contrast, the
top % of income earners in Canada paid a little more than $, per
family—a significant overpayment compared to per-capita costs.

Table : Estimated tax price for government spending on health care in Canada, : Distribution of total tax burden (all sources, all
levels of government) by family income decile
Family income declie 1st 2nd 3rd 4th 5th 6th 7th 8th 9th 10th
Ave.annual cash income $11,309 $24,271 $32,866 $41,637 $51,298 $64,415 $78,430 $96,217 $122,321 $232,739
Ave. annual total taxes $1,717 $4,756 $9,787 $15,244 $21,491 $27,602 $34,255 $43,637 $56,913 $130,719
Ave. annual tax price for public health
spending
$389 $1,076 $2,214 $3,449 $4,862 $6.245 $7,750 $9,873 $12,877 $29,575
Per-capita health care costs $3,498
Source: Esmail and Palacios, 2008.
www.fraserinstitute.org | Fraser Institute
Chapter
Shortage of medical professionals
One of the most frequently expressed concerns about the performance
of the Canadian health care system is that there is a growing difficulty in
accessing physician services. Access problems are typically defined as a
difficulty in retaining the services of a regular family physician or general
practitioner (GP), difficulty or delays in getting an appointment with a
GP or physician specialist, or difficulty receiving treatment. Where these
problems exist in Canada, they appear to be partially the result of a short-
age in the overall supply of physicians relative to public expectations or
demands.
ere are various ways of assessing whether the supply of physicians
in Canada is adequate and whether changes in this supply are affecting
access for patients. One approach is to study access to physicians relative
to historical Canadian norms for obtaining physician services. Since the
establishment of Medicare in Canada, it has been normal for most of the
population to receive primary physician care by “enrolling” in an indepen-
dent private (or group) professional office-clinic of a general practitioner
or “family doctor” located in their local community. However, recent data
suggests that this traditional means of obtaining primary physician ser-
vices is becoming more difficult. According to the Canadian Community
Health Survey conducted by Statistics Canada in , it was estimated
that more than . million Canadians (about % of the Canadian
population aged years and older) were unable to find a regular fam-
ily physician (or general practitioner) (Statistics Canada, a). More
recently, an update to the survey found that access to primary care physi-
cians might be getting worse over time:
48 Canadian Health Policy Failures
Fraser Institute | www.fraserinstitute.org
In , % of Canadians aged or older, about . million
people, reported that they did not have a regular medical doctor,
either because they were unable to find one, or because they had
not looked. is proportion was up percentage points since the
/ National Population Health Survey (NPHS). Of these
individuals, %, or . million people, reported that they in fact
had some place to go. Of these estimated . million people, %
sought treatment in a walk-in or appointment clinic. Another %
went to a hospital emergency room, while about % went to a
community health centre. e remaining % chose to use other
types of health care facilities or services such as hospital outpatient
clinics, telephone health lines or doctor’s offices … Just under .
million Canadians (% of the population aged or older) reported
that they could not find a regular doctor in … Provincially,
% of the population in Prince Edward Island and Quebec said
they could not find a doctor, significantly higher than the national
average of %. (Statistics Canada, a)
In practice, general practitioners (GPs) or family physicians essentially
act as gatekeepers to the health system. Patients are referred to diagnostics
and specialist treatment usually only after being examined by a GP. GPs
are also the source of access to prescription medicines and sometimes
refer patients directly to hospital admission. erefore, access to primary
care physicians can conceivably serve as a rough proxy for more generally
estimating actual access to insured medical care in Canada or, in other
words, effective insurance coverage. Details of the Statistics Canada survey
data discussed above make it possible to get a more precise understand-
ing of the scope of any problems that do exist in accessing physician ser-
vices in Canada. Table displays various population estimates for each
of the response categories used in the survey data published by Statistics
Canada. e categories allow us to separately define the level of access to
primary care physicians reported by respondents. e totals in cells B
(A+A+A) and B in the table show that in , approximately .%
of the Canadian population aged years and older reported that they
either could not obtain access to a primary care physician at all (.%),

Table : Access to primary care physicians as a proxy for estimating “effective”
access to insured health services in Canada, , population aged and older
Explanation of data
and calculations
Data cell
coordinates
A B Percentage of
population
Estimated population, aged 12 and older.
Calculation: B2 + B3 + B4
1 27,652,000 100.00%
StatCan reported population “has access
to regular medical doctor”
2 23,568,000 85.23%
StatCan reported population that
“haven’t looked” for a regular GP
3 2,410,000 8.72%
StatCan reported population that “cannot
nd” a regular GP: with or without alterna-
tive access to primary care
4 1,674,000 6.05%
Estimated population “without regular”
GP. Calculation: B2 + B3
5 4,084,000 14.77%
StatCan estimate of population
without regular GP, but with al-
ternative access to primary care.
Calculation: 78% of B3
6 3,185,520 11.52%
Alternative access for above:
Percentages reported by StatCan
-
Walk-in clinic: 64% of B6. 7 2,038,733 7.37%
Hospital ER: 12% of B6. 8 382,262 1.38%
Community clinic: 10% of B6. 9 318,552 1.15%
Hospital outpatient clinics, telehealth,
other: 14% of B6.
10 445,973 1.61%
Estimated population with only urgent/
emergency or very limited access to
primary care.
Calculation: A8 + A9 + A10
11 1,146,787 4.15%
Estimated population with no access to
primary care. Calculation: B5 – B6
12 898,480 3.25%
Source: Statistics Canada, 2008a.
Note: StatCan reported that of an estimated 4.1 million people who responded that they did not have a regular medical doctor, 78% or
3.3 million people also responded that they had an alternative place to get primary care. However, 78% of 4.1 million equals roughly
3.198 million. The reason for the decimal rounding discrepancy in StatCan’s estimates is not clear. I have chosen to apply the 78% g-
ure published by StatCan to the subcategory gures published by StatCan (cells B3 and B4), which produces a population estimate of
3,185,520 for this subcategory of respondents.

50 Canadian Health Policy Failures
Fraser Institute | www.fraserinstitute.org
or could only find access to a primary care physician at a hospital emer-
gency room (.%), community health centre (.%), or other unspeci-
fied points of access (.%). ese figures can probably be safely extrapo-
lated to the entire population because it is doubtful that children under
years of age are likely to obtain independent access to primary care that
is unavailable to their parents or older siblings.23 A review of the survey
methodology published by Statistics Canada indicates that the results
are probably an accurate representation of general Canadian public opin-
ion regarding personal access to primary care physicians.24 Nevertheless,
some caution is recommended in interpreting the results because the
survey data is based on the subjective perceptions of the respondents
about their access to physicians, which may or may not reflect their actual
access to physicians if it were possible to objectively measure such access.
Another way to assess the supply of physicians is to compare Canadian
data internationally. Table shows that in 25 there were . practicing
physicians per , people in Canada (OECD, ). Canada’s supply of
physicians was below the . per , person average of the other OECD
countries in . e number of physicians per population among all
OECD countries ranged from . to . per , people. e median ratio
was . per , people. Table also shows that Canada ranked in the
bottom third at th among the group of OECD countries in in
terms of the national availability of physician human resources. Canada’s
ratio of . physicians per , people was slightly below the average of
the . average ratio for the countries in the bottom third. By con-
trast, the average ratio for the top one third of OECD countries in
was . physicians per , people. Other annually updated research
(Esmail and Walker, ) shows that even after adjusting physician to
An exception is that newborns often temporarily receive primary care from hos-
pital programs.
According to Statistics Canada, “residents of Indian reserves, health care insti-
tutions, some remote areas, and full-time members of the Canadian Forces were
excluded” from the survey Statistics Canada, a.
was the most recent year for which internationally comparable data was
available from the OECD.

Table : Number of practicing physicians per , population, or
most recent data, OECD countries ranked
Rank OECD country Practicing physicians
per 1,000 population
1 Greece 5.0
2 Belgium 4.0
3 Netherlands 3.8
4 Switzerland 3.8
5 Iceland 3.7
6 Italy 3.7
7 Norway 3.7
8 Austria 3.6
9 Czech Republic 3.6
10 Spain 3.6
11 Germany 3.5
12 Sweden 3.5
13 France 3.4
14 Portugal 3.4
15 Denmark 3.3
16 Slovak Republic 3.1
17 Hungary 3.0
18 Ireland 2.9
19 Australia 2.8
20 Luxembourg 2.8
21 Finland 2.7
22 United Kingdom 2.5
23 United States 2.4
24 New Zealand 2.3
25 Poland 2.2
26 Canada 2.1
27 Japan 2.1
28 Mexico 1.9
29 Korea 1.7
30 Turkey 1.6
Source: OECD, 2008. Note: Data for Greece, Sweden, Portugal, Denmark, Slovak Republic, and Australia were not re-
ported by the OECD for 2006. In order to facilitate comparisons, the most recently reported data for these countries
was substituted instead, which was current to either 2005 or 2004. This method is supported by the observation that
in all cases, earlier trends indicated stable or increasing numbers of physicians per 1,000 population.

52 Canadian Health Policy Failures
Fraser Institute | www.fraserinstitute.org
population ratios for differences in the age profile of national populations
(a factor which could influence aggregate demand for physician services),
Canada ranks very low in terms of the availability of physicians relative
to comparable countries.
On the other hand, some researchers have argued that the absolute
number of doctors per population in Canada has remained roughly the
same over a long period of time and that this suggests there is no real26
shortage in Canada (Rachlis et al., ; Barlow, ; Chan, ).27
Data indeed confirms that since reaching its peak of . physicians per
, people in , the physician-to-population ratio has maintained a
virtually constant ratio of . physicians per , people in Canada (fig-
ure ).28 In response, other researchers (Esmail and Walker, ) have
shown that the physician supply has grown faster relative to population
in most other OECD countries, and that this implies a relative shortage
of physicians in Canada. Using all publicly available data, figure com-
pares the Canadian supply of physicians with the average physician-to-
population ratio among OECD countries between and . e
As defined by economists to mean actual effective access to needed services over
time.
Barer and Stoddart () have (at times) argued that Canada has too many doc-
tors. eir paper on the subject is widely perceived as a major catalyst for govern-
ment decisions to restrict the physician supply, as detailed by Chan ().
ere are some comparability limitations in these statistics. e data reported by
each member country in the OECD is not necessarily defined the same way. For exam-
ple, data reported by Canadian and American sources is not defined in the same way.
Direct communications with the OECD’s health data division confirm that Canadian
counts of active physicians include physicians in administration and research, teaching,
etc. By contrast, US counts do not include physicians in administration and research,
teaching, etc. e reporting difference inflates the number of physician resources per
population published by the OECD for Canada relative to the US. According to the
OECD representative that I contacted, “in this specific case, the data provided by our
US data correspondent is in fact more consistent with the proposed definition for this
OECD data collection than the data provided by Canada, since the proposed defini-
tion of ‘practising physicians’ excludes physicians in administration, research, etc. who
do not have any contact with patients” (E-mail correspondence with Marie-Clémence
Canaud, Health Division, OECD, //).

Chapter 2: Shortage of medical professionals 53
www.fraserinstitute.org | Fraser Institute
year marks the approximate implementation date for Medicare in
all provinces. e data show that by , Canada’s supply of physicians
had actually dipped below the OECD average. Since , the gap between
Canada’s supply of physicians and that of the rest of the OECD has grown
larger over time. erefore, without accounting for changes in physician
demographics, demand for physician services, or technological changes
to medical practice, Canadians were essentially receiving the same abso-
lute supply of physicians in that they were getting in . Over the
same period of time, the other health systems of the OECD continued to
improve access to physicians for their populations.
By themselves, these trends do not necessarily indicate that the supply
of physicians in Canada is affecting access to medically necessary health
Physicians per 1,000 population
1.0
1.5
2.0
2.5
3.0
3.5
OECD
average
Canada
1966
1968
1970
1972
1974
1976
1978
1980
1982
1984
1986
1988
1990
1992
1994
1996
1962
1964
Figure 6: Number of practicing physicians per 1,000 population, Canada
vs. average for all other OECD countries with available data, 1961–2006
Source: OECD, 2008. Calculations by the author.
1998
2000
2002
2004
2006
54 Canadian Health Policy Failures
Fraser Institute | www.fraserinstitute.org
care services for the population. Yet, there are several reasons which sug-
gest that maintaining a constant supply of physicians per population has
not produced an adequate supply of physicians in Canada. Changing
demographics, technological advancement, and increased complexity in
medical treatment, as well as rising consumer expectations, mean that
Canada’s constant ratio of physicians-to-population since might dis-
guise the actual insufficiency of our physician supply. In this context, a
constant ratio of physicians to population could indeed produce declining
access in “real” terms for patients.
It is important to note, for instance, that the gender balance of the phy-
sician workforce has changed with increasing numbers of females entering
the medical profession (CIHI, a). Research suggests that female physi-
cians are more likely to work fewer hours and to take extended leaves from
employment due to child bearing and family-related responsibilities, and
that women are projected to make up an increasing percentage of the phy-
sician workforce, with estimates predicting % female representation by
(Task Force Two, ). e changing gender balance in the Canadian
physician population could be reducing the effective supply of physicians.
e aging of the physician and patient populations has probably also
been a factor in reducing the effective supply of physicians. Research
shows that the average Canadian physician is years old (Task Force
Two, ). Retirements are reducing the number of active physicians,
especially those with the most experience (Task Force Two, ). e
retirement issue is more severe when it comes to specialists (Task Force
Two, ). At the same time, research also suggests that aging patient
populations will, in the future, be linked to increasing demands for physi-
cian services because studies show that % of lifetime per-capita expen-
ditures on health care occur after the age of (Brimacombe et al., ).
Similarly, the technological evolution of medical practice is consid-
ered by some to be a contributing factor creating effective shortages of
physician human resources. Medical science and technology have made
significant advances since the beginning of public health insurance in
Canada. ese technological advancements have increased the effective-
ness of treatment and have increased the range of treatable conditions,
but are often not technological substitutes for medical labor. Researchers
Chapter 2: Shortage of medical professionals 55
www.fraserinstitute.org | Fraser Institute
have argued that, theoretically, it takes more physicians per population to
adequately deliver this increased range and complexity of medical goods
and services (Chan, ; Task Force Two, ). ese facts suggest
that there are probably too few physicians to meet the actual demand for
services in Canada.
According to recent reports on the issue, Canadian provincial govern-
ments have acknowledged problems with the supply of physicians and
have been attempting to correct shortfalls by boosting the number of med-
ical school admissions (ACMC, ). Yet, some researchers have argued
that in order to properly understand how current policies will address
Canada’s physician shortage, it is important to consider the impact of
these changes in school admissions on the number of physicians entering
the workforce over the next decade. Research by Ryten et al. () found
that the number of Canadian-trained physicians entering the workforce
was insufficient to maintain the current supply of doctors at that time.
More recently, Esmail () compared the number of new Canadian-
trained physicians who would actually enter the workforce between
and to the number of new physicians required to maintain the cur-
rent physician-to-population ratio. Esmail’s projections suggest that the
number of physicians leaving the workforce is greater than the number of
Canadian-trained physicians entering the workforce every year through
. e finding suggests that without a significant addition of foreign-
trained doctors, the Canadian physician-to-population ratio will decline
in absolute terms between and .
www.fraserinstitute.org | Fraser Institute
Chapter
Shortages of medical technology
Another shortcoming of the Canadian health system is reflected in con-
cerns about a relative lack of access to advanced medical technology. Table
shows unadjusted OECD data on the availability of five important types
of medical diagnostic technologies. Data was only available from the
OECD for these particular types of technologies. Availability is defined
as the number of units per million population. Data was not available in
the most recent year for all countries in the OECD, and not at all for some
countries. In order to maximize the number of countries with available
data for comparison, the most recent data years reported to the OECD
are presented. Countries are ranked from best to worst based on the avail-
ability of each technology. e data show that in terms of the availability
of CT scanners, Canada ranked nd of OECD countries with avail-
able data. Canada ranked th of for MRIs, rd of for lithotripters,
th of for mammographs, and th of for radiotherapy equipment.
As discussed earlier in this chapter, averaged over the most recent
-year period, Canada ranked as the seventh highest spender on health
care, when measured as a percentage of GDP. Given Canada’s spending
rank, the supply of medical technologies in the top should represent
a reasonable range of possibility for Canada’s health care system, all else
being equal. erefore, an average of the supply of each technology for the
top OECD countries (excluding Canada) is also shown for comparison.
Using this comparison, it is notable that Canada’s numbers fall below the
average of the top other OECD countries in terms of the supply of all
five technologies. e difference between Canada’s supply of technology

Table : Number of units per million people, selected diagnostic
CT scanners MRIs
Rank Country Number
per million
population
Most
recent
data year
Country Number
per million
population
Most
recent
data year
1 Japan 92.6 2002 Japan 40.1
2005
2 Australia 51.1 2005 United States 26.5
3 Belgium 39.8 Iceland 19.7
4 United States 33.9 Austria 16.8
5 Korea 33.7 Finland 15.2
6 Austria 29.8 Italy 15.0 2005
7 Luxembourg 28.3 Switzerland 14.0
8 Italy 27.7 2005 Korea 13.6
9 Iceland 26.3 Greece 13.2 2005
10 Greece 25.8 2005 Luxembourg 10.9
11 Portugal 25.8 Denmark 10.2 2004
12 Switzerland 18.7 1999 Ireland 9.7
13 Germany 16.7 Spain 8.8
14 Denmark 15.8 Sweden 7.9 1999
15 Finland 14.8 Germany 7.7
16 Sweden 14.2 Belgium 7.1
17 Spain 13.9 Netherlands 6.6 2005
18 Czech Rep. 13.1 Canada 6.2
19 Ireland 12.8 Portugal 5.8
20 New Zealand 12.1 2004 UK 5.6
21 Solvak Rep. 12.1 France 5.3
22 Canada 12.0 Australia 4.9
23 France 10.0 Solvak Rep. 4.5
24 Poland 9.2 Czech Rep. 3.8
25 Netherlands 8.2 2005 New Zealand 3.7 2003
26 Turkey 7.8 Turkey 3.5
27 UK 7.6 Hungary 2.6
28 Hungary 7.2 Poland 1.9
29 Mexico 3.6 Mexico 1.4
30 Norway – N/A Norway – N/A
OECD top 10
average
38.9 OECD top 10
average
18.5
Source: OECD, 2008; Calculations by the author.
*Comparability in the data could be affected by accuracy in the reporting of OECD member
countries, as well as differences in the quality of the devices counted. Utilization efficiency
might also differ significantly, though data was not available for adjusted comparisons.

technologies, OECD countries reporting data, *
Lithotripters Mammographs
Rank Country Number
per million
population
Most
recent
data year
Country Number
per million
population
Most
recent
data year
1 Korea 10.7 France 42.2
2002
2 Japan 7.1 2005 Finland 38.5
3 Slovak Rep. 5.2 Greece 36.5 2005
4 Switzerland 4.9 Portugal 35.2
5 Belgium 4.6 Korea 34.1
6 Germany 3.8 Australia 24.6
7 Poland 3.5 New Zealand 23.1 2004
8 Czech Rep. 3.3 Luxembourg 21.8
9 Iceland 3.3 Canada 21.3 2005
10 Italy 2.9 1996 Belgium 19.4
11 Luxembourg 2.2 Iceland 16.4
12 Portugal 2.2 Poland 15.3
13 Spain 2.1 Czech Rep. 14.3
14 Austria 1.9 Ireland 13.9
15 Ireland 1.7 Hungary 13.4
16 Greece 1.4 2005 Slovak Rep. 12.8
17 Mexico 1.4 Denmark 10.5
18 France 1.2 Spain 9.3
19 Australia 1.1 2005 UK 8.4
20 Hungary 1.1 Turkey 6.5 2003
21 Turkey 1.0 2001 Mexico 4.8
22 Finland 0.6 Netherlands 3.9 2005
23 Canada 0.5 Austria – N/A
24 New Zealand 0.5 2003 Germany – N/A
25 Denmark – N/A Italy – N/A
26 Netherlands – N/A Japan – N/A
27 Norway – N/A Norway – N/A
28 Sweden – N/A Sweden – N/A
29 UK – N/A Switzerland – N/A
30 United States – N/A United States – N/A
OECD top 10
average
4.9 OECD top 10
average
29.2
Source: OECD, 2008; Calculations by the author.
*Comparability in the data could be affected by accuracy in the reporting of OECD member
countries, as well as differences in the quality of the devices counted. Utilization efficiency
might also differ significantly, though data was not available for adjusted comparisons.

60 Canadian Health Policy Failures
Fraser Institute | www.fraserinstitute.org
and the average for the top other OECD countries appears to be quite
significant for CTs, MRIs, and lithotripters.
Another way to assess whether the supply of medical technology is
adequate in Canada is to compare year-to-year changes relative to the
average supply levels observed in other OECD countries over the same
period. Figures , , and show time series data for Canada versus an
average for all other OECD countries with available data in each year. In
each figure, the period begins with the first year in which data was avail-
able for Canada and at least one other OECD country for comparison.
CT scanners per million population
10
15
20
OECD
average
Canada
1994
1996
1998
2000
2002
2004
2006
1990
1992
Figure 7: Number of CT scanners per million population, Canada vs.
average for all other OECD countries with available data, 1990–2006
Source: OECD, 2008. Calculations by the author.
Note: Canadian data not reported by the OECD in some years. Time series begins in earliest
year reported for Canada. Missing data points in some years.
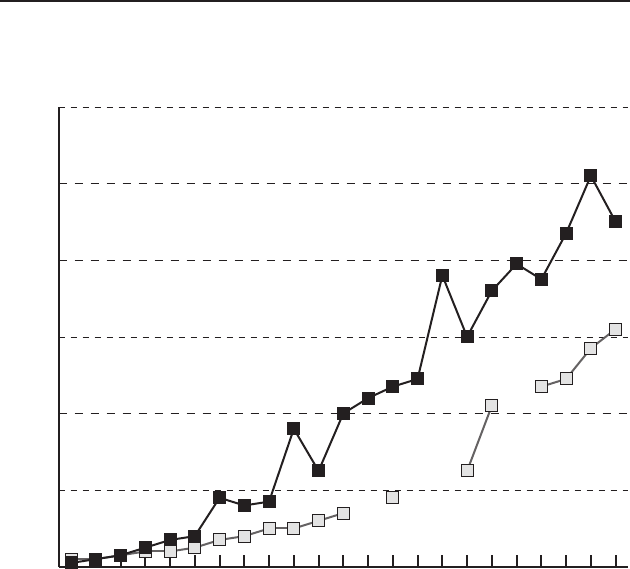
Chapter 3: Shortages of medical technology 61
www.fraserinstitute.org | Fraser Institute
Other research has reached conclusions similar to the findings pre-
sented above. For instance, in a more rigorous analysis, Esmail and Walker
() also annually examined OECD data to compare the international
availability of these technologies, making adjustments to the data to
account for differences in the age profiles of the populations in each inter-
national jurisdiction, and comparing only to countries with similar social
goals for health policy. e results of their most recent age-adjusted analy-
sis (based on countries with available data) rank Canada th of
countries for CT scanners, th of comparable countries in terms of the
MRIs per million population
2
4
6
8
10
12
OECD
average
Canada
1988
1990
1992
1994
1996
1998
2000
1984
1986
Figure 8: Number of MRIs per million population, Canada vs. average for
all other OECD countries with available data, 1984–2006
Source: OECD, 2008. Calculations by the author.
Note: Canadian data not reported by the OECD in some years. Time series begins in earliest
year reported for Canada. Missing data points in some years.
2002
2004
2006
62 Canadian Health Policy Failures
Fraser Institute | www.fraserinstitute.org
availability of MRI diagnostic machines, th of for lithotripters, and
th of for mammographs. In their review of the literature, Esmail and
Wrona () found a number of analyses suggesting that the Canadian
health care system has a relative shortage of important medical tech-
nologies. For example, Canada’s poor international ranking regarding the
availability of medical technology has been verified by a Canadian
Institute for Health Information (CIHI) report which found that Canada
ranked below the OECD median in its availability of MRI and CT scan-
ners (CIHI, b). e CIHI survey research also suggested domestic
shortages of other select technologies (CIHI, a, c). In another
report, the International Network of Agencies for Health Technology
Assessment (INAHTA) surveyed its member countries on their provision
of PET scanners and found that Canada also ranked near the bottom in
terms of availability (Hastings and Adams, ). Finally, citing various
reports from the Canadian Agency for Drugs and Technology in Health
(CADTH), Esmail and Wrona () further found that numerous other
leading-edge technologies which are generally available in many other
OECD countries are virtually not accessible at all to patients in Canada.

Chapter 3: Shortages of medical technology 63
www.fraserinstitute.org | Fraser Institute
Lithotripters per million population
0.5
1.0
1.5
2.0
2.5
3.0
3.5
OECD
average
Canada
1990
1992
1994
1996
1998
2000
1986
1988
Figure 9: Number of lithotripters per million population, Canada vs.
average for all other OECD countries with available data, 1986–2006
Source: OECD, 2008. Calculations by the author.
Note: Canadian data not reported by the OECD in some years. Time series begins in earliest
year reported for Canada. Missing data points in some years.
2002
2004
2006

www.fraserinstitute.org | Fraser Institute
Chapter
Long waits for medical treatment
One of the more highly publicized complaints about suboptimal per-
formance in the Canadian health system is that there are unnecessarily
long delays to accessing publicly insured medical treatment. Unnecessary
delays to accessing medical treatment could result from shortages of medi-
cal resources. ere is no government source of comprehensive, nationally
comparable administrative data available with which to measure waits
for hospital and physician specialist services in Canada. However, the
provinces individually publish official waiting lists using administrative
reporting data.29 Provincial wait times data is based on varying definitions,
methods, and scopes of measurement. Provincial ministries of health in
all provinces except Newfoundland & Labrador and Prince Edward Island
Available for various provinces and procedures at the following URLs:
British Columbia
www.healthservices.gov.bc.ca/cpa/mediasite/waittimes.html
www.health.gov.bc.ca/waitlist
Alberta
www.ahw.gov.ab.ca/waitlist
Saskatchewan
www.sasksurgery.ca
Manitoba
www.gov.mb.ca/health/waitlist/index.html
Ontario
www.health.gov.on.ca/transformation/wait_times/wait_mn.html
www.ccn.on.ca
www.cancercare.on.ca/index_waittimesRadiation.asp
www.cancercare.on.ca/index_waittimessystemic.asp
Quebec
http://wpp.msss.gouv.qc.ca/appl/gweb/default.asp
New Brunswick
http://www.gnb.ca//surgicalwaittimes/index-e.aspx
Nova Scotia
www.gov.ns.ca/health/waittimes/wt_treatment_service/default.htm

66 Canadian Health Policy Failures
Fraser Institute | www.fraserinstitute.org
have websites that publish either the estimated length of wait times by
procedure or the estimated number of patients on wait lists by procedure.
Newfoundland & Labrador and Prince Edward Island publish occasional
reports on wait times. Two provincial agencies focused on cardiac and
cancer care also maintain website estimates of wait times for these par-
ticular services in Ontario.
e Fraser Institute publishes the only report on wait times that uses
a method which allows for reliable interprovincial comparison across
Canada (Esmail, Hazel, and Walker, ). e report has been updated
annually since , allowing for a time series analysis. Data for the report
is generated from a national mail survey sent to all physician specialists
in important elective treatment areas across all Canadian provinces
and typically achieves a response rate of about %.30 e report measures
total waiting time, which is defined as the period from referral by a general
practitioner to when the patient actually receives specialist treatment. It
does not include the time spent waiting for an appointment with a gen-
eral practitioner. e data are stated as a median statistic averaged across
specialties31 and provinces. According to the most recent edition
of the survey, Canadian median wait time, averaged across all special-
ties and provinces, was . weeks in . According to the Institute’s
research, the total aggregate average wait time measured in was
down from a historical high of . weeks in . Despite the one-year
improvement, the average median wait for medical services in had
increased to nearly twice as long as it was in when the survey indi-
cated that median wait times averaged . weeks across the same special-
ties. According to the survey, physician respondents also reported that
One limitation of the survey methodology used in the report is that it might be
affected by respondent bias. is limitation would also apply to other national, inter-
provincially comparable, comprehensive studies of wait times. For instance, while the
Fraser Institute surveys physicians, Statistics Canada also uses a survey method for its
wait times studies that targets both patient and provider respondents. Nevertheless, the
Fraser Institute’s survey often produces more cautious estimates of wait times in many
specialties than even those published by government reports using administrative data.
Data was collected on multiple procedures included in each specialty.

Chapter 4: Long waits for medical treatment 67
www.fraserinstitute.org | Fraser Institute
Canadians waited significantly longer than what the respondents deemed
clinically reasonable.
According to the Esmail, Hazel, and Walker (), a relatively low
availability of advanced medical technologies in Canada is suspected to
be a key factor in producing long waits for diagnostic procedures. e sur-
vey showed that in , the averaged median wait for a CT scan across
Canada was . weeks (roughly equal to the . weeks recorded in ).
e averaged median wait for an MRI across Canada was . weeks (down
from . weeks in ). Finally, the averaged median wait for ultrasound
was . weeks (up from . weeks in ) across Canada. To verify the
validity of their survey results, Esmail, Hazel, and Walker () compiled
data from the provincial wait times websites for comparison. According
to the data they collected in the four provinces where matching compari-
sons could be made with their own survey data, the aggregate average
median32 wait times published by provincial sources were: . weeks in
Alberta; . weeks in British Columbia; . weeks in Saskatchewan; and
. weeks in New Brunswick.
Provincial wait time estimates are sometimes lower, and at other times
higher than Fraser Institute results, depending on the specialty or pro-
cedure being measured. Esmail, Hazel, and Walker () say that dif-
ferences in data definitions and methodology account for most of the
variation in the estimated average median wait times.33 Esmail, Hazel, and
Walker () also reviewed other studies on wait times with results
that could be compared to their survey data. According to their analysis of
the wait times estimates published in these studies, the authors found that
there were independent estimates that could be compared to their own
survey results. ey calculated that in % of the comparisons ( of ),
other estimates of wait times were higher than their own estimates for the
same specialties or procedures studied, covering the same jurisdictions
and time periods. In % of comparisons ( of ), their estimates of wait
Simple average of the medians reported by provincial authorities for each spe-
cialty/procedure measured.
See Esmail, Hazel, and Walker (: –) for detailed explanations.

68 Canadian Health Policy Failures
Fraser Institute | www.fraserinstitute.org
times exceeded those found in other estimates. And in % of comparisons
( of ), the estimates matched.34
Other research has also examined and confirmed significant wait
times for accessing medical care in Canada. e Canadian Institute for
Health Information (CIHI) published a summary report based on
data from surveys of physicians and patients as well as a collection of
provincial reports and sources of wait times data (CIHI, d). It also
referenced international survey results published by other organizations.
Unfortunately, none of the data was available for comprehensive analysis
of wait times aggregated across treatment areas, averaged across the coun-
try, or compared internationally. Nevertheless, based on the available data,
the report concluded that wait times for accessing medical diagnosis and
treatment in Canada appear to be significant. Moreover, the CIHI study
also concluded that where international comparisons are possible, the
available data suggested that Canadians tend wait longer than patients in
most of the countries used for comparisons.35 e conclusion that wait
times for accessing necessary medical services in Canada tend to be longer
than the waits observed in comparable countries has also been confirmed
in various other studies using small (usually two to three) comparative
samples including Coyte et al. () and Collins-Nakai et al. (). A
study by Carroll et al. () comparing Canada to the US and Sweden
e comparisons of wait time estimates were done for the same time periods
between the studies reviewed and the results collected by the Fraser Institute in ear-
lier editions of their annually updated report.
In another report on wait times in emergency departments in Ontario, CIHI found
that only half of all visits at high-volume community hospitals were completed under
three hours. e median emergency department visit in teaching hospitals was even
longer: just under four hours. Further, one in visits to high-volume community hos-
pital emergency departments lasted . hours or more. is compares to . hours for
teaching hospitals and approximately three hours for low-volume community hospital
emergency departments (CIHI, a). A article cited data from the Vancouver
Coastal Health Authority showing that wait times just to be admitted from ER to
hospital in three provincial hospitals were reported to be, on average, between .
and hours. According to the report, the target admission time for ER patients is
hours and the government wants ERs to hit that target % of the time. Coastal Health
Authority hospitals actually reach it .% of the time (Bermingham, , June ).
Chapter 4: Long waits for medical treatment 69
www.fraserinstitute.org | Fraser Institute
found mixed results, with waits in Canada being longer for some pro-
cedures and shorter for others. On the other hand, at least one study by
Jackson et al. () found that wait times in Canada were shorter than
in New Zealand for the procedures studied.
An analysis by Stokes and Somerville () estimated the total eco-
nomic costs to Canada from excessive wait times in Canada’s medical
system. e study measured only the economic costs incurred by waiting
longer than medically recommended for treatment. It considered three
types of costs: patient costs, caregiver costs, and medical system costs.
According to the study,
Patient costs measured the impact of reduced economic activity as
a result of patients being unable to participate in the labor force:
that is, loss of production, reduced incomes and spending.
Caregiver costs measured the impact of reduced economic activity
as a result of caregivers foregoing paid work to care for family
members or relatives: that is, loss of production, reduced incomes
and spending.
Health care system costs included the additional costs to the health
care system: that is, medical appointments, tests and procedures,
and medications that would not have been required had their wait
time not exceeded the maximum recommended.
e study examined only four of the five priority areas identified by
Canadian governments as having high wait times requiring government
action. e study found that the highest economic costs are generated for
total joint replacement surgery (an average of around $, per patient),
followed by MRIs ($,) and coronary artery bypass graft (CABG)
surgery ($,), with cataract surgery yielding the lowest costs ($,).
e cumulative total lost economic output that represents the cost of wait-
ing for treatment across these four priority areas alone in was an esti-
mated $. billion. According to the study, “this reduction in economic
activity lowered federal and provincial government revenues in by

70 Canadian Health Policy Failures
Fraser Institute | www.fraserinstitute.org
an estimated $. billion below the potential level of revenues that would
have accrued to governments in the absence of excess wait times” (Stokes
and Somerville, : ). Table summarizes the data broken down by
economic impact on GDP, federal revenue, and provincial revenue. e
figures suggest that costs from medical waits in Canada amounted to an
approximate one-percent loss to GDP and government revenue.
Table : Estimated total economic costs (lost GDP and government
revenue [or expenditure]) from excess waits for accessing medical services
in four priority areas, Canada,
Total CA$ Total costs from
medical waits, CA$
Gross Domestic Product $1,532,944,000,000 $14,817,000,000
Federal gov’t. revenues $250,782,000,000 $2,211,000,000
Provincial gov’t. revenues $247,021,000,000 $2,182,000,000
Source: Stokes and Somerville, 2008; adapted by author.

www.fraserinstitute.org | Fraser Institute
Chapter
Inflated generic drug prices and
wasted spending
One of the central rationales offered for Canadian prescription drug pol-
icy is a concern about reducing or controlling the cost of prescription
medicines. ere is significant variation between Canada’s approach to
prescription drug policy and the approaches used in other OECD coun-
tries. International policy differences could theoretically produce differ-
ent outcomes on aggregate drug expenditure. Unfortunately, reliable data
is not currently available to permit a comparison of prescription drug
spending across OECD countries.36 Alternatively, a comparison of pre-
scription drug spending in a North American context serves to provide
some insights into the relative success or failure of Canadian prescription
drug policy when compared to more liberal policy environments like that
of the United States.
e drug insurance market is structured virtually the same way in
both countries. In Canada, federal, provincial, and territorial govern-
ments operate publicly funded drug benefit programs acting as insurance
Eight OECD countries, including Canada and the United States, do not report
data on total pharmaceutical spending to the OECD. Further, OECD data on total
pharmaceutical sales are not reported consistently by other member countries. e
wide variation in data definitions is significant and excludes the possibility of reason-
able cross-country comparison. According to the OECD, some countries only report
drug sales to public programs instead of total sales, only ex-factory or wholesale prices
instead of retail prices, and may also exclude sales to hospitals.

72 Canadian Health Policy Failures
Fraser Institute | www.fraserinstitute.org
payers for prescription drugs for specific subpopulations like seniors, low-
income people, or aboriginal populations. But, unlike provincial Medicare,
which covers hospital and physician services, public insurance programs
for drugs in Canada are not universal.37 Importantly, while Canadian
health policy effectively bans any form of private payment for hospital and
physician services insured by the provincial government, such legal pro-
hibitions do not apply to prescription drugs. rough the various federal,
provincial, and territorial government drug benefit programs in Canada,
government accounts for nearly half (%) of all expenditures on prescrip-
tion medicines in Canada (CIHI, ). e rest of drug expenditures are
paid for through private-sector drug insurance (generally associated with
employment benefits) and uninsured personal cash expenditures.
is is an almost identical approach to drug insurance in the United
States, where various federal and state programs provide publicly funded
drug coverage targeting specific subpopulations through programs like
Medicaid, Medicare, and Veterans’ Affairs, while the remainder of the
population obtains drugs through employment-based private-sector
insurance or personal cash payment. However, there are other significant
differences to drug policy between the countries. For example, the federal
government in Canada imposes price controls on patented medicines
and federal, provincial, and territorial governments use health technol-
ogy assessments and restrictive formularies to exclude many new pat-
ented medicines from eligibility for public reimbursement even though
the drugs have been approved as safe and effective by Health Canada. By
contrast, governments in the United States do not impose price regulation
or restrictions on consumer choice.
Using comparable data from government sources, the most recent
research on this question has shown that the comparative overall burden
of total prescription drug spending is roughly equivalent in Canada and
the United States (Skinner and Rovere, c, e). In and ,
per-capita prescription drug expenditures made up roughly the same
ere is significant variance in the design of provincial drug insurance plans,
including eligibility requirements and consumer cost-sharing arrangements (Graham
and Tabler, ).

Chapter 5: Inflated generic drug prices and wasted spending 73
www.fraserinstitute.org | Fraser Institute
percentage of per-capita national income before taxes in both countries.
Data shown in figure indicate that per-capita spending on prescription
drugs was .% of per-capita GDP for Canadians in both years, compared
to .% in and .% in for Americans. e data also show that
in , per-capita prescription drug expenditures were a slightly higher
percentage of after-tax personal income in Canada than they were in the
United States: Canadians spent .% of their personal income after taxes
on prescription drugs in both years, compared to only .% in and
.% in for Americans.38
ese findings are reinforced by Danzon and Furukawa (), who
compared US drug prices to a group of countries including Canada. ey
found that while per-capita levels of spending on all types of biophar-
maceuticals was significantly higher in the US (up to twice as high as
in other countries), “this difference reflects primarily greater availability
and use of new, relatively high-price molecules and formulations. Prices
for identical formulations are not higher on average in the United States.
e broader prices indexes, which do not control formulation, are also
not higher in the United States, after adjusting for income” (Danzon and
Furukawa, : ).
A likely explanation for this finding is the nature of the difference in
prices and substitution patterns of patented versus generic drug prod-
ucts between Canada and the United States.39 A review of available
research comparing drug prices in Canada with drug prices in similar
countries (Skinner, a) suggested that Canadian prices for patented
drugs were at or below international median prices for identical drugs.
Other data also indicate that utilization is similar in both countries: the number of
prescriptions dispensed per capita in each country is approximately the same. In ,
. prescriptions were dispensed per person in Canada, versus . prescriptions
per person in the United States (Skinner and Rovere, c). In , the same fig-
ures were . for Canada and . for the United States (Skinner and Rovere, e).
Researchers have noted that the number of extended units (e.g., pills, tablets, etc.) per
prescription tends to be significantly larger in the US than in Canada (Skinner, a).
For an excellent discussion of the technical and methodological issues sur-
rounding international comparisons of drug prices, see Danzon and Chao ()
and Danzon and Kim ().

74 Canadian Health Policy Failures
Fraser Institute | www.fraserinstitute.org
By contrast, the research also indicated that Canadian prices for generic
versions of drugs were far above international median prices for identi-
cal generic drugs. Later empirical research (Skinner, b; Skinner and
Rovere, d, c) compared Canadian and US prices for the most
commonly prescribed generic and brand name drug products in ,
, and — products in total for each year of study.40 e most
recent data (figure ) indicate that in , Canadian prices for brand
name drugs averaged % lower than commonly available US prices for
All prices adjusted for currency equivalency and calculated per common dos-
age unit.
Canada United States Canada United States
Percent
0.5
1.0
1.5
2.0
2.5
Figure 10: Annual change in the personal prescription drug cost burden
in Canada and the United States, 2006 and 2007
2007
2006
Source: Skinner and Rovere, 2007c, 2008e.
Personal disposable income (PDI) Gross Domestic Product (GDP)

Chapter 5: Inflated generic drug prices and wasted spending 75
www.fraserinstitute.org | Fraser Institute
identical drugs. In , Canadian prices for brand name drugs were, on
average, % below US prices. By contrast, the prices of Canadian generic
drugs were, on average, much higher than commonly available US prices
for identical drugs. Canadian prices for generics averaged % higher
than US prices in , an increase in the relative cost from when
prices for generic drugs were on average % higher in Canada. ese
Canada-US comparative price findings are generally consistent with the
weight of evidence in this area suggested by other research, including
Graham and Robson (), Palmer D’Angelo Consulting International
(PDCI, ), the Patented Medicines Price Review Board of Canada
Percentage of US price (US$ PPP)
-60
-40
-20
0
20
40
60
80
100
120
–43%
Figure 11: Differences between prices in Canada and the United States
for the 100 most commonly prescribed brand-name, and the 100 most
commonly prescribed generic, prescription drugs; 2003, 2006, and 2007,
stated as a percentage above or below the US price.
Source: Skinner and Rovere, 2008c.
Canadian brand-name prices
2003 2006 2007
2003 2006 2007
Canadian generic prices
–51%
–53%
78%
115%
112%

76 Canadian Health Policy Failures
Fraser Institute | www.fraserinstitute.org
(PMPRB, ), the US Food and Drug Administration (FDA, ), the
Competition Bureau of Canada (), and Gooi and Bell ().41
Research also indicates that, relative to the observed outcomes associ-
ated with relatively more liberal US prescription drug policies, Canadian
approaches to prescription drug policy are also associated with a less
economically efficient substitution of lower-cost generic versions of drug
products for relatively more expensive brand name (formerly patented)
drugs. Skinner and Rovere (d) have referenced data from IMS Health
Inc. showing that in , the Canadian generic substitution rate was only
% of all prescriptions dispensed, while in the United States generics
accounted for % of all prescriptions. Probably due to the higher prices
paid for brand name drugs and the much lower prices paid for generic
drugs in the US, as well as the higher substitution rate of lower priced
generics in the US, Americans end up spending about the same percentage
Only one published study has found that Canadian generic drug prices were, on
average, lower than in the United States. e analysis by Danzon and Furukawa ()
included non-prescription (i.e., over-the-counter) drugs in their data sample and their
results are not comparable to the prescription-only prices studied by others. Danzon
and Furukawa also used data from the IMS Health Midas set, which is recorded at
manufacturer price levels, excluding wholesaler and pharmacy mark-ups, and there-
fore is not comparable to the data sets of retail prices used in most other research on
this topic. Another study by D’Cruz et al. () found parity between a select sample
of Canadian and US prices for generic drugs. However, there are methodological con-
cerns with the study. To make Canada-US prices comparable, the authors correctly
converted prices to a common dosage unit (e.g., price per mg). is method properly
accounts for differences in pack sizes and dosage formulations between Canada and
the US, making prices comparable. However, the authors then compared only similar
pack sizes in Canada and the United States. is is not standard methodology and
defeats the purpose of doing the conversion to a common dosage unit in the first place.
It is common to have larger pack sizes at discounted prices in the United States, which
reduces the price per unit and results in American consumers essentially getting more
for their money. ere is no legitimate rationale for excluding these cases. By including
only the least economical sales of US generic products, the selection bias skews the
results on price comparisons and produces a misleading measurement. Finally, their
comparisons were also made using wholesale prices, which makes them irrelevant to
consumers, insurers, and public drug programs, which must pay retail prices.

Chapter 5: Inflated generic drug prices and wasted spending 77
www.fraserinstitute.org | Fraser Institute
of their incomes on prescription drugs as Canadians. Researchers have
argued that Canada’s high generic prices, which subsequently contribute
to low generic substitution rates, result in lost potential savings on total
drug spending totaling between $. billion and $. billion in unneces-
sary spending in alone (Skinner and Rovere, c). is suggests
that Canadian policy is not achieving one of its primary rationales, which
is to produce cost savings (at least at the aggregate level) greater than what
would be achieved by more economically liberal policy approaches like
those in the United States.
Canada United States
10 20 30 40 50 60 70
Figure 12: Percentage of total prescriptions dispensed, generic versus
brand-name drugs, Canada and the United States, 2006
Percentage of total prescriptions dispensed
Brand
Generic
Source: Skinner and Rovere, 2007d.

www.fraserinstitute.org | Fraser Institute
Chapter
Lack of access to new drugs
While Canada’s approach to prescription drug policy produces no overall
cost advantages compared to more economically liberal policies in the
United States, there is a real difference in access to new medicines in both
countries. Access to new medicines in Canada is affected by the state’s dual
role in protecting the public health and in socially guaranteeing universal
access to necessary medicines. e success or failure of Canadian health
policy in achieving these goals is arguably indicated by the performance
of Health Canada’s regulatory approval process for new drugs and the
subsequent reimbursement approval process of federal, provincial, and
territorial (FPT) public drug plans for new drugs. rough Health Canada,
the federal government certifies both the safety and effectiveness of all
newly developed42 drugs before they can be legally sold. is process is
e most recent analysis indicates that, on a global basis, the process of develop-
ing a new drug takes approximately years on average to complete (DiMasi, ;
DiMasi et al., , ; Adams and Brantner, , ). e development period
for new drugs starts from the date at which a newly discovered drug molecule is pat-
ented in any country, including the period of clinical testing, and ends on the date
that an application for marketing approval is first submitted to any national govern-
ment. e longest period within the drug development phase involves clinical testing
of a newly invented medicine among volunteer patients. Clinical testing of new drugs
involves thousands of patients, often located across international jurisdictions, over
many years. No drug is submitted for marketing approval anywhere in the developed
world without having first completed successful clinical tests. e costs and time
spent in the development of new drugs is affected by universal scientific standards of
experimental research. ese standards determine, for example, how many patients

80 Canadian Health Policy Failures
Fraser Institute | www.fraserinstitute.org
a function of Health Canada’s mandate to protect public health. Once
certified by Health Canada, new drugs must receive additional approv-
als from FPT governments before they become eligible for reimburse-
ment under publicly funded drug insurance programs. Reimbursement
or “coverage” decisions made by FPT drug plans are a necessary part of
the state’s involvement in medical insurance, which is a function of the
second core social goal identified earlier as a rationale for state involve-
ment in health care.
In Canada, post-development access to new medicines is affected in
three ways (Skinner et al., ; Skinner and Rovere, d): () time
spent waiting for Health Canada’s regulatory process of certifying the
safety and effectiveness of new drug products; () time spent waiting for
public officials to determine whether a new drug should be eligible for
public reimbursement under FPT drug programs43; and () obstacles to
must be enrolled in the testing of a new drug in order for researchers to have con-
fidence in the statistical results and conclusions. ere are also scientific standards
for the design and conduct of clinical drug testing in patient populations, as well as
ethical standards about the treatment and use of human and animal subjects. ese
standards have international acceptance and affect the absolute minimum period of
time it takes to complete clinical testing of the safety and effectiveness of any new
medicine. International scientific standards for clinical trials are established by the
World Medical Association Declaration of Helsinki (WMA, ). ese are generally
interpreted as the minimum global standard. Actual standards for demonstrating the
safety of drug products are set by national governments through domestic regulation
and determine the number, length, and rigor of clinical trials that will be required. For
instance, Health Canada’s regulations require minimum compliance with international
standards for clinical research on new medicines but do not exclude stricter regula-
tions as deemed necessary by the government of Canada. Nevertheless, because of the
importance of the American and European markets throughout the world, the actual
minimum time spent during drug development is determined by the length of time it
takes to satisfy the requirements of the US Food and Drug Administration (US FDA)
and the European Medicines Agency (EMEA) for clinical testing.
e Government of Canada, through various programs, provides prescription
drug coverage for about one million Canadians who are members of eligible groups.
ese groups include First Nations and Inuit, members of the military, veterans, mem-
bers of the RCMP, and inmates in federal penitentiaries. Provincial and territorial gov-
ernments operate programs for the general populations of their provinces.

Chapter 6: Lack of access to new drugs 81
www.fraserinstitute.org | Fraser Institute
access caused by governments when new drugs that have already been
approved as safe and effective by Health Canada are not declared eligible
for reimbursement under public drug plans. Health Canada defines mar-
keting approval delay as the period between the date at which the drug
manufacturer’s application for approval is recorded or filed in the Central
Registry (CR) of Health Canada’s erapeutic Products Directorate (TPD)
or Biologic and Genetics erapies Directorate (BGTD) following the
completion of clinical testing. e period ends when Health Canada issues
an official Notice of Compliance (NOC) certifying that the new drug is
safe and effective.44
e second segment of the wait for new medicines is the time spent
by FPT governments to decide whether to reimburse a new drug under
their respective publicly funded drug insurance programs. Researchers
(Skinner et al., ; Skinner and Rovere, d) have defined this period
of delay from the date at which Health Canada issues a NOC for a new
drug to the date at which the first public reimbursement (PR) of the same
drug is recorded in the formularies of each FPT drug program.45
Health Canada annually publishes data measuring its performance in
approving applications for new patented drug products. e most recently
ese definitions are discussed in Skinner et al. () and Skinner and Rovere
(d). International systems for drug approval in Europe and the United States
measure the same period but use different terminology for describing start and end
dates. As of , responsibility for approving both pharmaceutical and biological
medicines was centralized for all countries that are members of the European Union
in the European Medicines Agency (EMEA). As of , the equivalent authority in
the United States lies with the Department of Health and Human Services (HHS), Food
and Drug Administration (FDA): Center for Drug Evaluation and Research (CDER) for
pharmaceutical and biological medicines, and formerly with the Center for Biologics
Evaluation and Research (CBER) for biological medicines.
In Skinner et al. (), () above was divided into two sub-segments to account
for the time taken by the quasi-national Common Drug Review (CDR) to issue reim-
bursement recommendations to the provinces. However, the CDR is created, funded,
and used by the provinces to assist in reaching decisions on reimbursement and so the
ultimate responsibility for any delays rests with the provincial governments. For this
reason, the delay caused by the CDR was not measured separately in later editions of
this research (Skinner and Rovere, d).

82 Canadian Health Policy Failures
Fraser Institute | www.fraserinstitute.org
available data published by Health Canada is displayed in table . e
data show the number of days that elapsed between the manufacturer’s
submission of an application to Health Canada for approval of a new
drug and the issuance of an NOC by Health Canada officially certifying
the new drug as safe and effective, and granting marketing approval. e
data cover the most recently reported five-year period, to . Data
covers only new patented drugs. Average wait times are calculated in days
(rounded) and averages are weighted by drug technology type (i.e., bio-
logical/pharmaceutical) and by regulatory application category (i.e., New
Drug Submission (NDS)/Supplementary New Drug Submission (SNDS)).
NDS applications are comprised of drugs that have never before been sold
in Canada (i.e., New Active Substances (NAS)) and new combinations of
two or more previously approved active drug ingredients. SNDS applica-
tions cover requests for reformulations or changes in dosage strength for
previously approved drugs. e relative importance of NDS and SNDS
applications might be perceived to be different. erefore, average wait
times for Health Canada approval are shown separately for all new drug
submissions, and for all new drug submissions excluding SNDS approvals.
e data in table show that in it took an estimated days on
average for Health Canada to grant marketing approval to new patented
drug products. e average wait time for new drug approval was estimated
to be as high as days if supplementary new drug submissions are
excluded. Both estimates for were down from the waits estimated
in the four previous years. e data suggests steady improvement in the
efficiency of Health Canada’s approval process over the most recent five-
year period. Nevertheless, overall average wait times appear to be long, at
between approximately one year for all new patented drugs and . years
if SNDS applications are excluded from the analysis.
Data is available that also allows us to roughly compare Health Canada’s
performance on drug approval to that of its international regulatory coun-
terparts in the US and Europe.46 e international comparisons of wait
Comparability limitations: e FDA does report separately by priority and
non-priority new drug applications. ese are theoretically equivalent to Health
Canada’s NAS and NDS classifications of new drug applications. e averaged median

Table 12: Health Canada average approval time (in days) for new drugs,
2003–2007, by drug technology type, by priority review status, by drug
submission type; overall averages weighted by number of drug products
approved, by category
Drug type and review status 2003 2004 2005 2006 2007
Bio-priority NDS
[1] 723 845 876 482 211
Number of NDS in category 3 6 7 6 3
Bio-non-priority NDS 866 1033 1153 674 472
Number of NDS in category 7 8 10 10 9
Pharma-priority NDS 351 228 348 304 247
Number of NDS in category 4 3 5 4 5
Pharma-non-priority NDS 665 841 540 456 499
Number of NDS in category 29 35 26 35 34
Bio-priority SNDS 1033 – 466 203 –
Number of SNDS in category 2 0 6 5 0
Bio-non-priority SNDS
[2] 527 495 534 355 253
Number of SNDS in category 33 55 60 96 78
Pharma-priority SNDS 396 202 254 191 219
Number of SNDS in category 2 2 2 3 4
Pharma-non-priority SNDS 496 404 362 364 344
Number of SNDS in category 110 101 91 120 153
Weighted average for all 546 533 491 380 337
Weighted average,
excluding SNDS
673 836 697 487 453
Source: Health Canada, a. Calculations by the author.
[] New Drug Submission (NDS)
[] Supplementary New Drug Submission (SNDS)

84 Canadian Health Policy Failures
Fraser Institute | www.fraserinstitute.org
times for new drug marketing approvals require data to be estimated dif-
ferently between Canada and Europe, and between Canada and the US.
is is because Health Canada’s counterpart in the European Union, the
European Medicines Agency (EMEA), reports average wait times consoli-
dated by drug technology type and drug submission type, excluding sup-
plementary new drug submissions.47 By contrast, Health Canada’s coun-
terpart in the US, the Food and Drug Administration (FDA), reports only
median figures, consolidated across drug technology type, reported sepa-
rately by priority review status, excluding supplementary new drug sub-
missions.48 Fortunately, Health Canada reports both average and median
figures, and provides separate breakdowns by drug technology type, drug
submission type, and priority review status. e detail provided by Health
Canada permits us to define the data to match the same methodology for
reporting respectively used by the EMEA and the US FDA.
Tables and respectively show the comparative performance of
Health Canada versus the EMEA and then against the FDA in terms of
the length of time (in days) that each agency took to issue an approval
decision for drugs that were approved by each agency. Only the two most
recent years are shown for the EMEA comparison, and only the four most
recent years are shown for the FDA comparison due to recent changes
in the reporting methodology of the EMEA and FDA. Using matching
comparisons based on EMEA and FDA data definitions for averages and
medians, the data show that typical wait times for new drug approvals
in Canada took significantly longer than in Europe and the US over the
period studied.49
Defined by different terminology but conceptually equivalent.
Defined by different terminology but conceptually equivalent.
e results in tables and cannot be compared to other recent analyses using
different data samples. A study looked more specifically at regulatory approval
times for drugs that were all commonly reviewed by the EMEA, FDA, and Health
Canada between and . e study found that for these drugs, average
approval times were estimated at days in the EU, days in Canada, and
days in the US (Wyatt et al., ). e same study also looked at a smaller com-
mon sample of drugs given priority review in each jurisdiction over the same study
period and found that average approval times were days in Canada, days in

Chapter 6: Lack of access to new drugs 85
www.fraserinstitute.org | Fraser Institute
the EU, and days in the US (Wyatt et al., ). It is unclear how averages were
calculated in the Wyatt et al. () study because the US FDA only reports median
figures. Another study using broader data definitions found that when supplementary
new drug submissions (SNDS) are included in these estimates of wait times, Health
Canada’s performance on new drug approvals has been better than the EMEA and
the FDA in some recent years (Skinner et al., ; Skinner and Rovere, b). e
difference between the results presented here and the findings of previous analyses
suggest that Health Canada is relatively less efficient in terms of approving access to
the newest generation of medicines than either the EMEA or the FDA. On the other
hand, Health Canada also appears to be relatively more efficient in the drug approval
process affecting less novel drug products. From the perspective of patients, the result
suggests that, in general, access to the newest medicines is more limited in Canada
than in either Europe or the US over the period studied.
Table 13: Average approval time (days), Health Canada vs. EMEA, con-
solidated by drug technology type and priority review status, SNDS
type applications excluded
Year Canada European Union
2006 521 302
2007 437 282
Source: Skinner and Rovere, ; Health Canada, a; EMEA, .
Table 14: Median approval time (days), Health Canada vs. FDA,
consolidated by drug technology type, weighted by priority review
status, SNDS type applications excluded
Year Canada United States
2004 671 341
2005 620 339
2006 440 351
2007 355 277
Source: Skinner and Rovere, ; Health Canada, a; CDER, .

86 Canadian Health Policy Failures
Fraser Institute | www.fraserinstitute.org
Access to new drugs can also be measured in terms of the wait times
for public drug plans to declare new drug products eligible for public
reimbursement after they have been certified as safe and effective by
Health Canada. In , federal, provincial, and territorial (FPT) gov-
ernments created a process called the Common Drug Review (CDR) for
assessing the comparative effectiveness of new medicines,. e CDR “uses
Clinical and Pharmacoeconomic Drug Reviews to evaluate the compara-
tive benefits and costs of the drugs under consideration and make com-
mon formulary listing recommendations” to public drug plans (CADTH,
:). CDR recommendations are non-binding and FPT governments
make separate jurisdictional decisions about final reimbursement. All FPT
jurisdictions participate, except the province of Quebec. Under Canada’s
reimbursement approval regime, access to new medicines appears to be
quite limited. Data presented earlier in table shows that Canadians
already waited a year or more on average in for Health Canada
to approve new biopharmaceuticals. In addition, data shown in table
suggests that CDR review and the reimbursement approval processes of
public drug plans combined to add another days on average to the
wait for access to new medicines in .
In addition, the overall generosity of coverage under public drug plans
appears to be low. Only a small percentage of the new drugs previously
certified as safe and effective by Health Canada actually end up being
approved for reimbursement by the provincial drug plans. Data shown in
table indicate that as of December , , only .% of all drugs that
Health Canada approved as safe and effective in had actually been
reimbursed in the provincial drug plans.50 By contrast, Canada’s private-
sector drug insurance market appears to provide much broader and more
immediate access to new medicines for privately insured Canadians.51
According to a survey of private health insurers in Canada in , almost
Many reimbursement approvals by FPT governments are extremely limited in
terms of providing full access because they are often restricted to particular circum-
stances requiring case-by-case approval by government authorities.
In Canada, publicly funded drug programs cover about one third of the popula-
tion and account for about % of total (public and private) spending on prescription

Chapter 6: Lack of access to new drugs 87
www.fraserinstitute.org | Fraser Institute
drugs. e rest of the Canadian population obtains drug insurance from the private
sector, or pays cash. e eligibility rules for public coverage vary by jurisdiction.
Table 15: Estimated weighted average number of days between
Health Canada certification and first recorded payment in the
provincial public drug plan for new drugs, organized by year in which
Health Canada issued an NOC, by province, 2004–2007, data current
to December 1, 2008*
Province 2004 2005 2006 2007
BC 554 658 547 269
AB 464 628 480 259
SK 432 355 383 331
MN 397 373 515 373
ON 583 408 427 288
QC 372 384 310 285
NB 805 546 481 322
PEI 882 539 546 –
NS 382 496 409 404
NL 620 839 473 336
Average 549 523 457 319
Source: Skinner and Rovere, ; Brogan, ; Health Canada, b.
Note: As of the date of this study, PEI had not approved any new biological or pharmaceutical
drugs for public reimbursement in .
*The data in table excludes SNDS drugs receiving Health Canada certification. Other analyses
(Skinner et al., ; Skinner and Rovere, d) estimated provincial reimbursement approval
waits affecting new drugs, assuming the inclusion of SNDS drugs in the data, and found similar
wait times. SNDS drugs are no longer included in the Brogan Inc. source database.

88 Canadian Health Policy Failures
Fraser Institute | www.fraserinstitute.org
all new drugs are usually eligible for private-sector insurance reimburse-
ment in Canada as soon as they are certified by Health Canada (Skinner
et al., ).52 is means that recipients of publicly funded drug plans
receive access to less than half as many new drugs as privately insured
people, and they must wait up to a year longer to get access to the fewer
number of new medicines that are eventually covered by governments.53
Primary source data were not readily available for this paper to allow
an international comparison of access to new drugs under the public drug
plans of other health systems. However, some research has been published
which makes such comparisons. A study examined drugs that
were reviewed by the CDR as of October and were submitted for
reimbursement in Canada, France, the United Kingdom, Switzerland, and
New Zealand (Rx&D, ).54 e study’s results suggested that the CDR
recommended significantly fewer of the new drugs for reimbursement
than all countries except Australia and New Zealand. A later study by
Wyatt et al. () examined reimbursement approvals for drugs that
had been reviewed by the CDR and which had been submitted for pub-
lic reimbursement approval in the Canadian provinces, the federally
run Non-Insured Health Benefits (NIHB) program, the Department of
National Defense, and other international jurisdictions. e results of
the comparison are summarized in table , with each jurisdiction ranked
ere are some notable exceptions. Drugs formerly perceived as lifestyle drugs
(e.g., for the treatment of sexual dysfunctions) were in some cases not reimbursed
through private insurance plans. In addition, only outpatient prescription drugs were
covered. Due to the provincial bans on private insurance for publicly funded medical
care, some drugs were excluded from private insurance coverage because the drugs
were administered only in hospital (e.g., IV-administered cancer drugs). Hospital ser-
vices fall under provincial Medicare coverage, which would in turn make it illegal to
privately insure drugs administered in hospital in most provinces.
Research by Pacquette et al. () found that, of the new chemical entities
(NCEs) approved by Health Canada between and , positive reimbursement
approvals ranged from approximately % to %, depending on the province. Later
research by Tierney et al. () found that % ( of ) of all decisions made by
the CDR as of December were negative recommendations for reimbursement.
Prepared by Wyatt Health Management for Rx&D.

Table 16: Percentage of new drugs approved by Health Canada that are subsequently approved for public
reimbursement, by province, 2004–2007
2004 2005 2006 2007
Drug
approved
for public
reimbursement
Approved
drugs as % of
total NOCs
Drug
approved
for public
reimbursement
Approved
drugs as % of
total NOCs
Drug
approved
for public
reimbursement
Approved
drugs as % of
total NOCs
Drug
approved
for public
reimbursement
Approved
drugs as % of
total NOCs
AB 8 17.4% 2 4.8% 9 20.9% 1 2.3%
BC 7 15.2% 2 4.8% 5 11.6% 2 4.7%
MB 8 17.4% 4 9.5% 7 16.3% 3 7.0%
NB 10 21.7% 9 21.4% 16 37.2% 1 2.3%
NL 9 19.6% 9 21.4% 13 30.2% 3 7.0%
NS 8 17.4% 7 16.7% 14 32.6% 5 11.6%
ON 7 15.2% 4 9.5% 7 16.3% 3 7.0%
PEI 8 17.4% 7 16.7% 9 20.9% 0 NA
QC 17 37.0% 13 31.0% 18 41.9% 19 44.2%
SK 12 26.1% 7 16.7% 12 27.9% 2 4.7%
Ave. 20.4% 15.2% 25.6% 10.1%
Total
NOCs
46 42 43 43
Source: Skinner and Rovere, ; Brogan, ; Health Canada, b.
Note: excludes SNDS types of new drug submissions. Other analyses (Skinner et al., ; Skinner and Rovere, d) estimated provincial reimbursement
approval rates for all new drugs including SNDS drugs and found that, as of October , on average across all provincial public drug plans, reimbursement
approval rates were roughly % of all drugs approved by Health Canada in , , and .
90 Canadian Health Policy Failures
Fraser Institute | www.fraserinstitute.org
from the highest public reimbursement approval rates to the lowest. e
rankings show that, for this sample of drugs, Canadian jurisdictions
tended to have among the lowest public reimbursement approval rates
when compared to this group of international jurisdictions. is suggests
that coverage for new drugs under Canada’s public drug plans tends to be
less generous than the coverage provided under the public drug plans of
most of the countries that have been studied.

Chapter 6: Lack of access to new drugs 91
www.fraserinstitute.org | Fraser Institute
Table 17: Public reimbursement approval of 36 drugs reviewed by
the Canadian CDR in 2007 and submitted for public reimbursement
approval in 16 international and 12 Canadian jurisdictions, as of April
30, 2008; ranked highest to lowest
Jurisdiction Number of
drugs approved
Percentage of
sample approved
Germany 36 100.0%
Switzerland 36 100.0%
Finland 36 100.0%
Denmark 36 100.0%
United Kingdom 35 97.2%
France 34 94.4%
Norway 34 94.4%
Spain 34 94.4%
Portugal 34 94.4%
Ireland 31 86.1%
Belgium 31 86.1%
Italy 30 83.3%
Quebec 28 77.8%
Scotland 27 75.0%
Sweden 27 75.0%
Canada CDR 22 61.1%
Canada NIHB 21 58.3%
Australia 21 58.3%
Alberta 20 55.6%
British Columbia 20 55.6%
New Brunswick 20 55.6%
Saskatchewan 20 55.6%
Nova Scotia 19 52.8%
Newfoundland & Labrador 18 50.0%
Ontario 17 47.2%
Manitoba 15 41.7%
Canada DND 12 33.3%
Price Edward Island 11 30.6%
New Zealand 8 22.2%
Source: Wyatt et al., .
www.fraserinstitute.org | Fraser Institute
Chapter
Who gets hurt?
In the preceding chapters, I briefly presented the main economic argu-
ments and supporting evidence that strongly suggest Canadian health
policy is failing at a system-wide level. e health policy failures identi-
fied not only have macroeconomic consequences, but they also have per-
sonal consequences for patients. Quantitative social sciences, including
macroeconomic analyses of health policy, are concerned with measuring
the impact of public policy on aggregate social welfare. Such analytical
approaches are often, by definition, measuring “the greatest good for the
greatest number,” which is a collective-utilitarian notion. Unfortunately,
these kinds of analyses can implicitly ignore individuals who are harmed,
as long as the aggregate outcome improves. To redress this particular
methodological limitation of quantitative social sciences, this book refer-
ences some of the personal stories of patients whose lives and health have
been harmed or jeopardized because of misguided policies in Canada.
Personal anecdotes are not used here as evidence that can be generalized
across the experience of the entire population, but as illustrations of the
effect that bad policies have on individuals. ere are too many examples
of patients who have been injured because of government policies that
limit their health care options to include all of them here. Nevertheless,
it is important to provide at least a few of these stories to emphasize the
point that policy ideas and government decisions about how to finance
and deliver health care have serious consequences for real people, and
that these impacts are not always visible in aggregate economic statistics.
94 Canadian Health Policy Failures
Fraser Institute | www.fraserinstitute.org
Patient experiences in the Canadian health care system
e Canadian media regularly and increasingly report stories of people
impacted by doctor shortages, lengthy wait times, and a lack of access to
medical technology and new medicines. ese stories help to illustrate
the way in which individuals are personally affected by government health
policies. Below, I summarize just a few examples which have been docu-
mented by Canadian journalists and reporters:
Twenty-seven-year-old Margaryta Marion miscarried in a crowded
emergency room area at a hospital in Calgary while waiting for
over six hours to see a doctor. Marion was one of three women
to have miscarried while waiting to see a doctor in a Calgary
hospital emergency room over the three months prior to the report
(Stevenson, , October ).
Fifty-nine-year-old Edith Paulus searched for two years in the city
of Barrie, near Toronto, to find a family physician before she finally
discovered a general practitioner’s advertisement for new patients
in her local newspaper. However, after responding to the ad, she
was told she was too old to be accepted to the clinic’s patient roster.
According to the journalist who investigated the case, the doctor’s
office chose to limit new patients to those under because of a
high volume of patients and a physician shortage in the local area
(Avery, , March ).
Betty Lou Palko had to travel from the city of Prince Albert to
Saskatoon for needle localization after finding a lump in her breast
because there were no radiologists available in her area. However,
once in Saskatoon, only half the procedure could be completed
due to the unavailability of physicians with a full range of specialist
skills. Palko had a needle and wire inserted approximately three and
a half inches into one of her breasts in Saskatoon and then traveled
an hour and a half back to Prince Albert for a surgeon there to
complete the procedure. e report indicated that Palko should

Chapter 7: Who gets hurt? 95
www.fraserinstitute.org | Fraser Institute
have been able to have the entire procedure done in Saskatoon
because the service is provided there, but that would have meant
a wait time of at least two months because of local physician
shortages and high patient volumes (Cowan, , October ).55
Laurie Warbis was personally affected by the wait at one Saskatoon
cancer clinic. At the time of the report, the average wait time at
the clinic was nine to weeks from referral to first treatment
for chemotherapy and radiation. According to the report, when
Warbis’s cancer spread, she was told by the clinic that she would
need a CT scan but would likely have to wait six weeks, followed
by another two months before she could see an oncologist. She
developed complications, and her health was quickly deteriorating.
Knowing she couldn’t wait that long, Warbis contacted a clinic
in the city of Calgary to arrange a CT scan. When the Saskatoon
cancer clinic found out about her decision to go to Calgary, it called
Warbis and told her she could receive the same test in Saskatoon
immediately. However, it was seven weeks before Warbis finally
started her treatment and, by this point, her complications were
very serious and she needed to be admitted into a hospital. e
report suggested that Warbis’s complications would not likely have
become as severe if she did not have to wait seven weeks to receive
treatment (Saccone, , July ).
Specialists are often also in short supply and this requires patients, even those
who live in medium-sized Canadian cities, to travel long distances to obtain needed
procedures. is, of course, is not necessarily a problem. It is true that some degree of
geographic centralization for specialist physician services might also be expected to
result from market forces. However, market-driven centralization would be a response
to the forces of supply and demand and this could be expected to produce efficiencies
if price signals were present to encourage the rational allocation of resources. However,
under a system like Canadian Medicare, such decisions are made by central planners
instead of market forces, and this often results in oversupply in one area and shortages
in others. In fact, actual experience with Medicare suggests that the central-planning
approach to allocating specialist physicians and a shortage of resources has caused
patients to endure rather extreme inconveniences.
96 Canadian Health Policy Failures
Fraser Institute | www.fraserinstitute.org
Dr. John Mathieson, chief of radiology for the Capital Health
Region in Victoria, had a young athlete with an injured knee who
was in great need of an MRI scan. According to the report, he
had to wait four months for the MRI, and by then the knee was
inoperable, which resulted in the loss of his full athletic scholarship
(Shaw, ).
In November , Glenn Scarr was informed that a CT scan had
detected a mass on his adrenal gland. He was told the mass was
non-operable and that the cancer had spread throughout his body.
Scarr understood that he had a couple of years to live. Yet, he and
his wife heard of the benefits of PET scanning and decided they
wanted to obtain a PET scan. However, the government of Ontario
had not yet approved PET scanning for use in cases such as Scarr’s.
Scarr decided to spend $, and get the PET scan at a private
clinic. e next day he got a call explaining that the cancer had not
spread throughout his body after all and that the tumor appeared
operable. Scarr was able to have the mass removed. e PET scan
that Scarr received could have been responsible for saving his life
(Wente, , March ).
In a story, four-year-old Ryan Oldford from Newfoundland
& Labrador, who had already lost one kidney to cancer, was, at the
time of the report, facing a two-and-a-half-year wait for a scan
of his other kidney on the province’s only MRI scanner. Oldford
was one of many residents put on long wait lists as a result of
technology shortage. According to Geoffrey Higgins, clinical chief
of diagnostic imaging at the Health Care Corporation of St. John’s,
as many as children in Newfoundland & Labrador were facing
-month waits for high-tech scans (Priest, , January ).
In , Arcangelo Zanatta arrived at the Royal Columbian
Hospital in New Westminster with chest pains. Zanatta waited
eight hours in the ER during which time he suffered a heart attack.
Chapter 7: Who gets hurt? 97
www.fraserinstitute.org | Fraser Institute
He is alleged to have incurred fatal heart damage while waiting in
the emergency room and died two weeks later from heart-related
complications (CBC, , February ).
In April , -year-old George Cook was taken to the emergency
department of Nanaimo Regional General Hospital. He was suffering
from pneumonia. Cook spent seven hours on a cot in a doorway
without being treated before he died (Times Colonist, , May ).
In , Lindsay McCreith was suffering from unexplained
headaches and seizures. His doctor suspected they were caused
by a brain tumor and McCreith would need an immediate MRI to
diagnose the problem. However, there was a four-month waiting
period in Ontario’s public health care system. Concerned for his
health, McCreith opted to go to the US, where he received the MRI
on the next day. e American doctors found a tumor in his brain.
e early diagnosis likely saved his life (Caswell, , December ).
Shirley Healey, a -year-old BC resident, was waiting for several
months for a surgery to repair a %-blocked artery. Media
reported that Dr. Robert Ellett, a BC surgeon, urged Healey to
have the procedure done in the US because she wouldn’t get
access to surgery in time in BC. Healey had her procedure done
in a hospital in Bellingham, Washington within only a few days of
making an appointment, by which time her condition had in fact
deteriorated to a near complete blockage (Solomon, ; Timely
Medical, ).
In , Branislav Djukic traveled to the former Yugoslavia to
receive the lifesaving operations he could not receive quickly
enough in Canada. Djukic was facing a wait of weeks to remove
a cancer on his kidney. Unable to wait that long without further
sacrificing his health, Djukic paid $, to have the procedure
done in Yugoslavia (Priest, , January ).
98 Canadian Health Policy Failures
Fraser Institute | www.fraserinstitute.org
Jennifer McLeod had to travel to the US to undergo a Gamma
Knife radio-surgery to treat a pituitary tumor. Even though Gamma
Knife technology has been widely used around the world for
decades, it only became available in Canada in . McLeod’s
doctors did not even mention the Gamma Knife possibility to
her; instead, the only option she was presented with was tumor-
suppressing medication (at a cost of $, a month) for the rest
of her life. McLeod opted instead to travel to Minnesota, where
she underwent the procedure at the Mayo Clinic in Rochester. At
the time her story was published, she had been off the drug and in
remission for months (Blatchford, , April ).
In , a Montreal woman with an aggressive form of colorectal
cancer was denied public insurance coverage for a drug that was
keeping her alive. According to the news report, the woman,
years old and mother of two girls, had a deadly, inoperable colon
cancer that had spread to her liver. About , such cases were
diagnosed in Canada in . Her oncologist recommended the
best therapy available at the time, Avastin. e drug works by
choking off a tumor’s blood supply. Research showed the drug
significantly prolonged survival in people with advanced colorectal
cancer by an average of five months, yet there are examples of
longer-than-average survival rates. One oncologist interviewed
at the time said one of his patients on Avastin was in complete
remission. Health Canada approved the drug as safe and effective
in September . But, according to the report, by the end of
March , the woman was still waiting for access to the drug
in Canada because provincial health ministries were withholding
public funding for Avastin, which cost $, per treatment. As
the reporter on the story observed at the time, the provinces were
still weighing the costs and benefits of the treatment while the
woman was demonstrably benefiting from its use (Fidelman, ,
March ).
Chapter 7: Who gets hurt? 99
www.fraserinstitute.org | Fraser Institute
A media report highlighted how Ontario cancer patients are
spending tens of thousands of dollars out-of-pocket to gain access to
new and effective drugs that the provincial government does not fund,
and how even spending their own money on their own health might
be prohibited by government. e drugs are delivered in hospital and
so should normally be covered under the provincial public health
insurance plan. However, the provincial health minister did not
recognize that the drugs are medically necessary, even though they
are recommended and prescribed by the patients’ physicians. e
minister therefore declared the drugs to be ineligible for provincial
Medicare coverage because the Canada Health Act only requires
the province to publicly insure “medically necessary” health care. So
patients started paying privately instead. Media reports suggested
that the minister was not comfortable with allowing publicly funded
hospitals to charge cancer patients directly for the unfunded drugs.
As of April , the minister’s spokesperson said the freedom of
patients to pay privately was under review because some said it
violated the Canada Health Act. Bizarrely, provincial refusal to fund
the drug meant that doctors were recommending life-extending and
perhaps life-saving treatments that their patients might not be able
to afford without insurance, and even when they could, the hospitals
might be forbidden to sell it to them (Priest, , April ).
In , media reported the case of two-year-old Isaac McFadyen
who suffered from a rare disease called Maroteaux-Lamy syndrome.
Isaac was missing an enzyme needed to break down carbohydrates
in his cells. Effects of the disease include breathing problems, poor
mobility, and deformed facial features. Patients often require heart
valve surgery. Isaac had a piece of his skull and vertebrae in his neck
surgically removed. His eyesight was affected and his face suffered
deformities, among other problems. At the time, Ontario was
refusing to cover the drug treatment through the provincial health
program. e only drug available costs $, to $ million
annually and can reportedly reverse some of the problems of the
100 Canadian Health Policy Failures
Fraser Institute | www.fraserinstitute.org
disease and may even prevent them altogether. Despite the high
price of the drug, the disease it treats is very rare, so the overall
impact on total public health spending is quite small. According to
reports, less than Canadians in total out of the entire population
have Maroteaux-Lamy syndrome. Yet, Ontario’s minister of health
said he did not think the province should be covering the enzyme
replacement therapy used to treat Isaac’s condition until a national
policy is in place. In statements to the media, the minister seemed
to suggest he was more concerned about the impact of the drug’s
cost on the public health system. “is is one of the more difficult
circumstances that can be encountered by a family, of course, and
by the challenges that it presents for a public health care system,” he
was quoted as saying. According to the report, governments in the
European Union covered the drug’s cost, and in the United States
it was commonly funded through private insurance. In Canada,
however, there was no public or private coverage. Governments like
Ontario’s were refusing to publicly fund it, and, because such drugs
are delivered in hospitals, they have historically been considered
to be under the jurisdiction of Medicare and therefore not legally
eligible for private payment. erefore, they have been excluded
from private drug insurance coverage (Priest, , May ).
In , media reported statistics from only two Canadian
provinces showing that more than women with high-risk
pregnancies had been sent to the United States for medical
care. Representatives of Canada’s Society of Obstetricians and
Gynaecologists blame the problem on too few medical staff and
government decisions to close hospital beds in Canada a decade
ago. One of the women affected by a shortage of neo-natal care in
Canada was Jade Pascoe of British Columbia. According to media
reports, she went into labor weeks before her due date and was
sent to the US because the hospital where she gave birth did not
have a neo-natal intensive care unit (NICU). In fact, an additional
NICU bed for Jade could not be located in the entire province of
Chapter 7: Who gets hurt? 101
www.fraserinstitute.org | Fraser Institute
BC (population . million in : Statistics Canada, b) or
in the neighboring province of Alberta (population . million in
: Statistics Canada, b) (Priest, , May ).
In another story, Debbie Trelenberg of Alberta was diagnosed in
Canada with high-grade ovarian cancer. She was told by Canadian
authorities that she would have to wait four weeks to have a cancerous
tumor removed. After a couple weeks of waiting in pain, Debbie
traveled to Texas and paid cash for the surgery. According to the
media report on her story, Debbie’s American gynecologic oncologist
operated on her on the next day after examining her. By that time,
Debbie had waited two weeks and the cancerous tumor had grown
in size from centimeters to centimeters. Both her American
specialist and her family doctor in Canada credit the quick access to
surgery in the US with saving her life (Priest, , August ).
To date, the policies implemented by Canadian governments
to fix the problem of shortages have been inadequate. In some
cases, efforts by local health-system officials to deal with physician
shortages in particular are tragically comical. Media has reported
that in southern Nova Scotia, the physician shortage is so severe
that the South West Nova District Health Authority set up a patient
lottery for those who lack a family doctor. Approximately , out
of the , residents (.%) in the area do not have a general
practitioner. According to the plan, , lucky lottery winners will
gain a family physician at a new clinic opening in the area. According
to media accounts, the authorities decided on the lottery because
they knew opening of a new clinic in such an underserviced area
could be a “chaotic affair” (Sylvain, , February ). Blaise MacNeil,
South West Nova’s president and chief executive officer, was quoted
as saying, “the lottery … lets patients join the clinic in a sane and
equitable manner: e authority will use a computer program to
randomly pull up the ‘winning’ names” (Sylvain, , February ).
102 Canadian Health Policy Failures
Fraser Institute | www.fraserinstitute.org
e plan is to hold additional lotteries in the future to replenish the
clinic’s roster (Sylvain, , February ).
Lotteries have also been used in Canada to “cull” people from the
patient lists of physicians’ clinical practices. According to one
media report, due to shortages of medical doctors in northern
Ontario, one family physician who was overwhelmed with an
enormous patient caseload used a lottery system to select which
patients would no longer be able to obtain his services. A hundred
patients were “culled” from his practice using this method. Similar
stories occurred in other provinces with one doctor removing
patients from his roster using a lottery (Blackwell, , August ).
Cases like the ones above beg the following questions: () What good are
public health and drug insurance plans that cover affordable medical care
for everyone but will not reimburse expensive, life-saving or life-improv-
ing treatments for the desperately ill? () What good are public health and
drug insurance plans that provide care only after such long delays that,
in practical effect, the patients affected by these waits are no better off
than being uninsured? () What good is the promise of universal publicly
funded health insurance in Canada if, in practice, many Canadians have
to travel to the US and pay cash to get the medical treatment they need?
Canada’s various publicly funded health care programs are simply not
delivering what insurance should: guaranteed, timely access to and pro-
tection from the unexpected financial burden of expensive but necessary
medical goods and services. Instead, access to publicly insured medical
goods and services is delayed and public health and drug insurance plans
pay for individually affordable basic services for all Canadians (e.g., pri-
mary care visits, generic drugs, low-tech diagnostics), while central plan-
ners effectively reduce access to the catastrophically expensive life-saving
and life-improving treatments that should be covered. e end result is
unnecessary pain, suffering, and possibly even death for those who could
have been treated if newer and commonly accepted medical processes
and technologies were available to Canadians on an affordable and timely
Chapter 7: Who gets hurt? 103
www.fraserinstitute.org | Fraser Institute
basis through appropriately designed health insurance—something that
would be expected from the private-sector alternatives in the absence of
misguided government intervention in health care.
www.fraserinstitute.org | Fraser Institute
Chapter
Problematic Canadian
health policies
Direct state provision of health insurance
In an international context, probably the most distinguishing feature of the
Canadian health care system is that the state is a direct provider of health
insurance and has a de facto monopoly over the market for medical (hos-
pital and physician services) insurance in particular. Overall, government
spending on health accounts for about % of total annual health expendi-
tures in Canada. e remaining % of total health spending is paid for by
either private-sector health insurance (mostly employer-based insurance
benefits for outpatient drugs, dental, vision care, etc.) or personal direct
spending. However, the / public/private split to aggregate health
spending disguises the important fact that government funds virtually
% of all health services legally defined as “medically necessary” by the
state, which in practice usually means all hospital and physician services.
rough the Canada Health Act (CHA), federal law requires medical
insurance to be both funded by and administered by the state in Canada.
e CHA also specifically prohibits any cost sharing by patients or any
extra billing by providers for services that are eligible for public coverage
under provincial-territorial Medicare programs. In Canada, provincial
and territorial governments act as single payers within their jurisdictions,
and effectively prohibit private payment or private-sector insurance for

106 Canadian Health Policy Failures
Fraser Institute | www.fraserinstitute.org
hospital and physician services. All legal residents of each province are
universally eligible for publicly funded medical insurance coverage. ere
is, in effect, no monetary price mechanism to allocate the supply of hos-
pital and physician services in Canada, and overall demand for publicly
funded health care is not affected by any direct price attached to con-
sumption. Generally speaking, provincial health insurance programs act
like traditional indemnity insurers when they pay for physician services.
In practice, most physicians operate as self-employed professionals who
bill the provincial single-payer insurance plan retroactively on a fee-for-
service (FFS) basis. By contrast, hospitals do not bill the provinces for
services provided to insured patients. Instead, provincial governments
provide global budgets to regional public authorities, who then provide
global budgets to hospitals within their region. Hospitals are expected to
meet the medical needs of patients who are admitted to their facilities
within the scope of the budgeted resources provided.
Governments at the provincial level also operate large drug benefit
programs, acting as insurance payers for prescription drugs for specific
subpopulations like seniors and low-income people. ere is significant
variance in the design of provincial drug insurance plans, including eli-
gibility requirements and consumer cost-sharing arrangements (Graham
and Tabler, ). Importantly, while Canadian health policy effectively
bans any form of private payment for hospital and physician services
insured by the provincial government, such legal prohibitions have not
been deemed to apply to prescription drugs. is means that publicly
funded drug programs impose various kinds and degrees of consumer
cost sharing, including dispensing fees, fixed co-payments, percentage co-
insurance, etc. However, almost all of the costs of prescription drugs under
these programs are paid from general government revenues. rough
the various federal, provincial, and territorial government drug benefit
programs in Canada, government accounts for nearly half (%) of all
expenditures on prescription medicines in Canada (CIHI, a).56
In Canada in , total expenditure on prescription drugs was CA$. bil-
lion, private expenditure on prescription drugs was CA$. billion, and govern-
ment spending on prescription drugs was CA$. billion—the government portion

Chapter 8: Problematic Canadian health policies 107
www.fraserinstitute.org | Fraser Institute
Total Canadian health spending is broken down in more specific detail
in table , which shows the percentage of total health spending that is, in
practical terms, under the monopoly control of government, versus the
percentage that is accounted for by a mix of public and private spend-
ing. In , public-sector spending on hospitals and other institutions
(including capital expenditures), physicians, and the direct administrative
expenses of running government health insurance accounted for approxi-
mately .% of total health spending in Canada (table ). e rest of
health spending is accounted for by government funding for “public health”
(e.g., infectious disease control) and “other” areas (.%), which can argu-
ably be classified as natural public goods and which are not contested by
private-sector insurers; as well as goods and services for which there is a
mix of public and private funding (.%).
e policy structure of Canadian health insurance presents poten-
tial problems. One key disadvantage associated with the state acting as a
health insurance provider is that decisions on access, coverage, spending,
pricing, funding, and investment are influenced by political incentives
and these can often conflict with rational economic considerations. is
can mean that politically unpopular policies are not adopted, regardless
of their economic value as reforms. Mitchell and Simmons () theo-
retically explained how economic decisions become politicized when gov-
ernments become involved in allocating goods and services, or directly
providing goods and services. Evidence for this theoretical argument has
been reflected in actual practice in Canadian health policy decisions. For
instance, Deber et al, (: –) have detailed a number of empirical
examples of government attempts to centrally restructure the hospital sys-
tem in Canada, and have discussed the political controversies that ensued
and influenced those policy decisions. Other recent examples show that
political considerations often trump economic rationality in health pol-
icy decisions in Canada. For instance, in , Ontario’s health minister
therefore being equivalent to approximately % of the total (CIHI, a: Table
A... Private-Sector Health Expenditure by Use of Funds, Canada, to —
Current Dollars; and Table A... Public-Sector Health Expenditure by Use of Funds,
Canada, to —Current Dollars).

Table : Percentage of health care market monopolized by governments in Canada,
Funding and delivery
eectively monopolized by government
Natural public
goods/services
Mixed public and private
funding, competitive private-
sector delivery
Hospitals,
institutions
Capital Physicians Administration Subtotal Public
health
Research,
other
Subtotal Drugs, other services Total
Millions
of current
CA$
65,316.40 7,031.60 23,084.00 5,887.10 101,319.10 11,275.60 10,706.80 21,982.40 48,607.30 171,908.80
Percentage
of total
38.0% 4.1% 13.4% 3.4% 58.9% 6.6% 6.2% 12.8% 28.3% 100.0%
Source: CIHI, 2008a: Table A.3.1.1 Total Health Expenditure by Use of Funds, Canada, 1975 to 2008—Current Dollars; Calculations by the author.
Chapter 8: Problematic Canadian health policies 109
www.fraserinstitute.org | Fraser Institute
banned a US company from operating a mobile ultrasound clinic in the
province. e company had planned to offer one-day diagnostic clinics
(charging seniors $ for each test) in the Hamilton-Niagara area, south-
west of Toronto. Despite lengthy delays for such services in the province,
Ontario’s government rushed through legislation banning the firm’s opera-
tions. e province argued that the firm was violating the Canada Health
Act by operating on a for-profit basis, despite the fact that the act requires
only the public funding and administration of health insurance covering
medically necessary care, and says nothing at all about the permissibility
of for-profit health services (CTV News, , September ). In a simi-
lar move, Ontario decided to buy several existing for-profit MRI clinics
in order to turn them into non-profit operations. Reports suggested that
the move to bring the for-profit clinics into the public sector would cost
taxpayers about $ million (Bueckert, , July ; , September
). But Ontario’s policy was a waste of resources. e for-profit pro-
viders who owned the equipment had already paid for it. Ontario could
have spent the money that was required to buy these machines to simply
purchase thousands of MRI scans from the private-sector providers. is
would have helped a large number of patients. Instead, the MRI machines
were paid for twice; once by the health providers who owned them, and
again by the province, and still the province had to pay for MRI scans to
be performed. Such policy choices could be interpreted as the willing-
ness of political officials to reduce potential access for Ontario patients
in order to protect the popular political symbolism of the state’s de facto
monopoly over medical services.
Scale of government health insurance programs
Due to the large scale of government health insurance programs, even
micro-policy decisions made within these programs have the potential
to create unintended negative externalities beyond the program itself.
ese potential problems are theoretically more acute under Canada’s
medical insurance policy, which establishes the state as a monopoly pro-
vider of medical insurance (i.e., hospital and physician services). Negative
110 Canadian Health Policy Failures
Fraser Institute | www.fraserinstitute.org
externalities caused by health policy decisions in a single-payer system can
affect the entire system at once. Such problems are less frequently asso-
ciated with pluralistic insurance systems because the impact of internal
program decisions is not dispersed across the entire system; instead, it is
contained in the same way (i.e., analogously) that systemic damage to a
communications network is contained by having a web structure consist-
ing of pluralistic connecting nodes. Even non-universal health insurance
programs like Canada’s publicly funded drug benefit plans are of a large
enough scale to create unintended economic distortions with potentially
negative consequences. For example, the refusal to extend public reim-
bursement to certain approved drug products can amount to a barrier to
market access for some drug makers. Canada represents only two percent
of the global market for drugs (IMS Health, ) and public drug pro-
grams account for almost half the market for prescription drugs in the
country. erefore, when a province decides not to extend eligibility for
reimbursement to particular drug products, it essentially blocks access for
those products to the government’s half of an already small market. Doing
so might reduce the size of the market to the point where it is not feasible
to incur the costs of introducing a product to the market, especially if
other public policies might also be making the market unattractive. For
example, lengthy drug safety approvals can further delay market access,
reducing the effective patent period left on a new drug, and price controls
might reduce the profit potential once a drug finally makes it to market.
In this way, market distortions caused by the reimbursement decisions of
large, public drug programs can have the indirect effect of reducing access
for everyone, not just the recipients of public drug benefits.
Ban on cost sharing
e lack of price mechanisms in Canadian public health insurance pro-
grams is also a result of the politicized nature of decision making when
government is involved as a direct provider of insurance—governments
are reluctant to impose cost sharing for political reasons. e absence of
price signals is theoretically associated with several economic problems.
Chapter 8: Problematic Canadian health policies 111
www.fraserinstitute.org | Fraser Institute
Esmail (), for instance, has argued that standard liberal economic
theory suggests that shortages occur when prices are not permitted to
adjust to supply and demand. Specifically, “prices will normally rise in any
functioning market where goods or services are in short supply relative
to demand, thus encouraging new supply and reducing demand simulta-
neously. e outcome is equilibrium of supply and demand (no shortage
or excess). In the Canadian health care marketplace, such adjustment
is impossible because of restrictions on both the prices and supply of
medical services” (Esmail, : ). e absence of price mechanisms
in health insurance also means that consumers face no economic incen-
tives (other than inconvenience or risks associated with unnecessary treat-
ment) to constrain their marginal demand for more health care or to
encourage cost-efficient tradeoffs among substitutable treatment tech-
nologies (Newhouse et al., ). Many public drug plans also fully reim-
burse % of the cost of prescription medications (Graham and Tabler,
). e lack of consumer exposure to a part of the cost of their pre-
scriptions (through copayments, for example) removes a price signal that
would incentivize consumers to put downward pressure on drug prices,
including generic products. While some jurisdictions in Canada impose
copayments on beneficiaries of their public drug plans, the copayments
are usually not structured appropriately. In order for a copayment to be
effective, it must be calculated as a percentage of the price. Unfortunately,
where copayments actually exist in Canadian public drug plans, they are
ineffective as price signals because they are usually set at capped dollar
amounts (e.g., consumers pay the pharmacy dispensing fee) (Graham and
Tabler, ).
Separate policy treatment of medical and drug insurance
e separate policy treatment of medical insurance and prescription drug
insurance in Canada also brings associated problems related to supply
and demand incentives. Government insurance covers % of the cost of
medical services delivered by hospitals and physicians but does not gen-
erally cover the cost of outpatient goods and services, except for certain

112 Canadian Health Policy Failures
Fraser Institute | www.fraserinstitute.org
subpopulations like seniors, the disabled, and social welfare recipients.
And when government insurance does cover outpatient health care, it
does not pay % of the costs. is lack of comprehensive coverage and
the lack of equivalent reimbursement rates makes the out-of-pocket cost
of competing health care options much different and can therefore create
inappropriate incentives to consume inefficient combinations of medical
care. Under the Canadian system, there is an incentive for patients is to
utilize goods and services that receive a government subsidy rather than
use potentially more efficient combinations of care that do not receive the
same level of subsidy. Drugs are one example of a medical technology that
is demonstrably more efficient at improving health outcomes but which,
as a result of the lack of comprehensive insurance coverage offered under
government programs, is made comparatively more expensive. is cre-
ates a disincentive for both patients and physicians to substitute drugs for
less efficient treatment technologies. By maintaining separate programs
for drug insurance, administrators are also encouraged to see drug expen-
ditures separately from overall health spending. Yet research suggests that
when health spending is considered in aggregate, drugs can be shown to
be a cost-effective medical technology.57 Drugs are often a technological
substitute or technological complement for older, less effective or less effi-
cient ways of treating illness, and this can produce cost savings on overall
health expenditures (Frech and Miller, ; Lichtenberg, , a,
b, c; Lichtenberg and Virabhak, 58; Han and Wang, ;
Cremieux and Ouellette, ; Cremieux et al., ).
ere are various ways of defining cost and benefit in the context of drug treat-
ments. A cost-effective drug produces a marginal benefit that is equal to, or better
than, any alternative treatment at a fixed cost (Weimer and Vining, : ). A cost-
efficient drug produces a marginal benefit that is equal to, or greater than, its own
marginal cost (Danzon, ). A cost-saving drug is one that, when used, substitutes
for alternative medical treatments, leading to lower overall spending than would have
occurred if it had not been used (Han and Wang, ).
Skinner and Rovere (b, b) discuss that, in contrast to Lichtenberg
and Virabhak’s () findings on the cost-saving benefits of newer drugs, opposing
research suggests that drugs, and specifically new drugs, do not present a reduction
in costs for non-drug expenditures. Miller et al. () argue that the number or

Chapter 8: Problematic Canadian health policies 113
www.fraserinstitute.org | Fraser Institute
Centrally planned allocation of medical resources
ere are two ways to balance the supply and demand for medical
resources: by relying on market forces, or by employing state-directed
allocation. Despite the well-known limitations of central planning (Hayek,
), Canadian health policy has increasingly relied more heavily on such
approaches to determine the supply of medical resources. Government
efforts to manage the supply of physicians are a good example of the
mix of drugs used is an important indicator in determining the association between
drug age and non-drug expenditure. Miller et al. () first replicated Lichtenberg’s
work and confirmed the validity of Lichtenberg’s findings. Afterward, using a differ-
ent method, they analyzed only patterns of use for new cardiovascular drugs and the
association of this with non-drug health expenditures. ey controlled for the drug
quantity and the mix of newer and older drugs as a proxy for controlling severity of
illness. ey found, unsurprisingly, that the net cost-savings effect of cardiovascular
drugs did not apply to the sickest patients. In a study similar to that of Miller et al.,
Duggan investigated the effects of new drugs focusing solely on one therapeutic class.
e objective was to determine if new antipsychotics reduce spending on other types
of medical care such as the demand for hospitalization and other health care services
(Duggan, ). Duggan’s study suggested that new antipsychotic drugs increase the
prevalence of diabetes and related illnesses among schizophrenia patients, thus hav-
ing a negative effect on health outcomes. However, he also found that while antipsy-
chotics increased the prevalence of diabetes among schizophrenia patients, the drugs
reduced the occurrence of “extra-pyramidal symptoms,” although he failed to estimate
the savings from this. e studies by Miller et al. and Duggan are interesting but not
useful for analyzing the overall impact of drugs on health budgets. Despite claims to
the contrary, these studies do not contradict Lichtenberg and Virabhak (), who
analyzed the effects of new drugs averaged across all patients and all illness condi-
tions. e conclusions of the study by Miller et al., in particular, were skewed because
it focused upon the sickest group of patients instead of on all patients. Also, while
specific illnesses such as cardiovascular-related diseases and antipsychotic ailments
may cover a large portion of pharmaceutical spending, drug expenditures are fairly
divided among other therapeutic classes. e Patented Medicine Price Review Board’s
annual report for indicates that, in Canada, there is not one therapeutic class that
represents more than .% of the share of sales for patented drugs (PMPRB, ).
erefore, a general analysis of all medical conditions and all drugs related to those
conditions should be included in order to effectively analyze the bona fide effects of
overall pharmaceutical spending.
114 Canadian Health Policy Failures
Fraser Institute | www.fraserinstitute.org
central-planning approach that increasingly characterizes Canadian
health policy. ere is fairly substantial evidence of government-directed
central planning over the supply of physicians in Canada (Ryten et al.,
; Task Force Two, ; Esmail, ). One of the more complete
analyses of the various policies that have affected the supply of physicians
is contained in a paper published by CIHI in . e paper (Chan, )
identified various government policies that had measurable impacts on
reducing the net supply of practicing physicians in Canada during the
s, whether directly or indirectly, including: restrictions on medical
school (Chan, : ), restrictions on physician remuneration (Chan,
: ), central management of the supply of primary care versus spe-
cialist physicians (Chan, : ), policies to induce physician retire-
ments (Chan, : ), restrictions on the entry into Canada of inter-
national medical graduates (Chan, : ), and decisions to lengthen
the required period of primary-care physician training (Chan, : ).
Government control over both medical insurance and funding for
medical education has provided the state with the ability to directly deter-
mine the supply of health professionals. Provincial governments have an
effective monopoly over the training of health professionals at publicly
funded universities. Universities can only train as many physicians as they
have financial resources to accommodate. At the same time, university
tuitions are regulated such that the full cost of medical education can-
not be charged directly to students. Instead, universities rely on public
subsidies from the provinces. erefore, if the provinces reduce funding
for medical education, they can effectively limit the supply of health pro-
fessionals. Furthermore, governments can limit the issuance of licenses
to bill the public health insurance system for medical services provided.
Moreover, because governments also have an effective monopoly over
medical insurance in Canada, they are virtually the only buyer of medical
labor. Licensed health professionals bargain collectively with provincial
governments, which set their fee schedules. Governments can use their
superior bargaining position to suppress the wages of health profession-
als below rates that would be paid in a competitive market. Evidence pre-
sented earlier suggests that Canada’s central-planning approach to man-
aging the supply of physicians has produced suboptimal outcomes. is
Chapter 8: Problematic Canadian health policies 115
www.fraserinstitute.org | Fraser Institute
is consistent with research (Simoens and Hurst, ) which has found
that “countries that have relied to a larger degree on market forces to
determine the number of domestically trained physicians have enjoyed
greater access to doctors than countries that have tried to actively manage
physician supply” (Esmail, : ).
e supply of medical technologies like diagnostic and surgical devices
is also influenced indirectly by the state in Canada. Most medical tech-
nology is employed in hospital settings in Canada. Canadian hospitals
operate on a non-profit basis, and operating financing is structured on
the basis of publicly funded, regionally administered global budgets which
are typically provided with automatic annual incremental increases from
provincial authorities. Economic incentives for hospitals to invest in tech-
nologies that are more cost efficient over the long run are inhibited and
distorted because any cost savings generated from doing so accrue to the
public treasury and are not captured by the hospital itself. e effective
ban on private payment and the global budgeting approach to hospital
finance also tend to restrict the total capital resource base available for
such investments. As Esmail and Wrona (: ) describe it, “Canadian
hospitals are in effect and in practice public entities: they are governed
largely by a political process, given wage schedules for staff, are told when
investment can be undertaken, denied the ability to borrow privately for
investment, told which investments will be funded for operation, and
forcibly merged or closed by provincial governments.” is situation, in
practical effect, means that hospitals are owned by the state, and this gives
the state a monopoly over the purchase and utilization of medical tech-
nology in the health care system. State control over the supply of medical
technology has been shown to be associated with shortages of certain
medical technologies in several countries and by several studies reviewed
by Esmail and Wrona (: –).
For large percentages of the population, access to new drugs is also
controlled by the state through the public reimbursement approval pro-
cesses of federal-provincial-territorial governments. In , the federal-
provincial-territorial (FPT) governments established the Common Drug
Review (CDR). e CDR is tasked with reviewing drugs that are approved
by Health Canada and making recommendations on whether new drugs
116 Canadian Health Policy Failures
Fraser Institute | www.fraserinstitute.org
should be publicly funded by FPT drug plans. e CDR’s decisions are
meant to be based on objective scientific evaluations about the pharma-
coeconomic value of new medicines. Its goal is to determine whether the
benefits of new medicines are worth their expense. e rationale behind
the CDR was to reduce bureaucratic redundancy by replacing the various
provincial agencies for approving reimbursement with a new, central-
ized national process. However, the provinces have not eliminated their
reimbursement approval processes. Governments now wait for a decision
to be issued by the CDR, and then conduct their own reimbursement
decision processes. is central-planning approach used by federal-pro-
vincial-territorial governments influences the availability and utilization
of new medicines for recipients of public drug plans. e available evi-
dence reviewed earlier shows that only a small percentage of new drugs
submitted for reimbursement approval are successful in obtaining the
CDR’s positive recommendation. Notably, Quebec is the only province
that does not participate in the CDR process. Yet research shows that
Quebec reimburses more drugs than are recommended for reimburse-
ment by the CDR. By contrast, all other provinces accept fewer drugs for
reimbursement than are actually recommended by the CDR. Importantly,
there is wide variation in the reimbursement approval rates for new medi-
cines in the provinces, despite the introduction of the Common Drug
Review in . As discussed earlier, if the CDR’s reviews were based
on objective scientific considerations of the pharmacoeconomic value of
new drugs and not on centrally planned rationing decisions driven by
costs alone, then there should not be such variation in reimbursement
decisions among the provinces. e evidence suggests that budget cost
pressures are encouraging provincial governments to restrict their drug
expenditures through policies that control and influence the availability
and use of new medications. Because budget pressures are different in
each province, there are large variations in the number of drugs declared
eligible for reimbursement as well as the time taken to approve new medi-
cations for reimbursement. e reimbursement approval behavior of the
provincial drug plans is consistent with research suggesting that the cen-
tralization of regulatory review commonly fosters rationing in the deci-
sion-making process (Morgan et al., ). is can be seen not only in
Chapter 8: Problematic Canadian health policies 117
www.fraserinstitute.org | Fraser Institute
Canada but also with the Pharmaceutical Benefits Scheme in Australia, the
Pharmaceutical Management Agency in New Zealand, and the National
Institute for Clinical Excellence in the United Kingdom (Pollard, ;
Sundakov, ).
Price controls
Governments in Canada intervene directly in health care by imposing
price and wage (i.e., price of labor) controls to constrain the cost of medi-
cal goods and services. Several problems have been identified with state-
imposed price controls. Frech (: ), for instance, has explained the
economics of price controls, concluding that “governmental price controls
at any level create major problems and impose large hidden costs, mostly
on consumers, through subtle nonprice rationing and changes in quality.”
Esmail, Hazel, and Walker () have argued that estimates of wait times
for access to medical services in Canada are theoretically equivalent to
measurements of excess demand or a shortage of supply, and are evidence
of non-price rationing in the Canadian health system. ey have identified
the lack of market prices as a contributing factor. Giacotta et al. (),
Santerre and Vernon (), Vernon (), Santerre et al. (), and
Gannon et al. () have argued that pharmaceutical price controls have
several negative economic effects, including reducing incentives for inno-
vation and reducing the consumer availability of medicines.
Canadian governments effectively control the price of medical labor by
suppressing the incomes of medical professionals below normal market
levels. At first glance, the international comparative data on the issue is
mixed. Comparisons with OECD data tend to show that Canadian phy-
sicians are fairly well paid compared to the countries for which data is
available. Table shows the coefficient of physician remuneration to
the per-capita GDP for each OECD country for which data was avail-
able for the years –. e data indicates that Canada ranks in
the middle of the OECD in terms of its relative compensation of GPs,
whereas Canada’s rank rises into the top third of OECD countries in terms
of its relative compensation of physician specialists. Yet in most, if not
118 Canadian Health Policy Failures
Fraser Institute | www.fraserinstitute.org
all, of these countries, the state regulates physician earnings in one form
or another, and so comparisons are not capturing the results of signifi-
cant policy differences between international jurisdictions. Comparing
Canadian physician compensation with the US would better illustrate
state suppression of physician incomes because American governments
do not directly intervene to affect physician incomes through health pol-
icy. Notably, US data was not available from the OECD for the period of
study. However, data was available to allow a direct comparison between
Canadian and US data. Table displays data from Skinner et al. ()
research on aggregate spending on physicians and nurses in Canada and
the United States for the most recent year available. e data shows that,
on average, Canadian physicians earn only % as much as American
physicians who are not subject to government-imposed fee structures.
e analysis suggests that the incomes of Canadian health professionals
have indeed been suppressed by Canadian health policy, as they have been
(by implication) in other health systems where the state has intervened to
regulate incomes. Other research comparing domestic physician earnings
within Canada over time provides further evidence of the state’s suppres-
sion of medical incomes. Mullins (b) has shown, for instance, that
after adjusting for inflation, average incomes for all physicians in Ontario
declined in real terms over the years between and . By ,
average physician income in the province was roughly three quarters of
its peak level after adjusting for inflation.
Income differentials between Canadian and American physicians are
probably contributing to incentives for Canadian physicians to emigrate
to the United States, and this, in turn, is partly contributing to physician
shortages in Canada. Skinner (, b) conducted focused, qualita-
tive personal interviews with Canadian-trained physicians who had emi-
grated to the US. e respondents consistently identified US-Canadian
income differentials as a key incentive driving physician emigration to the
US. Research has confirmed that since the early s, many Canadian-
trained physicians have, in fact, left Canada to practice in the United
States (Task Force Two, ). Research by Skinner (, b) using
government data sources suggests that there was a net outflow of physi-
cians from Canada between and . Table shows the estimated

Chapter 8: Problematic Canadian health policies 119
www.fraserinstitute.org | Fraser Institute
Table 19: Ratio of average physician remuneration to per-capita GDP,
OECD countries reporting data, 2003–2005, by GP and specialists, ranked
highest to lowest
Average remuneration of GPs /
per-capita GDP
Average remuneration of specialists /
per-capita GDP
Country 2003 2004 2005 Average
available
data,
2003–2005
Country 2003 2004 2005 Average
available
data,
2003–2005
UK 3.6 3.8 3.7 Belgium 7.4 7.8 7.6
Germany 3.7 3.7 Netherlands* 6 6.3 6.2 6.2
Netherlands 3.6 3.6 3.5 3.6 Austria 5.6 5.6
New Zealand 3 3.5 4 3.5 Australia 5.3 5.3 5.3
Austria 3.4 3.4 Canada 5 4.9 5.0
Ireland 3.4 3.4 UK 4.8 4.8
Canada 3.3 3.3 3.3 Ireland 3.9 4 4.0
Switzerland 3.2 3.2 Switzerland 3.7 3.7
Iceland 3 3.0 New Zealand 3.7 3.6 3.7 3.7
Belgium 2.2 2.3 2.3 Portugal 3.4 3.3 3.3 3.3
Mexico 2.2 2.1 2.1 2.1 Luxembourg* 3 3.0
Australia 2 2.1 2.1 Iceland 2.9 2.9
Czech Rep. 2.1 2 1.8 2.0 Denmark 2.9 2.9 2.8 2.9
Finland 1.9 1.9 1.9 1.9 Germany 2.7 2.7
Hungary 1.7 1.6 1.7 1.7 Finland 2.6 2.5 2.5 2.5
Luxembourg* 1.6 1.6 Mexico 2.6 2.4 2.4 2.5
Greece 2.7 2.4 2.3 2.5
Czech Rep.* 2 1.9 1.95 2.0
Norway 2 1.8 1.6 1.8
Hungary 1.7 1.7 1.7 1.7
Source: OECD, 2007. Calculations by the author.
*Physicians paid on salary and self-employed blended.

Table 20: Average total expenditure on physicians and nurses, Canada
and the United States, 2004
2005 data Data sources
PHYSICIANS
United States:
Total national health expenditure on
physicians
$421,200,000,000 US NCHS (2007)
Number of professionally active physicians 762,438 US NCHS (2007)
Average expenditure on physicians $552,438.36 Authors’
calculations
Canada:
Total national health expenditure on
physicians
$18,536,100,000 CIHI (2007a)
Number of professionally active physicians 69,619 CIHI (2007b)
Average expenditure on physicians $266,250.59 Authors’
calculations
Canada-United States 2005
purchasing
power parity (
PPP) currency conversion rate
1.21 OECD (2008b)
Average expenditure on physicians at 2005
US$ PPP
$220,041.81 Authors’
calculations
Average Canadian physician’s earnings as a
percentage of US physician’s earnings
40% Authors’
calculations
NURSES
Canada (CA$) $48,768* Statistics Canada
(2008b)
United States (US$) $56,880* US Department
of Labor (2008)
Canada-United States 2005 PPP currency
conversion rate
1.21 OECD (2008b)
Canada (US$ PPP) $40,304.13 Authors’
calculations
United States (US$ PPP) $56,880.00
Average Canadian nurse’s earnings as a
percentage of US nurse’s earnings
71% Authors’
calculations
Source: Skinner et al., 2008.
*Though preferable, data for total expenditures on nurses were not available either in Canada or
the United States. Data for reported taxable income are used here as an alternative comparison for
expenditures on nurses.
Chapter 8: Problematic Canadian health policies 121
www.fraserinstitute.org | Fraser Institute
net migration of physicians in Canada for the -year period –
reproduced from Skinner (, b).
e estimates of net migration in each year are based on a calcula-
tion that counts total emigration losses of physicians from Canada, offset
by Canadian doctors returning from abroad and total immigration to
Canada of acceptably qualified foreign-trained physicians. It is important
to count only equally qualified migrants in this estimate. e requirement
for equal qualifications is justifiable because, according to research pub-
lished at the time (Gray, C ), only % of foreign-trained graduates
were able to pass Canadian qualifying exams on their first attempt. For
Canadian-trained graduates, the corresponding figure was %. erefore,
counting raw immigration data toward the final calculation of the net flow
of doctors in Canada would overstate the replacement effect of foreign
immigrants. To be accurate, only those immigrants who can immediately
replace the doctors who leave should be counted. One way to obtain com-
parable data for foreign-trained immigrants is to count only those who
arrive in Canada with arranged employment. CIHI has formerly published
data on this type of immigration. It should be noted that this approach
assumes that those immigrants arriving in Canada without arranged
employment do not have the qualifications to meet Canadian certifica-
tion standards. Another assumption, of course, is that all emigrants from
Canada are qualified to meet Canadian medical standards because they
were active when they left.
In any case, the annual average number of immigrants with arranged
employment as a percentage of the average total annual number of immi-
grant doctors for the five most recent years of available data spanning
– is .%, approximately equal to the % figure cited by Gray
C. () of those foreign-trained graduates who pass Canadian qualify-
ing exams on their first attempt. Table shows the numbers of immi-
grant and emigrant doctors in Canada with adjustments made for equal
qualifications. In summary, the total scope of the brain drain among doc-
tors for the -year period – was a net loss of , Canadian
physicians. e national trend has indicated slower emigration in recent
years. Nevertheless, based on data covering the years from –,
it has been estimated that one in Canadian-born physicians educated

122 Canadian Health Policy Failures
Fraser Institute | www.fraserinstitute.org
during this period ended up practicing in the United States (Phillips et al.,
). Collectively, researchers (Phillips et al., ) have estimated that
“this is equivalent to having two average-sized Canadian medical schools
dedicated solely to producing physicians for the United States.”
Another likely result of the government’s holding medical incomes
below market prices is that it has created disincentives for professionals
to enter lower paid physician practice areas in Canada like family medi-
cine. Evidence shows that fewer medical students are seeking admission to
family medicine specialties (CARMS, ). According to a report by the
Canadian Medical Association (Sullivan, a, b), the proportion
of medical students making family medicine their first residency choice
dropped to % in , down from % in . In , % of the
training positions in family medicine remained unfilled, with one third
of the programs filling %or less of their openings. In these special-
ties, the negative incentives from below-market income opportunities are
likely a significant part of the explanation for shortages. 59
e lack of positive economic incentives to practice medicine in Canada is prob-
ably contributing to regional doctor shortages within provinces. Many rural areas are
underserviced as a result. Governments have resisted introducing market-based solu-
tions to incentivize doctors to move to these regions. Some governments have reacted
to regional shortages by attempting to force doctors into public service through legis-
lation. For instance, in , the province of Quebec virtually conscripted physicians
to practice in geographic locations and under wage and work conditions set by the
provincial government. Bill required physicians to surrender professional auton-
omy in exchange for Medicare billing rights. e bill eliminated choice in location
of practice and required physicians to sign contracts to provide specific services for
their fist years after graduation (Benady, ). Reports in the Canadian Medical
Association Journal from documented that bailiffs, operating under new author-
ity created by Bill , had actually ordered about a dozen physicians to report for
emergency room shifts at hospitals in three underserviced communities (Pengelley,
). In , the Ontario government introduced Bill (Ontario Bill , ). e
first draft of the bill proposed dramatically increasing the province’s central-planning
control over private medical practice. According to Section of the initial bill pro-
posal, health providers and “any other prescribed person, agency or entity” could be
ordered to accept a binding contract with the minister of health and with “any one or
more persons, agencies or entities as directed by the Minister”. Physicians have since

Chapter 8: Problematic Canadian health policies 123
www.fraserinstitute.org | Fraser Institute
been excluded from the provision, following resistance by professionals. However,
the original intentions of the law were clearly to force private practice physicians into
conditions that were not unlike being directly employed by the government. ese
compulsory contracts would have compelled health professionals to meet clinical
objectives defined and evaluated solely by the minister. e minister was to have the
power to issue directives to correct any perceived deficiencies. e penalties for non-
compliance were quite severe: $, for every incidence of refusing to enter into an
agreement or failure to obey a ministerial directive. e intention was that the minister
would be able to directly interfere in the organization of clinical practice, including the
assignment of professional “roles and responsibilities” and related human resources. It
also made individual health providers responsible to the minister for their “collective
responsibilities for health outcomes” and population health status.
Table : Net migration of physicians in Canada, –, adjusted for
qualifications
Year (1)
Total
emigration
from
Canada
(2)
Total foreign
immigration
to Canada of
doctors
with arranged
employment
(3)
Total
number
of Canadian
emigrants
returning from
abroad
(1) + (2) + (3) =
Net loss/gain of
physicians to/
from Canada
1990 –478 107 263 –108
1991 –479 123 256 –100
1992 –689 158 259 –272
1993 –635 184 278 –173
1994 –777 98 296 –383
1995 –674 93 256 –325
1996 –731 61 218 –452
1997 –658 57 227 –374
1998 –568 125 319 –124
1999 –584 67 340 –177
Total –6,273 1,073 2,712 –2,488
Source: Skinner, 2001, 2002b.
124 Canadian Health Policy Failures
Fraser Institute | www.fraserinstitute.org
Price controls also create unintended economic distortions. For exam-
ple, Canada’s federal government directly imposes price controls on pat-
ented medicines. e agency responsible for enforcing drug price regula-
tions is called the Patented Medicine Prices Review Board (PMPRB). e
PMPRB was established in under the Patent Act with a mandate to
regulate the prices for all patented medicines sold in Canada. To deter-
mine if the Canadian price of a patented drug is excessive, the PMPRB
considers the following criteria (PMPRB, ): () e price must be no
higher than the cost of therapy for existing drugs sold in Canada used to
treat the same disease; () New breakthrough drug prices must be limited
to the median of the prices for the same drugs charged in other speci-
fied industrialized countries that are set out in the Patented Medicines
Regulations (France, Germany, Italy, Sweden, Switzerland, the UK, and
the US); () Existing patented drug prices must not increase by more than
the Consumer Price Index (CPI); and () Canadian prices of patented
medicines must never be the highest in the world. Paradoxically, research-
ers (Graham, ; Skinner, b, b; Skinner and Rovere, d,
c) have argued that federal price-control rules on patented drugs
actually distort pricing in drug markets and partially contribute to the high
prices for generic drugs observed in Canada. For example, under PMPRB
rules, for drugs that treat the same health condition, the highest existing
price is used by the federal government as a reference for establishing
the maximum allowable price for new patent-protected drugs entering
the market. When patents expire on brand name drugs, generic drugs
enter the market to compete for sales of those products. Yet, despite these
competitive pressures, manufacturers do not typically reduce the prices
of post-patent brand name drugs. is is because doing so will lower the
maximum allowable entry price permitted by federal regulations for any
new drugs they develop. e price control rules therefore act to fix brand
name drug prices at their introductory levels even in the face of competi-
tive market pressures that would normally encourage price reductions.
And because generics are reimbursed at a percentage of the brand name
price, the prices of generics end up being higher than they would be if the
price control rules did not prevent the brand name reference price from
moving downward.
Chapter 8: Problematic Canadian health policies 125
www.fraserinstitute.org | Fraser Institute
Government control of hospital services
Hospitals can be organized either as private-sector (non-profit or for-
profit) enterprises or as government-owned public-sector entities. Kornai
(, ) and Kornai et al. (: ) have argued that organizations
that face the possibility of financial failure (i.e., “hard budget constraints”)
have stronger economic incentives for efficiency, innovation, and qual-
ity improvement than organizations which can rely on public subsidies
to prevent bankruptcy (i.e., “soft budget constraints”). A key distinction
between the comparative performance of private- (either non-profit or
for-profit) and public-sector organizations is that the former face hard
budget constraints, whereas the latter have soft budget constraints due to
the politicization of funding for such entities.
eoretically, this presents a potential problem for the Canadian
health system because the competitive involvement of private-sector
enterprises in the delivery of publicly funded hospital services is severely
restricted. Deber et al. (: ) have described the technical owner-
ship of Canadian hospitals as mixed, with some being owned by volun-
tary organizations and religious orders, others by municipal or provincial
authorities. Nevertheless, all hospitals are directly governed by regional
boards appointed by provincial governments or elected by voters. e
authors indicate that, in total, less than % of hospitals are privately owned
and governed in Canada and even these often depend on public fund-
ing. According to Deber et al. (: ), governments, “have taken on
greater involvement in the management and planning of the hospital sys-
tem. Although resources in the past were allocated within a command-
and-control model, the degree of state involvement was limited in large
part to deciding the overall amount to spend on hospital care each year.
Indeed, by the mid-s, most provinces had replaced line-by-line hos-
pital budgeting with global budgets to increase hospital flexibility and
planning capability, achieving cost control through enforcement of global
limits. Over time, there has been a change from this loose command-and-
control model, with many provincial governments becoming more activist
and using such levers as altered hospital reimbursement systems, man-
dated hospital closings and mergers, and reallocation of resources from
126 Canadian Health Policy Failures
Fraser Institute | www.fraserinstitute.org
institutional to community-based care.” is policy structure has politi-
cized the operation of Canadian hospitals (Deber et al., : –).
Government restrictions on consumer choice
Governments across the world regulate access to new medical technolo-
gies like drugs on the basis of product safety because it is argued that the
market fails to adequately protect consumers from potential health risks.
In order to ensure that consumers are not harmed by the use of new
medical technologies, Canada restricts consumer choice at the federal
level through Health Canada’s licensing requirements for all new medical
technologies. Data shown earlier suggests that this process delays access
to new medicines by up to approximately one year after clinical testing
is complete.
Federal-provincial-territorial (FPT) health and drug insurance plans
also further restrict consumer choice through the use of health technol-
ogy assessments (HTAs) to determine whether a particular new tech-
nology should be eligible for public reimbursement. Again, data shown
earlier suggests that for those dependent on publicly funded drug plans,
this process adds approximately an additional year to the total delay that
consumers experience before they can access a new drug.
British Columbia has gone further by enacting reference-based drug
reimbursement policies which set the maximum reimbursement limit to
the price of lowest cost of approved products in the same therapeutic class.
In at least one class of drugs, BC has implemented therapeutic substitu-
tion policies which further restrict public funding only to the lowest cost
drug product in a therapeutic class, even though the available drugs are of
dissimilar chemical structures. erapeutic substitution was implemented
for a group of patented drugs called proton pump inhibitors (PPIs) in
. e policy required patients using a PPI to switch from their current
prescription product to the least expensive patented PPI comprised of a
different chemical molecule for medically unnecessary reasons.
Schneeweiss et al. () studied the impact of therapeutic substitu-
tion among seniors for this class of drugs in BC and found savings from
Chapter 8: Problematic Canadian health policies 127
www.fraserinstitute.org | Fraser Institute
price substitution of roughly $. million for the provincial PharmaCare
program in the first six months of the policy. More recent research studied
the impact of BC’s therapeutic substitution policy on the entire popula-
tion of PPI consumers, accounting for net overall health utilization, and
found approximately $. million in avoidable health expenditures for
public and private payers caused by the policy in its first three full years
(Skinner, Gray, and Attara ). e costs identified by Skinner, Gray,
and Attara () are theoretically explained by unnecessary transaction
costs incurred by patients as they complied with the systemic require-
ments associated with switching to the government-approved drug, and/
or from possible negative health impacts due to discontinued or inter-
rupted drug therapy or adverse reactions associated with the biochemi-
cal dissimilarity of the reference drug. e results of Skinner, Gray, and
Attara () are consistent with other research by Gaebel, Toeg, and
Levine (), who studied therapeutic substitution under federal drug
plans for the same class of drugs among aboriginal populations in Canada,
finding evidence of negative health impacts.
www.fraserinstitute.org | Fraser Institute
Chapter
Economically liberal solutions
Socioeconomic limitations of markets and governments
e ability of markets to optimally achieve certain social outcomes is limited.
e socioeconomic limitations of markets have been theoretically framed as
“market failures,” thus implying the need for government intervention (Baumol,
; Bator, ; Arrow, ). More specifically, a number of “market fail-
ures” have been cited to justify state intervention in the provision of medi-
cal services and medical insurance (Arrow, ; Evans, , , a,
b; Rice, ).
On the other hand, there are also significant economic and social problems
associated with government intervention in markets which have been con-
ceived as “government failures” (Hayek, ; Friedman, ; Buchanan and
Tullock, ; Schultze, ; Wolf, , ; Becker, , ; Mueller,
, , ; Le Grand, ; Mitchell and Simmons, ; Stiglitz, ;
Tullock, Seldon, and Brady ).
Applying this thinking more specifically to health care policy, Pauly
(, , , , , ), Gaynor and Voigt (), and others
have argued that many of the theoretical allegations of market failures in
health care are misconceived, are equally applicable to government-based
approaches to health policy, and that there are many additional theoretical
limitations unique to government involvement in health care which are not
associated with market-based approaches. In particular, government failures
have been specifically identified when the state becomes a direct provider of

130 Canadian Health Policy Failures
Fraser Institute | www.fraserinstitute.org
medical insurance or medical services. is was demonstrated, for instance,
in Buchanan’s () paper which identified and analyzed some of the fail-
ures of the state-based approach to health policy under the United Kingdom’s
national health system.
In practice, there are no working examples of health care systems that are
based on an absolute reliance on either markets or government. An obvious
tension between political preferences for social equity and economic effi-
ciency is reflected in the policy structures of all OECD countries. It seems
that the practical policy challenge is to identify the most appropriate balance
of scope for both markets and government intervention.60 Determining the
appropriate scope of markets and governments depends on the nature of the
policy goals, and these, in turn, depend both on political values and economic
constraints. Nevertheless, if goals are specified clearly and appropriate infor-
mation is available, then it would seem that standard cost-benefit analysis
can be used to determine the best combination of market-based and govern-
ment-based policy approaches that will most optimally achieve stated policy
goals.61 With this in mind, the following sections discuss the uniqueness of
Canada’s health policy structure in an international context, and some of the
key aspects of Canadian health policy that might be considered problematic.
It also examines the merit of several economically liberal policy reforms that
As Pauly (: –) says, in reality, policy makers can choose between
“imperfect markets versus imperfect governments.” Pauly suggests that theory and
empirical evidence favor the proposition that the market, not government inter-
vention, should be the base assumption for policy; that state action should be mini-
mized when it is deemed to be necessary; and that justification for state action
should require a demonstration that a non-market approach would produce better
outcomes than the market.
Le Grand (: ) has argued, for instance, that “it is important to re-empha-
size that a study of government failure does not imply that governments always fail,
still less that markets always succeed. Whether a particular form of government inter-
vention creates more inefficiency or more inequity than if that intervention had not
taken place is ultimately an empirical question and one that is by no means always
supported by the evidence. Governments sometimes succeed, a fact that should not
be lost to view in the current glare of the market’s bright lights.”
Chapter 9: Economically liberal solutions 131
www.fraserinstitute.org | Fraser Institute
offer the potential to improve the performance of the Canadian health system,
but which have not been adopted by Canadian policy makers.
Commonality of economically liberal health policies
ere are several economically liberal approaches to health and prescrip-
tion drug policy that, in a global context, represent moderate or incremen-
tal movements from the status quo in Canada. Economic theory, experi-
mental economic research, applied economic analysis, and international
experience strongly suggest that the policies discussed in this chapter
could improve the availability of medical resources and introduce alloca-
tive efficiencies without undermining the fundamental social goals that
serve as the explicit rationale for Canada’s health policy.
In general, economically liberal types of policies are increasingly com-
mon in most other OECD countries with social goals for health care that
are similar to Canada’s (Ovretveit, ; Scott, C, ; McKee and Healy,
; Mossialos et al., ; Irvine, Hjertqvist, and Gratzer ; Esmail
and Walker, a). Annual research by Esmail and Walker () has
shown that many OECD countries currently employ versions of such
policies showing that there are alternative, often more efficient ways
to achieve Canada’s social goal of universal health insurance coverage.
Indeed, research published by the World Health Organization (Mossialos
et al., ; McKee and Healy, ), Sweden’s Nordic School of Public
Health’s Faculty of Medicine (Ovretveit, ), and others (Scott, C., )
confirms that the policy trend in OECD countries since the s has been
toward the introduction of economically liberal health policy reforms.
Table compares the use of economically liberal health policies
among OECD countries (among the for which data are available)
that attempt to socially guarantee universal health insurance coverage.
According to Esmail and Walker (), as of , Canada was one of
only five OECD countries that did not require cost sharing for publicly
funded hospital or physician services. All other OECD countries have
some type of consumer/patient cost sharing for the use of publicly funded
hospital care, general practitioner care, and/or specialist care.

Table : Parallel private medical insurance and patient cost sharing for publicly
funded health care in OECD countries, as of
Country Consumer/patient cost sharing
required for publicly funded
health care goods/services
Private for-prot
hospitals billing
public insurer
Private
comprehensive
medical insurance
available
Hospitals GPs Specialists Prescription drugs
Australia YES YES YES – YES
Austria YES YES YES YES YES YES
Belgium YES YES YES YES YES YES
Canada – – – YES – –
Czech Rep. – – – – YES YES
Denmark – – – YES – YES
Finland YES YES YES YES – YES
France YES YES YES YES YES YES
Germany YES YES YES YES YES YES
Greece YES YES YES YES YES YES
Hungary YES YES YES – – YES
Iceland – YES YES YES – YES
Ireland YES YES YES YES – YES
Italy – – YES YES YES YES
Japan YES YES YES YES YES YES
Korea YES YES YES YES YES YES
Luxembourg YES YES YES YES YES YES
Netherlands YES YES YES YES YES YES
New Zealand – YES YES YES – YES
Norway – YES YES YES – YES
Poland YES YES YES YES – YES
Portugal YES YES YES YES YES YES
Slovak Rep. – – – YES – YES
Spain – – – YES YES YES
Sweden YES YES YES YES – YES
Switzerland YES YES YES YES YES YES
UK – – – YES – YES
Source: Esmail and Walker, 2008.

Chapter 9: Economically liberal solutions 133
www.fraserinstitute.org | Fraser Institute
Table also shows that among the OECD countries, Canada was
also the only country where private insurance for hospital and physician
services was not available.
Price mechanisms
Flat percentage copayments, user fees, extra billing, and flat-rated premium-
based financing are price mechanisms that would theoretically be expected
to make government health insurance more sustainable and introduce
incentives that would more efficiently allocate medical resources. Price
mechanisms would also mitigate the need for central-planning mechanisms
to control costs. Price mechanisms could also allow costs to be shifted off
the public system, taking the pressure off of public finances.
Some experts have cautioned against the introduction of user fees for
publicly funded health care (Barer, Evans, and Stoddart ; Beck and
Horne, ; Barer, Bhatia, Stoddart, and Evans, ). However, such
policies are increasingly common in other countries’ health systems
(Blomqvist, b; Robinson, ; Irvine and Gratzer, ; Esmail and
Walker, ). In fact, within Canada, user fees are currently commonly
charged for things like ambulance services and publicly funded drug ben-
efits.62 Cost sharing is widely acknowledged as an effective way to counter
incentives for overutilization that result from the cross-subsidy associated
with risk pooling under insurance. Insurance subsidization reduces the
effective price of consuming the insured goods or services and thereby cre-
ates an incentive for increased demand for those goods and services; this
can lead to overutilization or inefficient substitution choices (Feldstein,
). is problem is theoretically worse under health insurance systems
that offer first-dollar coverage of health expenses. is is referred to as
“zero-deductible” or “full” insurance, and the Canadian Medicare system
is an example of this type of insurance system. In addition, because health
In his proposal for a publicly funded national catastrophic drug insurance program,
Roy Romanow also recommended that patients should pay the first $, in drug
expenses out-of-pocket before being eligible for public drug coverage (Romanow, ).

134 Canadian Health Policy Failures
Fraser Institute | www.fraserinstitute.org
care is paid for mostly through progressively adjusted income taxes in
Canada, the subsidization effect is even stronger than under premium-
financed full-insurance schemes.63
e problem of excessive, inefficient demand in the absence of a price
has been empirically demonstrated (Keeler et al., ; Newhouse et al.,
; Manning et al., ; Keeler et al., ; Keeler, ; Buchanan et
al., ; Newhouse et al., ). e RAND Health Insurance Experiment
(HIE) (Newhouse et al., ) confirmed that consumers will overutilize
health care when insurance covers too much of the cost of medical goods
and services. e RAND HIE remains the largest and longest running tests
of health insurance designs. e experiment essentially set up a health
insurance company and attracted customers who signed onto plans that
ranged from a zero deductible to a % copayment with varying levels of
benefits coverage. e experiment spanned over five years and included
more than , non-elderly participating families—over , partici-
pants in total.
e results showed that demand for medical services was indeed
affected by deductibles and other forms of consumer copayments. e
study showed that the more families paid out-of-pocket, the fewer medi-
cal services they used. In fact, for all types of service, including physi-
cian visits, hospital admissions, prescriptions, dental visits, and mental
health, use fell with cost sharing. Access to some health services is depen-
dent on physician referral, so there was a multiplier effect that resulted
from the reduction of demand for physician services. Most importantly,
As many others have pointed out, medical overutilization has natural limits. For
example, Canadian health insurance pays for brain surgery, yet the demand for this
service is hardly out of control. Clearly, the value to the consumer is to avoid such a
procedure unless it is necessary to restore good health. But aside from such serious
procedures, there are many health services which people demand more of than are
necessary. Examples include using emergency rooms instead of walk-in or family clin-
ics, making unnecessary visits to a physician for minor routine illnesses, for illnesses
which will resolve themselves naturally, or for which home remedies would be just as
effective, unnecessary overconsumption of prescription drugs and diagnostics, and a
lack of incentives to encourage efficient substitutions and trade-offs between compet-
ing treatment options with lower costs and adequate effectiveness.
Chapter 9: Economically liberal solutions 135
www.fraserinstitute.org | Fraser Institute
the reduced utilization under the cost-sharing plans had little or no net
adverse effect on health for the average person. According to the results
of the study, the only exception was health among small, identifiable sub-
populations. Utilization among the six percent of the population with
the lowest incomes was most sensitive to cost-sharing plans, and some
negative health effects were noticed. But importantly, within this group,
the negative health effects of reduced utilization were limited to specific
conditions. For example, the study found that those with pre-existing
high blood pressure saw their blood pressure lowered more under the
zero copayment plan versus the cost-sharing plans, presumably because
there were no disincentives to receiving preventative care. Similarly, those
with no copayments fared better than those who had a copayment for
vision correction, gum disease, tooth decay, and anemia in poor children
(Newhouse et al., ).
Overall, the study concluded that there was some specific, relatively
minor health consequences from cost sharing concentrated among the
sick poor, but that the vast majority of the population was neither sick
nor poor and there were no substantial adverse health effects from cost
sharing for this group. erefore, according to the findings, health benefits
among the sick and poor could be achieved at substantially lower cost
than through a universal system of free care (like Medicare) for all ser-
vices. In other words, a targeted insurance benefit offering full insurance
reimbursement only for specific medical services for the poor can obtain
better health gains overall without incurring the costs and inefficiencies
of fully covering medical services for everyone (Newhouse et al., ).
In summary, the RAND experiment showed that there is a significant
difference in the amount of health care demanded under Medicare-style
health insurance and the demand for health care under systems with some
type of consumer copayment. e results indicated that up to % of the
demand for health services is unnecessary because there are no adverse
health effects for those who reduce demand under copayment plans. e
weight of available evidence strongly suggests that in the absence of con-

136 Canadian Health Policy Failures
Fraser Institute | www.fraserinstitute.org
sumer copayments, there is a significant problem of excess and inefficient
demand.64
Competitive private-sector delivery of medical goods and
services
Competitive private-sector delivery of publicly funded medical services
might also be expected to produce improvements to Canadian health care.
Traditional economic theory holds that competition produces an optimal
combination of quality and costs, and most efficiently allocates resources
to satisfy the unique needs and preferences of individual consumers. e
weight of empirical economic evidence about hospital performance under
private versus public ownership also suggests that permitting competitive
private-sector delivery of publicly funded hospital services would help to
optimize access to medical care in Canada.
Deber et al. () have argued that international experience recom-
mends the value of private-sector delivery of medical goods and services.
Indeed, private-sector hospital services, delivered either by non-profit or
for-profit enterprises, are commonplace in many OECD countries with
similar social goals as Canada. For-profit hospitals are far less common
than non-profit private-sector hospitals in all OECD health systems, but
data shown earlier indicate that at least OECD countries permitted for-
profit hospitals to deliver publicly funded health care services.
Most of the applied economic research on hospital performance under
private versus public ownership has studied the US hospital system. e
US hospital system is characterized by a mix of private (non-profit or for-
profit) and public hospital ownership structures, and a mix of private and
public sources of funding. According to data provided by the American
Hospital Association (Health Forum LLC, ), as of , about .%
of all community hospitals in the US are categorized as private-sector hos-
pitals: for-profit hospitals make up only .% of all community hospitals
Irvine and Gratzer () published a detailed review of the literature on this
topic and reached the same conclusion.

Chapter 9: Economically liberal solutions 137
www.fraserinstitute.org | Fraser Institute
in the US, whereas non-profit private-sector hospitals account for .%.
Government hospitals account for the remaining .% of community
hospitals. Unfortunately, the research on public versus private hospital
ownership is often confused with other studies which focus on the com-
parative performance of non-profit and for-profit hospitals, which are
mostly all private organizations in the US. Furthermore, the literature
on the comparative performance of non-profit and for-profit hospitals
is mixed.65
For example, Woolhandler and Himmelstein () found that the
total cost of care at for-profit hospitals in the US were higher than at
non-profit hospitals. Woolhandler and Himmelstein () later reviewed
some of the literature concluding that no peer-reviewed studies showed
that costs were lower in for-profit hospitals. Devereaux et al. () pub-
lished a meta-analysis66 concluding that for-profit hospitals were associ-
ated with higher payments for services delivered compared to non-prof-
its. Devereaux et al. () conducted an earlier meta-analysis of studies
comparing mortality rates in non-profit and for-profit hospitals in the
US, concluding that there was higher patient mortality rates associated
with for-profit hospitals. Guyatt et al. (: E) used a similar approach
to study health outcomes of hospital patients in Canada (described as
having exclusively non-profit hospitals) and the US (described as having
Comparing the performance of hospitals requires complex adjustments. Horwitz
(), for instance, has found that ownership structure influences the mix of services
offered by a hospital, and hence the types of patients admitted. Her findings suggest
that cases with high potential profitability are more likely to be treated in a for-profit
facility. It is unclear from her research whether these cases would represent higher
or lower risks. Complex cases might represent higher costs of care, but this might be
offset by higher marginal revenues; therefore, more profitable cases might be more
complex. e reverse could also be true. Either could skew comparisons between for-
profit and other hospital ownership types.
Meta-analysis attempts to quantitatively aggregate the results of independent
studies which have used similar methodology. However, the studies aggregated in the
Devereaux et al. () and Devereaux et al. () papers did not all use the same
methodology or data criteria, and therefore it was not scientifically valid to pool the
results in a meta-analysis.

138 Canadian Health Policy Failures
Fraser Institute | www.fraserinstitute.org
mixed non-profit and for-profit hospitals), concluding that health out-
comes “may be superior” in Canada, though the authors acknowledged
that their results were inconclusive.
is body of research has drawn significant criticism from other
researchers. For example, the methodology of the Devereaux et al. ()
study has been criticized by Deber () and Gratzer and Seeman
().67 Naylor () has also been critical of the methodology used
Among the problems identified by others, Devereaux et al. () probably also
misinterpreted two studies included in their meta-analysis. e authors interpreted
McClellan and Staiger () as favoring the performance of non-profit hospitals when
that study appears to show the opposite results—that mortality outcomes at for-profit
hospitals were better than at non-profit hospitals once other factors were accounted
for. e abstract from McClellan and Staiger () states, “do not-for-profit hospi-
tals provide better care than for-profit hospitals? We compare patient outcomes in
for-profit and not-for-profit hospitals between and using a new method
for estimating differences across hospitals that yields far more accurate estimates of
hospital quality than previously available. We find that, on average, for-profit hospitals
have higher mortality among elderly patients with heart disease, and that this differ-
ence has grown over the last decade. However, much of the difference appears to be
associated with the location of for-profit hospitals. Within specific markets, for-profit
ownership appears if anything to be associated with better quality care. Moreover, the
small average difference in mortality between for-profit and not-for-profit hospitals
masks an enormous amount of variation in mortality within each of these ownership
types. Overall, these results suggest that factors other than for-profit status per se
may be the main determinants of quality of care in hospitals” (McClellan and Staiger
: ). Another study (Pitterle et al., ) that was interpreted by Devereaux et
al. () as favoring the performance of non-profit hospitals also appears to have
reached the opposite conclusion. e study presented its results in a series of tables
statistically showing the relationship between a set of variables and mortality out-
comes for patients. One of the key variables was hospital ownership structure, which
was described according to three types: public, private for-profit, and private non-
profit. A statistic showing the slope of the relationship for each variable was pre-
sented. e slope indicated the variable’s direction of association with the observed
outcomes, in this case patient mortality rates. e study stated that “a negative slope
showed an inverse relationship for a variable, and was associated with a reduction
in mortality, whereas a positive slope was associated with an increase” (Pitterle et
al., : ). e study’s results show that both types of privately owned hospitals
(for-profit and non-profit) had statistically significant negative slopes, meaning that

Chapter 9: Economically liberal solutions 139
www.fraserinstitute.org | Fraser Institute
by Devereaux et al. (), but argued that the findings were nevertheless
consistent with the overall literature. is is supported by claims made by
Woolhandler and Himmelstein () that the literature supports the view
that for-profit hospitals do not perform better than non-profit hospitals.
However, Ferguson (b) has directly challenged the conclusions
drawn by Woolhandler and Himmelstein (). Ferguson conducted a
detailed, comprehensive review of the literature and found that one pre-
vious review alone had cited at least five peer-reviewed studies which
found lower costs associated with for-profit hospitals. Ferguson also sep-
arately identified eight studies which favored for-profit hospital perfor-
mance using measures of efficiency or some type of quality-adjusted cost.
Ferguson further cites three other comprehensive reviews of the literature
including Sloan (), Donaldson and Currie (), and Marstellar,
Bovbjerg, and Nichols (), concluding that “all three reviews find, in
the peer-reviewed literature, some articles which find for-profits to be
more efficient, some which find not-for-profits to be more efficient, and a
lot of articles which find no difference in efficiency” (Ferguson, b: ).
is conclusion is supported by Sloan and Vraciu’s (: ) study of
Florida hospitals, which found that “ownership (investor-owned versus
not-for-profit) is a poor predictor of a hospital’s willingness to treat low-
income patients, costs to the community and profitability.” Ferguson’s con-
clusion is also consistent with research by Duggan (), which found
that non-profit and for-profit hospitals have similar performance out-
comes because they operate under similar economic incentives within
“hard budget” constraints. According to Duggan (: ,), “the critical
difference between private for-profit, private not-for-profit, and publicly
owned firms in the hospital industry is caused by the soft budget constraint
of government-owned institutions. Public hospitals were unresponsive to
reduced mortality rates were associated with a private ownership structure for hos-
pitals. By contrast, the study found no statistically significant relationship between
publicly owned hospitals and mortality rates. is meant that private hospitals were
comparatively superior to public hospitals. Notably, the statistical link between own-
ership structure and reduced mortality was stronger for private for-profits than it was
for private non-profits.
140 Canadian Health Policy Failures
Fraser Institute | www.fraserinstitute.org
financial incentives because any increases in their revenues were taken by
the local governments that own them.”
Pluralistic, competitive social health insurance
Canada could also achieve its basic social goals for health care by replac-
ing its single-payer health insurance system with a more economically
liberal system of pluralistic, competitive social health insurance. is is
not as radical a policy departure from the status quo as it might initially
appear to be. Table displays OECD data for health spending by source
of finance. e data is ranked in ascending order according to the degree
to which a country relies on pluralistic social insurance approaches in
order to achieve universal health insurance coverage for its population.
e data indicate that pluralistic social health insurance approaches are
common among OECD countries, something confirmed by several analy-
ses in the literature (e.g., Blomqvist, ; Deber et al., ; Ovretveit,
; Ramsay, ; Scott C., ; Mossialos et al., ; Esmail and
Walker, ).
Unlike the Canadian approach, pluralistic social insurance policy
structures do not rely on the state to be a direct provider of either health
insurance or health services. Instead, pluralistic social health insurance is
based on a regulatory and redistributive function for the state. Experience
shows such insurance approaches can achieve universal coverage without
the state being involved as a direct provider of medical insurance or medi-
cal goods and services. Normand and Busse () describe social insur-
ance as having several general characteristics: () health insurance cover-
age is universally mandatory; () this is achieved through group insurance
for the working population, where health insurance is funded through
employer/employee-based contributions, or it is achieved by making indi-
vidual purchase compulsory; () insurance provision is pluralistic: there
are multiple quasi-public insurance funds (e.g., Austria, Belgium, France,
Germany, Luxembourg) or multiple competitive private-sector (non-
profit or for-profit) providers (e.g., Switzerland, Netherlands); () there
are significant government subsidies for non-employed and low-income

Table 23: Health care financing, by source, percentage of total health
expenditure (THEX), OECD, 2006
OECD country Social health
insurance, %
of THEX
Public health
and gov’t
insurance, %
of THEX
Private
insurance, %
of THEX
Personal
payment, %
of THEX
Sweden – 81.7 – –
Australia 0.0 67.7 7.5 18.2
Denmark 0.0 80.0 1.5 14.3
Italy 0.1 77.1 0.9 20.2
Ireland 0.7 77.6 8.4 12.4
Portugal 0.8 69.7 4.1 22.8
Canada 1.4 69.0 12.6 14.5
Spain 5.2 66.1 6.0 21.5
Norway 12.5 71.1 – 15.6
United States 13.1 32.7 36.0 12.8
Finland 14.9 61.1 2.2 18.7
Mexico 26.6 17.6 3.4 52.4
Iceland 27.4 54.5 0.0 18.0
Switzerland 43.0 17.2 8.5 30.3
Korea 43.1 12.6 3.4 35.9
Austria 44.7 31.5 4.7 16.5
Belgium 56.8 12.8 4.9 20.9
Poland 58.6 11.3 0.6 25.6
Hungary 60.1 10.8 1.3 22.6
Slovak Rep. 61.2 7.1 – 25.9
Japan 64.0 15.4 2.6 15.1
Germany 67.5 9.3 9.2 13.2
Luxembourg 70.3 20.6 1.7 6.5
France 74.6 5.1 12.8 6.7
Czech Rep. 78.8 9.2 0.2 11.5
Source: OECD, 2008.
Notes: Other sources of health spending (e.g., direct spending by non-governmental organiza-
tions and companies) not shown, therefore percentages may not total 100%. Incomplete data
reported for Sweden, Norway, and Slovak Republic. Some countries among the OECD 30 not
shown due to missing data.

142 Canadian Health Policy Failures
Fraser Institute | www.fraserinstitute.org
people, and sometimes a degree of direct government insurance provi-
sion through programs targeting specific subpopulations; and () there
is significant regulation of the insurance product and insurance market
conduct.
Among universal, pluralistic social health insurance systems,
Switzerland and the Netherlands have limited the scope of direct gov-
ernment involvement in medical insurance and medical services the most.
Both countries have a system of compulsory individual purchase of pri-
vate68 health insurance, coupled with publicly funded subsidies for low-
income people to achieve universal coverage. Government’s role is mostly
limited to redistributing income subsidies to individuals and regulating
the market to achieve defined social goals (Enthoven and Wynand, ;
Frank and Lamiraud, ; Glied, Hartz, and Giorgi ; Van Kleef et
al., ). For Canada, moving to a regulated, competitive, pluralistic
private market for health insurance, generally similar in principle to that
in Switzerland or the Netherlands, could introduce the benefits of market
dynamics while ensuring universal coverage for the population on accept-
able social terms. Such a health insurance model would also likely be
more comprehensive (including drugs, for instance) than Canada’s current
patchwork of public programs and would largely remove the incentives
for governments to centrally ration access to medical goods and services.69
Some researchers have argued against the introduction of any type of
private-sector health insurance, citing problems associated with the ability
of competitive markets to achieve certain social outcomes, cost control
and administrative efficiency, and ideological concerns about redistribu-
tive impacts (Evans, , a; Deber et al., ; Wilson, ; Hurley
et al., ; Tuohy, Flood, and Stabile, ). Others have argued that it
is unrealistic to take absolutist positions in favor or against either wholly
state-based or market-based approaches to health insurance as no such
system exists and few serious researchers recommend either approach
Mostly non-profit insurance organizations; however, for-profit insurance provid-
ers also offer coverage.
Under such a model, there would be no need for central agencies to make ration-
ing choices on behalf of the population.
Chapter 9: Economically liberal solutions 143
www.fraserinstitute.org | Fraser Institute
(Pauly, ; Gaynor and Vogt, ). Many experts also argue that the
weight of theory, applied economic research, and international experience
show that a mixed approach characterized by a pluralistic insurance sys-
tem with appropriate government regulation and subsidization (similar
in principle to the Swiss or Dutch social insurance systems) can achieve
essential social goals while better encouraging sustainable demand for,
and allocation of, health technology and capturing overall efficiency gains
(Newhouse, Phelps, and Schwartz, ; Blomqvist, ; Pauly, Danzon,
Feldstein, and Hoff, ; Newhouse et al., ; Feldman, Escribano, and
Pellise, ; Feldstein, ; Gruber, ). According to Pauly, Danzon,
Feldstein, and Hoff (), economists have advocated this approach to
achieving universal health insurance coverage in the United States as
early as Feldstein (). To my knowledge, the earliest published refer-
ence to a proposal for reform of this nature for Canada was Blomqvist
(). However, Taylor () makes reference to similar proposals by
the Canadian Medical Association (CMA) during the early development
of the current health care system in Canada. As far as can be ascertained
from Taylor’s account, these proposals seemed to resemble the pluralistic
social insurance models of modern day Switzerland and the Netherlands.
Patient/consumer choice
Finally, there might also be room for increasing the scope of consumer
choice in health care, especially regarding the assessment of risk associ-
ated with innovative medical technology. As mentioned earlier, one of the
ways that governments restrict consumer choice in health care is through
policies that are designed to reduce the risk of harm from unsafe medical
technology. For example, part of the rationale used to justify pre-market
regulation of drug safety is that the market is not as effective as govern-
ment regulators at reducing the harm that might be caused by unsafe drug
products due to imperfect and “asymmetric” (or unequal) information
between sellers (medicine producers) and buyers (patients) (Arrow, ).
Specifically, consumers face an information deficit about the qualities of
new drugs which leaves them exposed to potential harm. At the same time,
144 Canadian Health Policy Failures
Fraser Institute | www.fraserinstitute.org
it is alleged that drug companies might have a profit incentive to carry
out insufficient clinical testing or overemphasize their product’s benefits
while downplaying its adverse effects. An additional assumption is that
the information asymmetry facing consumers is not adequately mitigated
by the presence of a physician acting as an expert agent. ere is also an
assumed absence of other market mechanisms—like non-governmental
organizations which promote consumer product safety or publish vari-
ous consumer reports—that could resolve this issue in the absence of
government intervention. erefore, it is reasoned, individuals cannot
be left to use their own judgment when obtaining new medicines and a
centralized government regulator should limit individual choice about
the use of drugs to protect the public health. e potential harm that can
be caused by an unsafe drug rises to a level of seriousness that demands
pre-emptive risk reduction strategies.
Skinner (a) has argued that this criticism of the market is too
extreme and overestimates the capacity of the state to produce better out-
comes than the market. First, generally speaking, firms (especially drug
companies, given the seriousness of the consequences for human health)
have a strong incentive not to misrepresent the safety of their products
because doing so could damage their reputation in the market and ulti-
mately destroy demand for their products altogether. Further, penalties
for unethical corporate behavior can be enforced through the legal system
via tort and sometimes even criminal charges if harm comes to consum-
ers from unsafe products. Patients can also rely on the expertise of their
physician to partially close the information gap about drug products. e
requirement for consumers to obtain an expert opinion via an examina-
tion and prescription from a physician already makes the consumption
of drugs uniquely more controlled than the consumption of other goods
and services which could also be dangerous. e availability of expert
agents that can be contracted to act on behalf of consumers is a way for
the market to reduce information asymmetry. Obviously, the relationship
between consumers and expert agents can be distorted if the expert has a
conflicting financial interest in the advice given. For instance, if a physi-
cian were to receive a financial benefit from prescribing a given type of
treatment, this could create a conflict of incentives between serving the

Chapter 9: Economically liberal solutions 145
www.fraserinstitute.org | Fraser Institute
interests of the patient and gaining financially from prescribing something
that might not necessarily benefit the patient. But again, expert agents
face strong disincentives for unethical behavior because their reputations
can be damaged and they are also subject to tort and legal liabilities from
malpractice, as well as penalties applied by their professional associations.
And again, the professional relationship between physicians and patients
is uniquely more regulated and affected by disincentives for bad behavior
than virtually any other comparable societal transaction.
Second, the capacity of the state to do better than these market-based
incentives is questionable. Approving a new drug requires regulators to
make decisions with imperfect knowledge. ere are significant limita-
tions to the information that can be generated by pre-market clinical trials
as well as post-market drug surveillance. Imperfect information leaves
regulators in a position of uncertainty, yet there are diminishing returns
from increased drug testing designed to further reduce uncertainty.70
Excessive caution can lead to the loss of potential health benefits from
obtaining new medicines sooner. ese losses are not obvious to the pub-
lic but they are real nonetheless. Paradoxically, regulatory safety review of
new medical technologies is a time consuming and imperfect process that
comes at the cost of promoting public health. Delaying or denying access
to important new medicines can negatively affect patients’ health out-
comes. at there are trade-offs between increased safety and lost health
benefits is confirmed by recent research which found that faster reviews of
new drugs by the US FDA have been associated with higher counts of seri-
ous adverse reactions in the US (Olson MK, ). On the other hand, it
has been estimated that earlier access to new drugs because of faster drug
reviews by the FDA saved hundreds of thousands of life-years (Philipson
et al., ). Slower drug approvals can also produce other unintended
outcomes. For instance, the longer a new drug is kept off the market while
To make matters worse, not only do regulators operate in an environment of
uncertainty, they also face conflicting incentives when trying to reduce the potential
for errors in drug-approval decisions that might encourage them to be excessively
cautious. e burden of error does not affect regulators in the same way that it affects
patients. is is discussed further in chapter .
146 Canadian Health Policy Failures
Fraser Institute | www.fraserinstitute.org
waiting for government’s safety approval, the shorter the effective period
under which a drug can be sold with patent protection. e resulting loss
of profitable returns for the drug’s inventor can negatively affect the capac-
ity and incentives for developing new medicines (Vernon, ). is, in
turn, could conceivably harm future generations of patients.
Skinner (a) has identified and classified five underappreciated
concepts that might help with assessing risk in a broader context. A new
context for assessing risk might create a rationale for expanding for con-
sumer choice in health care by incrementally relaxing regulatory safety
standards. ese five concepts complement the regulatory process by
offering a greater degree of objectivity in determining whether a drug
should or should not be available to patients and in minimizing the nega-
tive externalities associated with regulatory decisions. Applying this con-
ceptual framework to the assessment of drug risk might help optimize
patient/consumer choice and access to new medicines. e five concepts
suggest that risk should be evaluated with regard to: () the net risk that a
drug represents after accounting for its potential health benefits; () the
weighted risk and benefit of alternative treatments; () the alternative
risk that a drug represents relative to available therapeutic alternatives,
including the possibility that there are no existing alternatives; () the
universal risk that a drug represents relative to the risk already accepted
by the public in using many other types of regulated and non-regulated
goods, services, and activities—even those that are not directly compa-
rable to drugs; and () the identifiable risk, or whether there are particular
patient characteristics that make only certain people susceptible to the risk
statistically associated with the drug’s use. ese concepts are explained
in more detail below:
Net risk
A drug’s risk cannot be assessed in isolation from its benefits. For instance,
if clinical evidence showed that in , patients showed an increased
health risk statistically associated with the use of a particular drug,
would this be unacceptable? If it were also known that health conditions
improved in of , patients treated with the same drug, would the
risk assessment change? In general, research strongly supports the view

Chapter 9: Economically liberal solutions 147
www.fraserinstitute.org | Fraser Institute
that the public health benefits of new drugs tend to far outweigh the risks.
For instance, as discussed earlier in this chapter, it has been estimated that
the human health costs of government-imposed delays in giving safety
approval to drugs in the United States were far greater than the health
benefits derived from avoiding the side effects of new drugs.
Weighted risk and benefit71
Accurately assessing the net risk of a new drug depends on the qualitative
difference between the severity of the risks and the value of the benefits
being compared; or, in other words, what are the weighted risks and ben-
efits? e adverse events statistically associated with new drug products
can be more serious relative to the benefits, thus making the potential risks
weigh much heavier in any regulatory decision. In some cases, preventing
serious adverse events statistically associated with a drug affecting few
people might be more important than capturing the benefits experienced
by many people if the benefits are not directly related to the prevention
of equally serious health risks. For example, a pain reliever might bring
comfort and relief to millions, but this particular benefit might be less
important than saving a small number of people from heart failure sta-
tistically associated with the use of a drug.
Alternative risk
While the use of medicines for treating illness and disease is sometimes
statistically associated with degree of risk, this risk must also be assessed
against the degree of risk inherent in any alternative treatments that would
have to be used in the absence of a new drug. e risks associated with
a drug might also be compared to the risks associated with other non-
drug comparators like invasive surgery, which as an alternative treatment
for the same health condition may or may not be worse. When drugs are
substituted for such procedures, the alternative risks must be weighed.
Previous research (Skinner, a) has discussed specific examples where
In Skinner (a), I included an explanation of the concept of “weighted risk
and benefit” under the discussion of net risk. I have separated the idea to make the
distinction more prominent here.
148 Canadian Health Policy Failures
Fraser Institute | www.fraserinstitute.org
drug therapy is used as an alternative to a number of invasive surgical pro-
cedures. In weighing the risk of a particular drug, we must also consider
that the risk of a surgical alternative might be higher. e risk of using the
new drug must also be weighed against the risk of not using it and leaving
the underlying disease condition untreated—often the default alternative.
In other words, what is the alternative when a new drug is withdrawn? In
many cases, withdrawing a drug may leave no alternatives and this might
carry its own risks.
Universal risk
e risk statistically associated with the use of any drug must also be con-
sidered in the context of the already accepted risk statistically associated
with both the use of medicinal and non-medical products in general. For
instance, the public already accepts the risks associated with many com-
mon over-the-counter (OTC) drugs, which do not require a prescription
and have been on the market for decades. Previous research (Skinner,
a) has reviewed specific cases where the risks of OTC drugs have
been shown to be equal to those of newer prescription drugs that have
been withdrawn from the market because of perceived safety risks. is
suggests that both public and regulatory perceptions of risk are often not
based on objective standards. Similarly, the public is allowed relatively
less regulated access to products that are associated with known signifi-
cant health risks (e.g., tobacco, alcohol) yet offer no counterbalancing
health benefits. One might ask how we can justify a higher standard for
safety expectations on drugs, especially if those standards prevent or sig-
nificantly delay access to new medicines with both measurable risks and
benefits? Assessing whether the risk associated with drugs is acceptable
should depend at least partially on a comparison of the risk accepted from
less-regulated consumption goods. We are constantly exposed to risk in
our daily lives even through the most mundane activities and we actually
accept significant risk regularly. In many instances, the risks associated
with these activities are significant and yet we do not see governments
banning or regulating these activities in the same way that they apply to
prescription drugs that affect much smaller percentages of the population.
Chapter 9: Economically liberal solutions 149
www.fraserinstitute.org | Fraser Institute
Identifiable risk
When a risk is found to be statistically associated with the use of a drug,
it is still incumbent on researchers to ask whether there are particular
patient characteristics that are statistically associated with the risk so that
a warning can be added to the product monograph. If the patient group
at a higher risk from a specific drug can be detected, a drug can still be
approved for those who face lower risks and the potential loss of health
benefits reduced. If the risk characteristics of patients that are associated
with adverse reactions linked to the use of a drug can be identified, then
a drug can still be safely released to the market with warnings and labels
to reduce the risk to particular patients without giving up the potential
health benefits for everyone else.
www.fraserinstitute.org | Fraser Institute
Chapter
Why nothing changes:
Ideology and information
Information asymmetry
Policy makers are not usually policy experts and consequently face an
information deficit with regard to the performance of current health
policy, the causes of health policy problems, and the feasibility of policy
options. In order to reduce this information deficit, policy makers rely
heavily on the advice of experts in the research community. is advice
is communicated either through direct consultation with policy experts
or through intermediaries in the bureaucracy. In economic terminology,
there is an “information asymmetry” between policy makers and research-
ers—that is, researchers usually know more about policy than the decision
makers know. Lindblom () observed that policy makers are usually
faced with extremely complex public policy problems but almost always
lack adequate information about these problems and potential solutions.
Lindblom also argued that when good information was potentially avail-
able, it was also very expensive to obtain. Lindblom () also recognized
that there are limits to the human capacity for reason even when adequate
information is present. He further observed that it was very difficult for
policy makers to agree on values and goals. Finally, Lindblom identified
the incentives for organizations to resist information that may adversely
affect the interests of the organization or its members. is could lead

152 Canadian Health Policy Failures
Fraser Institute | www.fraserinstitute.org
policy makers to ignore certain policy options or to reject problem defini-
tions that might lead to certain policy options, even when it would serve
the general public interest. erefore, according to Lindblom (), it
would be more accurate to see the policy process not as rational deci-
sion making, but more like “muddling through.” Information asymmetry
also affects the media and public opinion regarding health policy issues.
e media depend on the research community to help them define what
should constitute a public policy problem, to gauge whether problems
are important enough to deserve space on the current media agenda, and
to provide authoritative shortcuts to assessing the value and credibility
of proposals for reform. e public in turn relies on the media to draw
attention to significant health policy issues, explain the causes of prob-
lems and the range of feasible alternatives, and to facilitate accountability
by identifying the political actors associated with various policy options.
e probability that information asymmetry will cause policy fail-
ure increases when the quality of information supplied by the research
community could conceivably be distorted by ideological (also referred
to as “normative”) biases that develop status quo positions in the disci-
pline, thereby reducing the flow of alternative information and opinion.
Ideological bias could create incentives for the research community to
discount, dismiss, or ignore empirical evidence that suggests Canadian
health policy is failing, or that liberal policies could improve outcomes
in the public interest. Ideological bias could also create incentives for
the research community to defend their investments in past policy rec-
ommendations that produced the status quo in order to avoid admit-
ting error that might undermine the logic of broader ideological values.
Finally, ideological bias might tend to encourage “mission creep”—that
is, redefining and expanding the minimalist social goals that served as
the original justification for state intervention in the health care sector
in order to achieve broader ideological goals.72 is chapter argues that a
fairly obvious social-democratic ideological value bias is reflected in the
Canadian health policy research literature. ere is comparatively little
e earliest published reference to the term and concept that I could find is
Einhorn, Jessica ().

Chapter 10: Why nothing changes: Ideology and information 153
www.fraserinstitute.org | Fraser Institute
Canadian health policy research that reflects an identifiable liberal ideo-
logical value bias. In general, it is observed that Canadian health policy
research tends to categorically reject economically liberal health policies.
One explanation for this is that such policies are inconsistent with the
dominant ideological bias in the research community. 73
Researchers have noted the importance of ideological values as a
determinant of Canadian health policy. Burke and Stevenson (), for
instance, have argued that there is a ideological context for understand-
ing Canadian health care policy outcomes. ey argue that the issue of
reform has always been highly charged with political-ideological struggle.
However, a review of the Canadian health policy literature suggests that
when the impact of ideological values on health policy reform has been
studied, researchers tend to focus on liberal ideological values as a barrier
to the expansion of the state in health care (e.g., Tuohy, ; Buchanan,
; Armstrong, ; Burke and Stevenson, ). Social-democratic
ideological values are not typically discussed as a barrier to health pol-
icy liberalization. Bhatia and Coleman () have found that relatively
little research has been done on the link between ideas and resistance to
reforms that challenge the dominant health policy discourse. ey have
noted that the dominant policy rhetoric in Canada supports an increased
role for the state in health care and this ideological perspective has been
surprisingly resilient in the context of significant pressures on provincial
health insurance systems. According to Bhatia and Coleman, “from the
birth of Canadian Medicare in the s through the late s, a rhe-
torical discourse dominated Canadian health policy. It focused almost
exclusively on the merit of the normative principles of publicly funded,
universal and accessible medical and hospital care, and on how to protect
and enforce this system better. Beginning in the s and climaxing in
the mid-s, a challenging discourse framed around the idea of greater
Pauly () has hinted at a similar explanation for resistance to liberal reforms
of the British National Health Service.

154 Canadian Health Policy Failures
Fraser Institute | www.fraserinstitute.org
private financing gained prominence and currency, but failed to take hold”
(Bhatia and Coleman, : –).74
Social determinants of health
Evidence that ideological values might be an important influence among
Canada’s health policy research community is also apparent from a quali-
tative analysis of the theoretical frameworks and rhetorical language found
in the Canadian literature. For example, one substantial school of thought
within the Canadian health policy research community has been collec-
tively referred to as “sociological perspectives” on health (Coburn, D’Arcy,
and Torrance, ). e literature on sociological perspectives of health
policy is characterized by two main themes of study. e first of these
themes is concerned with the dominant concepts that define health and
health care. is theme identifies a conflict between traditional views of
health care and the sociological view. e traditional view is represented
by the medical model of western health systems, which is individualis-
tic in its emphasis on the treatment of illness as well as the reduction of
negative externalities caused by epidemic threats to the public health. By
contrast, the sociological perspective is collectivistic and emphasizes the
improvement of population health as a statistical aggregate. e socio-
logical perspective stresses the importance of what is termed the “social
determinants” of health. ese social determinants include variables such
as income, employment, education, housing, and nutrition, as well as
access to health care services as major factors statistically correlated with
population health outcomes. It is also influenced by a dominant concept
of health and health care which views the goals of health policy in broadly
egalitarian socioeconomic terms. Researchers from the sociological per-
spective on health care tend to advocate that governments should ensure
not just that health insurance coverage is equally available to everyone, but
Herzlinger () has also identified ideological values as an explanation for
resistance to economically liberal health policy reform in the American research com-
munity. See chapter six in Herzlinger ().

Chapter 10: Why nothing changes: Ideology and information 155
www.fraserinstitute.org | Fraser Institute
also that personal health outcomes are equal for everyone too. e ratio-
nale for this view is based on research suggesting a statistical correlation
between differences in various indicators of wealth and population health
outcomes (Mhatre and Deber, ). Such analyses imply that massive
increases in state involvement in the economy to redistribute wealth are
justified on the grounds of achieving “equitable access to health,” not just
equal access to health care (Mhatre and Deber, : )—a policy goal
laden with socially egalitarian, ideological norms that are inconsistent
with the socially minimalist rationale originally offered for state involve-
ment in medical insurance and medical services.75
e view that Medicare was originally intended to be based on socially
minimalist goals has been confirmed by Quebec’s Clair Commission
report, which noted that “the notion underlying our health and social ser-
vices system is that there should be public insurance to protect against the
serious risks related to illness, that is, mainly ‘curing’ and ‘caring.’ When
the system was first established, the aim was to provide every person
with access to hospital services, and later to medical services, regardless
of ability to pay. is is why the two primary pillars of the current sys-
tem were called ‘hospital insurance’ and ‘health insurance’” (Clair, :
). Despite the socially minimalist rationale originally used to justify
Canada’s current health policy structure in its beginning, the dominant
focus of the Canadian health policy research community has evolved
toward policies that promote socioeconomic egalitarian outcomes. is
evolution has been facilitated by the introduction of a new socioeconomic
political discourse focused on redefining the predominant concepts of
health and health care. is discourse argues that the goal of health pol-
icy is to improve aggregate “population health.” Population health views
of “health” are opposed to the traditional medical model of health care.
e population health school of thought sees the determinants of health
It could also be argued that conclusions drawn from such analyses suffer from
the logical error of assuming causality between two variables that just happen to be
statistically correlated by coincidence. e analyses also imply (however implausibly)
that it is possible for the state to equalize health outcomes among all people at the
level of the healthiest people in society.
156 Canadian Health Policy Failures
Fraser Institute | www.fraserinstitute.org
in broad socioeconomic and environmental terms and proscribes a col-
lective response to prevention as a solution. e population health view
implies that individuals have a “positive” right to a publicly guaranteed
health status. e traditional view sees health as the absence of illness and
employs medical science to treat and cure illness if and when it arises. e
traditional medical model assumes that health is an individual responsibil-
ity and does not prescribe state intervention except to prevent negative
externalities like contagious epidemic disease.
Class-based analyses
Another less common but parallel perspective in the Canadian health
policy literature is neo-Marxist class theory. is approach attempts to
explain health policy outcomes in terms of the interests of a “dominant
capitalist class” in the policy-making process. According to this view, the
dominant capitalist class actively and consciously instituted a publicly
financed health insurance program, but left the medical profession in a
dominant and semiautonomous position within the system in order to
offload to the public the costs of providing a healthy pool of labor for
industry. is was done to forestall the outright nationalization and social-
ization of the health industry altogether.
Torrance (), for instance, offers an analytical framework that is a
mix of the medical dominance approach and Marxist class-based analysis.
Torrance offers a sociological and historical review of the development of
the Canadian health system. He employs a comparative analysis of the evo-
lution of Canadian health policy relative to other western countries over
the same time period. Overall, the analysis is approached from a class-
based perspective. Changes in Canadian health policy are seen to be the
result of the conflict among competing social classes. However, doctors in
particular are seen to have been a crucial obstacle to the creation of a fully
socialized medical system in Canada. According to Torrance, the result
was the preservation of the medical model with the maintenance of the
monopoly position of doctors as professional elite in health policy-making
and the management of the system. is, in turn, led to the public finance/

Chapter 10: Why nothing changes: Ideology and information 157
www.fraserinstitute.org | Fraser Institute
private operation model of health care, or government health insurance
instead of government health care.
Some works cited in the Canadian health policy literature explicitly
view policy outcomes and process in terms of societal class interest and
apply neo-Marxist analytical frameworks. In State, Capital, and Labour:
e Introduction of Federal-Provincial Insurance for Physician Care in
Canada, Walters () examines the origins of public insurance for phy-
sician care in Canada. Walters’s perspective remains explicitly Marxist in
orientation in that events that occurred throughout the development of
Canadian health policy are characterized in terms of class conflict and
other socialist theoretical concepts like the surplus value of labor and
the state as an agent of capitalism. Walters argues that the capitalist class
was in control of the state at the introduction of Medicare in Canada.
erefore, according to Walters, by nationalizing health insurance, the
state was acting in the long-term interests of the capitalist class by shifting
the economic costs of illness borne by business76 onto the public purse,
while at the same time increasing the productive capacity of labor.
Swartz () also employs a class-based analytical framework toward
the study of Canadian health care policy. Swartz argues that Canada’s
public health system resulted from a “protracted industrial and political
struggle by the labour class.” According to Swartz, governments acqui-
esced to demands from the labor class for public health insurance due to
their fear that a refusal would engender labor hostility and increase the
potential for the success of socialist political parties and ideas. However,
according to Swartz, instead of introducing a socialized system of medi-
cine that would have meant the nationalization of hospitals and clinics
and the salaried employment of physicians, the governments opted for
a system limited to public health insurance only. is meant that health
insurance was brought in without changing the privileged position of
e costs of health insurance are not ultimately borne by business, but by employ-
ees in the form of opportunity costs because their potential cash wages are supplanted
by health insurance benefits. Consumers also ultimately bear all business costs, which
are eventually transferred into the prices of goods and services.

158 Canadian Health Policy Failures
Fraser Institute | www.fraserinstitute.org
physicians as a professional group or abolishing the private ownership
and operation of hospitals.
Navarro () is also explicitly identified with Marxist approaches to
the analysis of health policy and widely cited in the Canadian literature.
Navarro attributes the absence of a national government-run universal
health insurance program in the United States to a weak and fragmented
labor movement and the lack of a national social-democratic political
party. Navarro argues that there is a link between states with strong labor
movements and powerful socialist political parties and the development
of public health insurance schemes. According to his view, “corporatist”
health schemes like those of the US are the result of alliances between “feu-
dal elites and the capitalist classes and seek to divide the loyalty of labour
by imposing employment based health benefit schemes.”77 erefore, the
collective will for a nationalized system of health care is undermined and
Navarro believes that the working classes end up settling for less than an
ideal system.
Another view that seems to borrow from the Marxist perspective is
provided by Renaud (). Renaud attempts to explain why the social-
democratic philosophy that was used as the rationale for the increase
in state authority over health care in Quebec was not fully attained in
policy outcomes. To explain why the results failed to match the ideals
Despite Navarro’s ideologically charged, historically constructionist explanation
for the structure of US health insurance, the simplest explanation is that it is just an
accident of history. During the Second World War, the US government imposed wage
and price controls on the national economy. Employers faced shortages of labor due to
conscription, but the shortages could not be addressed by raising wages due to federal
regulations. Employers discovered that they could substitute health insurance benefits
for cash income without violating the wage control laws. ese benefits were attractive
because they were not taxed like cash income. is made the actual economic value of
the insurance benefits higher than if the cost of insurance was simply paid out as cash
income. e tax advantages remained in place after the war because proposals to tax
these benefits like income were highly unpopular. is has created a distortional effect
on insurance coverage. Self-employed Americans must pay for insurance with after-
tax income, making the effective price much higher for them. is might explain why
self-employed Americans make up such a large percentage of the uninsured popula-
tion in the US despite having high average incomes.

Chapter 10: Why nothing changes: Ideology and information 159
www.fraserinstitute.org | Fraser Institute
of reform, Renaud explains the actual outcomes as resulting from class
conflict between the “new technocrats” and the “professional monopolists”
(health professionals). According to Renaud, this conflict “prevented the
imposition of a full social vision for health care and instead left an ele-
ment of private practice in place.” Additionally, Renaud believes that in a
capitalist society the state itself serves to prevent revolutionary changes.
erefore, the Quebec state prevented the complete nationalization of the
health sector because it represented the interests of the dominant class
and their resistance to socialized medicine.
Ideologically charged rhetoric
Canadian health policy experts frequently criticize the private sector in
ideological terms and use ideological rationales for advocating govern-
ment control of the health care sector.78 For example, some have argued
that the profit motive is an ethically negative force in health care (e.g.,
Evans, a, a, b), that profits earned in the health care sec-
tor are “excessive” (e.g., Evans, , a, b; Morgan, ),79 and
that government intervention in health care is preferred on the basis of
redistributive rationales (e.g., Maynard, ; Evans, , a, ,
a, b, a, b; Mhatre and Deber, ).80 Nationalistic
In one published exchange, Pauly (: ) and Gaynor and Vogt (: ,
) explicitly alleged that anti-liberal ideological bias is a motivating influence in
the work of prominent Canadian health economist Evans (a, b). Blomqvist
(: , note ) has observed that “Evans and his coworkers have had a profound
influence on health policy in Canada over the years.”
ese analyses do not acknowledge that the salaries and wages paid to health pro-
fessionals, health policy experts, or health ministry employees are also “profits” from
the sale of labor services; they do not define how much profit is “too much” profit;
and they fail to explain how to incentivize the innovation and production of medi-
cal goods and services without a profit motive, the alternatives to which are altruism
(unrealistic) and force (unjust).
Wealth redistribution is not supposed to be the purpose of a health insurance
program. Wealth disparity can be solved more efficiently and more honestly by simply

160 Canadian Health Policy Failures
Fraser Institute | www.fraserinstitute.org
rhetoric has also been frequently used to oppose health policy liberal-
ization. Advocates of economically liberal policies are often accused of
wanting to “Americanize” health care (e.g., Evans, a)81 or the status
quo is advocated on the basis of nationalistic symbolism associated with
Canada’s particular approach to health policy (e.g., Marmor et al., ).
A ideologically charged negative view of the patented prescription drug
industry in particular is frequently expressed by health policy experts in
Canada (e.g., Lexchin, , , a, b). In some cases, Canadian
health policy experts have used quite extreme ideological language (e.g.,
Evans, , ; Cassels, ; Maynard, ).82
transferring income directly between individuals.
Fears of Americanization are not empirically based. e few researchers in Canada
that advocate market-based policy alternatives tend to point to policy trends observed
in other countries (mostly European) that have similar social goals to Canada regard-
ing universal health insurance, but also increasingly rely on more liberal policies to
achieve those goals. e direction of reform in most of these countries is toward liber-
alization and away from state-based central-planning approaches. e problems with
US health care also have much to do with government intervention. For example, the
US tax code distorts the health insurance market by giving tax preference to health
insurance paid for by employers. is means that when people change jobs in the US
they often temporarily lose health insurance benefits. e self-employed also pay an
effectively higher price for insurance because they must buy it from after-tax income.
is discourages them from buying it. ese two groups of people explain a large per-
centage of the population without health insurance in the US (Mays and Brenner, ;
BCBS, ). US federal and state governments also heavily regulate health insurance
markets, and nearly half of all health spending in the US is publicly funded. In fact, the
most recent internationally comparable data show that in the United States govern-
ment’s spending on health care was the same percentage of GDP (.%) in as
government spending on health care was in Canada (.%) (OECD, ).
Examples of ideologically charged rhetoric directed at the patented drug industry
include the following published statements: “Would Astra-Zeneca, if they thought it
would work, hire someone to go out and smash Anne Holbrook’s kneecaps? Probably
not, but not because it would be wrong, but rather because it would be unprofitable. It
will not be profitable because it is unlawful and all kinds of bad things could happen.
But should we as a research community not now regard and treat the people who work
for Bristol-Myers Squibb or the people who work for Astra-Zeneca as if they were
members of the Mafia, as if they were people who hire thugs to intimidate members

Chapter 10: Why nothing changes: Ideology and information 161
www.fraserinstitute.org | Fraser Institute
of our community in their own interests? To date, we do not and have not. But why
not? Is it because they simply have too many resources at their disposal?” (Evans, :
). “In other words, individuals who choose to work for organizations that hire thugs
to go out and kneecap people, or that hire firms such as Smart & Biggar to go out and
do the kneecapping financially and legally, must be ostracized in ways that make it
increasingly difficult for the corporations behind them to find willing footsoldiers for
their sordid agendas. We must label those folks and treat them as what they are, which
is a brand of white-collar mafia. But that is very rude language; that probably makes
people wiggle uncomfortably. ese are, after all, folks that look like us, that are clean
and well-dressed and support research (indeed, some even do research) and make all
the right noises. ese are not people who look like Edward G. Robinson in the bath
with his cigar. But regardless of what they look like, the tactics amount to thuggery,
and are undertaken because they are profitable and for no other reason” (Evans, :,
). “Of course, companies are made up of people and most of the people who work
in companies, including drug companies, are in fact moral beings. People do things
and believe in what they do, and the people who work with drug companies probably
believe that they’re doing something important, too. And, of course, to some extent
they are. ere’s no question about the benefits that we derive from drugs. So what you
have is an amoral, profit-driven organization absorbing more or less moral people who
have to spend time shutting their eyes” (Evans, : ). “Large companies, fiercely
fighting for customers, are constantly seeking to expand the definition of depression
and so increase the numbers who need treatment. In such a milieu, tragic events like
September, are seen as marketing opportunities, as excuses to flog more treat-
ments for ‘post traumatic stress disorder’” (Cassels, : ). “Government action
to redistribute and protect the disadvantaged has political and social benefits. A nice
present day example of this is China. Since the adoption of the ‘capitalist path’ in
China, economic growth has created large inequalities in the distribution of income
and wealth, particularly between urban and rural areas. Furthermore, the Maoist sys-
tem of public health with efficient monitoring of disease and the provision of basic
programmes of prevention and care ensured both the control of infectious diseases
and a reduction in relative and absolute mortality rates. Come economic liberalisa-
tion since in China, come the collapse of this system and the development of
major public health challenges (e.g., SARS, HIV-AIDS, and TB) and inequalities in
health care provision that challenge the survival of the Communist Party. is chal-
lenge is now being met by redistributive policies to restore rural health care, improve
public health surveillance and control and mitigate the political consequence of gross
inequality” (Maynard, : ).
162 Canadian Health Policy Failures
Fraser Institute | www.fraserinstitute.org
Balance of information commissioned by governments
Canadian policy makers might also be affected by an imbalance of infor-
mation when governments have surveyed expert opinion. e information
that has comprised the basis for government-commissioned health policy
reports has tended to heavily favor the status quo or advocate greater state
intervention in health care. At the same time, expert opinion surveyed
in official reports has also tended to ignore or oppose economically lib-
eral problem definitions or policy reforms. e bulk of expert opinion
regarding health policy is also expressed using overtly ideological politi-
cal language. In order to demonstrate this proposition, a comprehensive,
detailed review of the research base and expert opinion that has informed
two recent federal government-commissioned health policy studies was
conducted. Studying the content of health policy reports at the federal
level is important because the Canada Health Act remains a significant
federally imposed institutional barrier to liberal health policy reform in
the provinces.
e influence of social-democratic ideological values on government-
commissioned health policy reports is evident from the beginnings of
Medicare. Vaughan () has argued that Justice Emmett Hall, who
chaired the federal Royal Commission on Health and the fed-
erally commissioned Health Services Review, was heavily influenced by
social-democratic ideological values. e Hall Commission recom-
mended federal-provincial cost sharing to encourage the nationwide adop-
tion of publicly administered and funded universal health insurance pro-
grams covering hospital and physician services, which was fully achieved
in all provinces by . According to Health Canada (), the
commission “held days of public hearings in all provinces and in Yukon,
visited and studied health care systems in several other countries, received
submissions, heard individuals and delegates from organizations, and
commissioned research studies.” Taylor (: ) mentions more
specifically that of the more than submissions received by the
commission, there were “thirty-five briefs submitted by the CMA and each
of its divisions, by all the prepayment plans, and by spokesmen for the
insurance industry and the chambers of commerce.” Taylor also indicates

Chapter 10: Why nothing changes: Ideology and information 163
www.fraserinstitute.org | Fraser Institute
that almost all of the recommendations of the CMA, prepayment plans,
insurance industry, and chambers of commerce were rejected by the Hall
Commission in its final report. e background reports to the and
Hall Commissions were not examined for this analysis. However, the
policy outcomes suggest that liberal economic views (based on Taylor’s
account of the substance of the policy positions of the aforementioned
groups) were not as numerous, and not as persuasive to the Hall
Commission, as the remainder of the submissions. is observation is
probably also true regarding the base of expert opinion surveyed by the
Hall Commission which produced recommendations that were later
legislated in the Canada Health Act ().
e two more recent federal commissions examined in this paper
are the National Forum on Health () and the Commission on the
Future of Health Care in Canada (), commonly referred to as the
“Romanow Commission” after the name of its chair, former Saskatchewan
NDP premier Roy Romanow. According to the report of the National
Forum on Health, “in October , the Prime Minister of Canada, e
Right Honourable Jean Chretien, launched the National Forum on Health
to involve Canadians and advise the federal government on innovative
ways to improve the health system and the health of Canada’s people.
e Forum was set up as an advisory body with the Prime Minister as
Chair, the federal Minister of Health as Vice Chair, and volunteer mem-
bers who contributed a wide range of knowledge founded on involve-
ment in the health system as professionals, consumers and volunteers”
(National Forum on Health, : vii). e forum produced a five-vol-
ume report comprised of 83 background papers solicited from “the
most eminent specialists in the field” by the forum’s membership panel
(National Forum on Health, : vii). According to the final report of the
Romanow Commission, “in April , the Prime Minister established the
Commission on the Future of Health Care in Canada … [its] mandate was
to review medicare, engage Canadians in a national dialogue on its future,
On page vii in the foreword to the National Forum on Health volumes, the report
states “e Forum based its recommendations on research papers written by the
most eminent specialists in the field.” However, I counted studies in the five volumes.
164 Canadian Health Policy Failures
Fraser Institute | www.fraserinstitute.org
and make recommendations to enhance the system’s quality and sustain-
ability” (Romanow, : xv). e commission “organized expert round-
table sessions”; “commissioned independent experts to conduct original
research”; and “met directly with Canada’s foremost health policy experts”
(Romanow, : xv). e Commission’s final report was a synthesis of a
series of cross-country public consultations and background papers
submitted by selected experts.
Skinner () conducted a content analysis in order to summarize,
describe, and categorize each of the background papers submitted by the
experts selected by the two commissions. e results showed that none
of the background papers solicited by the National Forum on Health
emphasized private-sector, economically liberal reforms in its principles
or recommendations. In most cases, the recommended policy approaches
advocated a greater role for the state in the health care sector and the
further curtailment of any existing role for the private sector or for eco-
nomically liberal policies. e qualitative content of the language used
in these papers was frequently ideological. An analysis of the Romanow
Commission background papers returned similar findings. Only one of
these papers explicitly recommended economically liberal approaches
to health policy reform. e language and analytical focus again tended
to be politically ideological, and implicitly or explicitly opposed to eco-
nomically liberal health policy reforms. Overall, out of a total of expert
reports accepted by the these two commissions, emphasized, assumed,
or preferred state-based approaches to health policy; one emphasized,
assumed, or preferred economically liberal approaches to health policy;
and were either neutral, not addressing policy options, or did not indi-
cate a preference for either state-based or economically liberal approaches
to health policy.
e policy themes reflected in the reports submitted to these two
recent federal commissions are mirrored in the background research
informing several provincial health commissions, and this in turn has been
reflected in recommendations produced at the provincial level. Mhatre
and Deber () published a detailed study of provincial health commis-
sion reports issued during the period – in Alberta, Saskatchewan,
Quebec, New Brunswick, Nova Scotia, and Ontario. ey concluded that
Chapter 10: Why nothing changes: Ideology and information 165
www.fraserinstitute.org | Fraser Institute
there were several “recurring themes” (Mhatre and Deber, : )
including (among other things): () adopting the social determinants of
health framework for policy and “broadening the definition of health”; ()
further efforts at reorganizing central-planning approaches and models
through “establishment of councils, coordinating bodies, and secretari-
ats”; () efforts to make central rationing decisions more efficient through
“technology assessment”; and () moving physicians from fee-for-service
(a characteristic of professional autonomy) to salary or capitation arrange-
ments (more closely analogous to direct employment in civil service) with
“emphasis on alternative methods for remuneration of physicians” (Mhatre
and Deber, : ).
Ideological values probably contribute to creating an information defi-
cit for health policy-makers in Canada. e practical effect of this infor-
mation deficit is to discourage health policy liberalization in Canada. A
review of the literature suggests that social-democratic ideological val-
ues have a significant influence on health policy research in Canada. e
Canadian health policy research community has displayed a tendency to
ignore or dismiss empirical evidence that suggests Canadian health policy
is failing in any significant way. e research community also tends to
restrict its discussion of feasible policy alternatives to a range of options
that entirely excludes economically liberal approaches—even incremental
or moderate reforms of this type. As evidence of current policy failures
has mounted, the tendency has been to redefine the rationale that sets
the boundaries for state involvement in health care in Canada. Minimalist
social goals that once served as the original rationale for state intervention
in the health care sector have evolved to include social equity, which then
justifies greater state control. e result is that Canadian health policy
shows signs of what organizational theorists might call “mission creep.”
As Mhatre and Deber (: –) observed, “formerly, the objective
of Canada’s health care system was equality of access to medical care. is
objective has largely been achieved. However, class disparities in health
remain, although these have been substantially reduced from the pre-
Medicare period. e policy success has forced Canadian policymakers to
recognize the limits of medical care in achieving health. Consequently, a
‘new’ policy goal has been proposed: achieving equity of access to health.”

www.fraserinstitute.org | Fraser Institute
Chapter
Why nothing changes:
Interest group incentives
Rational choice theory
is chapter applies a rational choice (aka “public choice” or “political
economy”) theoretical framework to understand health and prescription
drug policy outcomes in Canada. Rational choice theory starts with the
assumption that people are motivated as much by their own self-interest
in political actions as they are in economic decisions.84 Or as Becker (:
) has put it, “the economic approach to political behaviour assumes
that actual political choices are determined by the efforts of individuals
and groups to further their own interests.” e theory proposes that poli-
tics and public policy outcomes can best be understood and explained
by analyzing the particular set of incentives faced by political actors in
much the same way as the science of economics attempts to explain and
predict the behavior of firms and consumers in a market (Tullock et al.,
). is chapter applies the assumptions of rational choice theory to
analyze the influence of special interest groups on the health policy pro-
cess in Canada. More specifically, this study applies the rational choice
For an explanation of the fundamentals of the theory of rational choice (aka pub-
lic choice), its history and development, see Mueller ().

168 Canadian Health Policy Failures
Fraser Institute | www.fraserinstitute.org
theoretical concept of “rent seeking” to offer a potential explanation for
resistance to health policy liberalization in Canada.
Democratic governments are routinely lobbied by special interests
attempting to influence the outcomes of public policy. Most observ-
ers would see this as a normal and healthy part of democratic politics.
However, when special interests seek to use the legislative and regula-
tory power of the state to benefit themselves at the expense of, or to the
exclusion of, others, the results are often economically less efficient. e
self-serving influence of special interests is also often deemed to be ethi-
cally illegitimate. Rational choice theory labels such undesirable political
behavior “rent seeking.” In the simplest terms, rent seeking is the pursuit
of state-imposed wealth transfers or other political favoritism by special
interest groups. Rational choice theory uses the concept of rent seeking to
explain why public policy outcomes in liberal-democratic societies often
contradict classical liberal political and economic ideals regarding fairness
(equal treatment of individuals under the law), economic rights (respect
for private property rights, voluntary transactions, and free markets), and
socioeconomic rationality (maximizing net benefits for the general wel-
fare of the population over the long run). Examples of rent-seeking accom-
modations include policies that publicly redistribute privately held wealth
or property, policies that establish special privileges that are denied to the
rest of the population, or policies that create artificial advantages or bar-
riers against competing economic interests. Rent seeking is the rational
choice concept describing the political behavior of interest groups who
pursue state policy favoritism.85
In economic terms, “rent” is defined simply as profit. However, when used in
the context of rational choice theory, rent has by implication come to mean not sim-
ply profit, but more accurately “unearned profit.” Tollison () originally defined
rent seeking simply as “the socially costly pursuit of wealth transfers.” Tullock ()
argued that expenditures made to capture a wealth transfer also carried a social cost.
e social cost occurs because the resources used to pursue transfers have a pos-
itive opportunity cost somewhere else in the economy. at is, the money, effort,
time, or other resources could have been used in pursuit of more profitable activities.
erefore, the opportunity cost of rent seeking results in net losses to wealth if calcu-
lated on a society-wide basis. Using economic resources to lobby for tariff protection

Chapter 11: Why nothing changes: Interest group incentives 169
www.fraserinstitute.org | Fraser Institute
It is important to note that there are political factors that facilitate
rent-seeking behavior among special interests. One factor is the incentives
facing political decision makers. According to rational choice theory, it is
simply more expedient for election-oriented politicians to accommodate
special interests instead of implementing public policies that improve
general welfare. is is because organized special interest groups are more
successful at attracting members if they offer some benefit that is unavail-
able to non-members. us, interest groups have an incentive to seek
wealth transfers and other special privileges from governments. Since
interest group members personally benefit from, and are better informed
about, the impact of a public policy on their particular interest, they have
a greater incentive to vote (Riker, ; Olson, ). Politicians are aware
of this and have a short-term electoral incentive to offer public transfers
and special privileges in exchange for interest group efforts to mobilize
against competition from imports is an example of rent-seeking behavior. According
to Tullock’s definition, rent seeking is undesirable only if it results in net social costs.
However, Tullock’s definition is perhaps too limited in the context of the traditional
liberal political values that inform rational choice theory. Classifying special interest
political behavior as rent seeking does not require evidence of net social economic
costs from such transactions. Rational choice grew out of the academic discipline and
traditions of liberal economics. It is built on an ideological framework which holds
that the ideal function of democratic government is to make choices on behalf of the
public interest, and to select polices that improve the general welfare of society while
protecting individual rights (Buchanan and Tullock, ). e ideological frame-
work of rational choice is therefore identifiable as classical liberalism (Dunleavy, ).
e phrase “wealth transfers” implies the use of force (by the state through legisla-
tion, regulation, taxation, etc.) and is conceptually distinct from voluntary exchange,
which is the ideological ideal for liberal conceptions of markets. erefore, by defini-
tion, wealth transfers are achieved by state restrictions on or violations of voluntary
exchange. Rational choice is therefore best described as a theory which uses the con-
cepts of economics to explain why public policy often diverges from liberal-democratic
ideological ideals for governance. By implication, rational choice theory considers
rent-seeking undesirable not just because it is economically costly, but also because
it is morally illegitimate—or has a justice cost. However, in the analysis presented in
this paper, rent seeking is defined simply as the self-interested pursuit of government-
enforced transfers of wealth, grants of special privileges, or the unequal imposition of
advantages and disadvantages.
170 Canadian Health Policy Failures
Fraser Institute | www.fraserinstitute.org
the support of their members. Similarly, organizations with small mem-
berships, but which represent wealthy special interests (like trade asso-
ciations), can offer financial support to political parties and candidates in
exchange for favorable policy treatment. Information asymmetry can also
increase the influence of special interests on the policy process. Tullock
(), for instance, has argued that there is often information asymme-
try between the general public and relatively more knowledgeable policy
makers and this makes it easy for politicians to ignore the public interest.
At the same time, special interest groups develop an expertise in health
policy areas that affect them, and as a group they are not as vulnerable to
the same information asymmetry as the general public. As a result, the
knowledge balance often favors special interests in their relations with
policy makers. According to Tullock, this increases the incentives for pol-
icy makers to pay attention to the demands of special interest groups, and
hence raises the influence of these groups in the policy process.
Finally, it is important to acknowledge that state policy favoritism
toward rent-seeking interests is not always obvious. Regulations that nom-
inally seem to restrict the economic freedom of some interest groups may
actually work to their economic advantage. Stigler () has observed
that regulation often, counterintuitively, serves the rent-seeking interests
of the regulated and that such groups have incentives to demand that they
be regulated. Regulations that are advocated on the basis of public interest
concerns can create arbitrary advantages for special economic interests
and raise the cost of competition for their economic rivals. According to
Stigler, a widely held view “is that regulation is instituted primarily for
the protection and benefit of the public at large or some large subclass of
the public” (Stigler, : ). However, “regulation may be actively sought
by an industry … as a rule, regulation is acquired by the industry and is
designed and operated primarily for its benefit” (Stigler, : ). e
case study presented below borrows from the analytical approach used by
Stigler () to demonstrate his “theory of economic regulation.” Stigler’s
approach was to “assume that political systems are rationally devised and
rationally employed, which is to say that they are appropriate instruments
for the fulfillment of desires of members of the society. is is not to say
that the state will serve any person’s concept of the public interest: indeed
Chapter 11: Why nothing changes: Interest group incentives 171
www.fraserinstitute.org | Fraser Institute
the problem of regulation is the problem of discovering when and why an
industry (or other group of like-minded people) is able to use the state for
its purposes, or is singled out by the state to be used for alien purposes”
(Stigler, : ).
e following sections discuss how various special interests might ben-
efit economically from government intervention in health care markets
in Canada. e special interests identified below therefore have poten-
tially significant economic incentives to resist economically liberal health
policy reforms.
Patented versus generic drug interests
ere are a variety of federal and provincial public policies that have been
previously identified as contributing to inflated prices for generic drugs
in Canada (Skinner, a, a; Skinner and Rovere, d; Skinner
and Rovere, d). e aggregate impact of these public policies has
been to inhibit the downward pressure on the retail prices of generic
drug products that would occur under competitive market conditions.
e most recent analysis estimates that inflated generic prices in Canada
directly cost the Canadian market $. billion annually ( estimate) in
unnecessary spending on generic drugs (Skinner and Rovere, d), or
about % of total retail expenditures of $. billion in on all pre-
scription drugs (IMS Health Canada Inc., ). Research (Skinner, )
strongly suggests that various prescription drug policies in Canada have
worked to uniquely advantage or benefit the domestic Canadian generic
drug industry, which likely provides incentives for the generic industry to
support government intervention in prescription drug markets.
For instance, previous research (Graham, ; Skinner, a,
a; Skinner and Rovere, d, d) has explained how, paradoxi-
cally, federal price-control rules on patented drugs contribute to high
generic prices in Canada. For drugs that treat the same health condition,
the highest existing price is used by the federal government as a refer-
ence for establishing the maximum allowable price for new patent-pro-
tected drug formulations entering the market. When patents expire on

172 Canadian Health Policy Failures
Fraser Institute | www.fraserinstitute.org
brand-name drugs, generic drugs enter the market to compete for sales
of those products. Yet despite these competitive pressures, manufactur-
ers do not typically reduce the prices of post-patent brand-name drugs.
is is because doing so will lower the maximum allowable entry price
allowed by federal regulations for any new drugs they develop. e price-
control rules therefore act to fix brand-name drug prices at their intro-
ductory patented levels even in the face of competitive market pressures
that would normally encourage price reductions after patents expire. And
because generics are reimbursed at a percentage of the brand-name price,
the prices of generics end up being higher than they would be if the price-
control rules did not discourage the post-patent brand-name price from
moving downward.
For another example, in Canada there are no federal price con-
trols on non-patented drugs. However, there is indirect state interven-
tion in generic drug pricing that occurs, for example, in the listing of
drugs for public reimbursement through the Ontario Drug Benefit (ODB)
Formulary. Until , the rules that the province applied to the formu-
lary required first-entry generic drugs to be priced no higher than % of
the price of the original patented drug, while subsequent generic market
entries were limited to % of the price of the first generic. As of ,
reimbursement of all generics has been reduced to % of the original
patented drug price. While Ontario’s public reimbursement rules seem to
be a form of price control on generic prices, the actual effect of the rules
is to create a higher price ceiling for generics than that which would occur
if competitive market forces were not inhibited from affecting drug prices.
is is because of the interaction of several aspects of public reimburse-
ment approaches. Public drug programs in Canada direct the reimburse-
ment of prescriptions to pharmacies instead of consumers, and most pub-
lic drug plans do not require a proportional coinsurance payment to be
paid by the program’s beneficiaries whenever they purchase a prescription
drug.8 6 is insulates consumers from the cost and removes incentives
Alternatively, public drug plans could be restructured to directly and retroactively
reimburse the program’s beneficiaries, and only at a partial percentage (e.g., %)
of the total cost of their prescription. While some jurisdictions in Canada impose

Chapter 11: Why nothing changes: Interest group incentives 173
www.fraserinstitute.org | Fraser Institute
for comparative shopping that would put downward pressure on prices.
Public drug programs (like the Ontario Drug Benefit plan) also reimburse
generics at a fixed percentage of the patented original drug. Under this
policy, there is no price competition between generic drug makers for
sales to the public drug plan because the buyer (government) offers every
seller the same price and the price is known in advance, so every generic
manufacturer sets their list price to the maximum reimbursement allow-
able. ere are few generic competitors in Canada, and the larger estab-
lished companies exploit this reimbursement system to offer pharmacies
rebates that are bundled across many products in exchange for exclusive
distribution rights. Yet, because pharmacies are reimbursed directly, the
bulk discounts are not passed on to consumers. Finally, any reduction in
the reimbursement rates offered by government payers can be offset by
inflating retail prices charged to private payers (Skinner, a, a;
Skinner and Rovere, d, d; Canada, Competition Bureau, ).
Current and previous legal actions by the provinces of Ontario (Canadian
Press, , April ) and Quebec (Bueckert, , February ) confirm
this analysis.
Medical professionals
It is also useful to consider the incentives that might encourage health pro-
fessionals to oppose economically liberal health policy reforms in Canada.
As discussed in the previous chapter, many analyses in the Canadian health
policy literature hold the view that physicians are resistant to a greater role
for the state in health care because doctors benefit as a group from the sta-
tus quo (e.g., Coburn, ). It is true that physicians collectively opposed
the introduction of single-payer government health insurance in Canada
copayments on beneficiaries of their public drug plans, the copayments are usually not
structured appropriately. In order for a copayment to be effective it must be calculated
as a percentage of the price. Where copayments exist in public drug plans, they are
usually set at capped dollar amounts (e.g., consumers pay the pharmacy dispensing
fee) (Graham and Tabler, ).
174 Canadian Health Policy Failures
Fraser Institute | www.fraserinstitute.org
(Taylor, ). It would therefore seem natural to assume that physicians
would support health policy liberalization in Canada. However, the histor-
ical evidence suggests that physicians have consistently supported the sta-
tus quo both before and after Medicare was introduced. Naylor (), for
instance, examined the major determinants of the Canadian medical pro-
fession’s perspectives, policies, and pressure group activities in the field of
state health insurance between and . According to Naylor (),
before the introduction of state health insurance, physicians welcomed
government involvement, but only on a limited basis. is limited role
for the state involved the institutionalization of professional autonomy as
well as the enforcement of a monopoly (through medial licensing) in the
medical services market for doctors. Naylor () argues that during the
development of Canadian Medicare, medical doctors tended to endorse
policies that maintained these privileges. is resulted in a pattern of
practice where doctors remained self-employed, self-regulated providers
of medical services operating on a fee-for-service basis. erefore, Naylor
() suggests that the main obstacle to the creation of fully government-
run health care, as opposed to government-funded health insurance, was
the resistance of physicians acting as a professional group. Naylor ()
suggests that the professional opposition of physicians was not motivated
only by material self-interest. He attributes the resistance to government
involvement largely to the culture of doctors that valued professional
autonomy. Nonetheless, he argues that support among physicians for pub-
lic health insurance increased as they discovered the material benefits of
the Medicare system. ese benefits involved guaranteed payment, lower
administrative costs, and the entrenchment of the licensing monopoly of
doctors and the medical model of delivering health care.
e historical resistance of physicians to state involvement in health
care followed by support for state involvement is not necessarily a contra-
diction if viewed from the perspective of physician perceptions of relative
benefit under the status quo. Recall that, in chapter one, evidence was pre-
sented suggesting that physician earnings have actually declined since the
early s (in real terms after adjusting for inflation) compared to average
domestic wages (Mullins, ), and in absolute terms compared to US
physician earnings (Skinner and Rovere, a). Yet, it is also true that
Chapter 11: Why nothing changes: Interest group incentives 175
www.fraserinstitute.org | Fraser Institute
physicians have tended to earn above-average incomes relative to referent
groups within and outside the health care system, both before and since
the introduction of Medicare. It is therefore probably most accurate to see
health professionals as being conservative about policy change because,
relative to other income-referent groups, they perceive a relative benefit
from their professional designation and associate this with the status quo
policy regime. e lost potential for increased earnings that could come
from health policy liberalization in Canada are “opportunity costs,” and
therefore are not as obvious to physicians as the measurable differences
between doctors’ incomes and the incomes of other health professionals
or occupations outside the health care system. Policy stability is therefore
highly valued by physicians and this is a likely explanation for their histori-
cal resistance to any policy change, including economically liberal reforms.
Historically, as a professional group, nurses have consistently tended
to support government involvement in health care. As a group, physicians
have probably been proportionally more inclined to support health pol-
icy liberalization than nurses because the self-employed entrepreneurial
structure of physician practice makes it possible to take advantage of the
economic opportunities that a more liberal health policy environment
might provide. By contrast, despite their increasing professionalization,
nursing associations have historically faced economic incentives to act
more like labor unions because the work of nurses is structured on the
basis of dependent employment within large hospitals. Nurses lack the
self-employment autonomy associated with private professional prac-
tice. Not being entrepreneurial by practice model, nurses are probably
not inclined to see health policy liberalization as providing any greater
economic opportunities than the status quo. Nursing associations might
assume that they exercise far more leverage to negotiate with policy
makers in a politicized environment at a centralized provincial level than
would local associations or unions in collective bargaining with individ-
ual hospitals. Despite the fact that nursing wages in the United States
(where nurses do not organize on a state-wide basis) have tended to be
higher than rates paid in Canada, information asymmetry about poten-
tial wage gains under private-sector financing might prevent nurses from
being aware of the opportunity costs they incur under the status quo. As
176 Canadian Health Policy Failures
Fraser Institute | www.fraserinstitute.org
a professional group, nurses have incentives to resist the liberalization of
health policy. Instead of advocating fundamental reforms to the financing
of health care in Canada, nursing leaders have tended to focus on affect-
ing the balance of power within the current policy environment between
physicians and other health professionals, especially regarding the scope
of practice.
Physicians and nurses are also incentivized to be rival interests because,
under the current health policy regime, professional wage rates are cen-
trally determined by provincial policy makers and the allocation of spend-
ing under provincial health budgets is perceived as a zero-sum game. at
is, if policy makers decide to increase the earnings of physicians, there is
necessarily less left over to accommodate wage increases for nurses and
vice versa. Under the current policy regime, any observed competition for
policy-making power between physicians and nurses could be interpreted
as a professionally self-interested struggle for scarce resources in a zero-
sum game. Similarly, the interests of physicians and pharmacists are also
incentivized to be competitive within the prescription drug policy com-
munity. Physicians have exclusive legal authority to prescribe controlled
medications. is gives them the unique power to act as gatekeepers for
consumer access to drugs. Pharmacists have recently begun mobilizing
significant political efforts to encourage governments to grant them some
limited prescribing authority. e province of Alberta has recently enacted
such a policy and other jurisdictions already allow pharmacists to override
a physician’s prescription to substitute not only generic versions of a pre-
scribed patented drug, but also generic versions of drugs deemed by the
state to be therapeutic substitutes for a prescribed patented drug. ese
policy changes have important implications for the economic interests
of pharmacists because, as explained in the case study of the competing
interests of the patented and generic drug industries, pharmacists dispro-
portionately benefit financially from the sale of generic drug products at
the retail level and therefore have an economic incentive to seek control
over what kind of drugs are ultimately dispensed to consumers.
Chapter 11: Why nothing changes: Interest group incentives 177
www.fraserinstitute.org | Fraser Institute
Private-sector health insurers
e public/private split of the Canadian health system has excluded pri-
vate insurers from covering medical services like hospitals and physi-
cians. However, even though government drug programs insure about
one third of the population, private insurance coverage for outpatient
prescription drugs has historically been permitted by the state and most
of the working-age population obtains such coverage for outpatient drugs
through insurance provided by their employers. is public/private split is
an important influence on how health insurers view economically liberal
approaches to prescription drug policy. Due to the public/private split
of Canada’s health system, Canadian health insurers have no economic
incentive to view the cost of their drug insurance claims in terms of total
health expenditures. Private health insurers are incentivized to view the
cost of prescription drugs in a “silo”—that is, separate from other health
expenditures, despite evidence suggesting that efficiencies can be gained
for total health spending when drug treatments substitute for, or comple-
ment other, non-drug methods of treating disease. In turn, this means
that private health insurers might also have an incentive to support gov-
ernment-imposed restrictions on consumer choice regarding medicines.
Currently, most public policies that restrict consumer choice of medicines
do not affect the bottom line of private health insurers because such poli-
cies only apply to recipients of public drug programs. However, based on
the hypothetical incentives, it would not be surprising if in the future
one were to observe that the Canadian health insurance industry quietly
invited state regulation of private-sector drug benefits or other anti-liberal
prescription drug policies that tend to restrict consumer choice. It would
also not be surprising if one were to see the Canadian health insurance
industry supporting the state’s efforts to centralize and bureaucratize a
process of assessing the pharmacoeconomic value (after these drugs have
already been approved of as safe and effective by Health Canada) of new
drugs before declaring such drugs eligible for reimbursement under public
drug plans. Currently, competition between health insurers on the basis
of the scope of benefit coverage constrains such centralized restrictions
on consumer choice, but the health insurance industry might be expected
178 Canadian Health Policy Failures
Fraser Institute | www.fraserinstitute.org
to request government regulation that would impose these supply-side
decisions on the private sector so as to level the competitive playing field
in a way that is not as obvious to consumers as a regulatory standard for
co-insurance would be. Pharmacoeconomic evaluation of medicines is
an emerging public policy issue and there is no hard evidence to suggest
that the Canadian health insurance industry is currently advocating for
government-imposed restrictions on consumer choice, but the incentives
to do so are in place.
Business and labor
For similar reasons, business might also be expected to support govern-
ment restrictions on consumer choice when it comes to accessing new
medicines. Due to the public/private split of the health care system, the
kind of health insurance provided through employment benefits covers
outpatient drugs, but does not cover other medical expenditures that
could be reduced by increased access to drugs. erefore, Canadian
business faces similar economic incentives to those described above for
the health insurance industry. As a result, it would not be surprising if
Canadian business opposed economically liberal prescription drug poli-
cies regarding consumer choice, despite their location in the private sector.
Canadian business might also face economic incentives to oppose other
types of economically liberal health policies.
For instance, business groups might perceive that the presence of a pri-
vate health insurance system would impose costs that are currently borne
by taxpayers on employers. is perception is probably caused by the false
but commonly heard notion that the only alternative to Canadian health
policy is the American system. In the United States, most people who have
private health insurance coverage obtain it as a benefit of employment.
As a result, American employers appear to bear a significant cost burden
in providing health insurance benefits for their employees. is situation
has developed in the US because such benefits are not taxable like wages,
even though they represent “income” in the form of non-cash payment.
e preference for employer-paid health insurance created by the unequal

Chapter 11: Why nothing changes: Interest group incentives 179
www.fraserinstitute.org | Fraser Institute
tax treatment of income and benefits in the US means that employers end
up administering and bearing the direct costs of providing health insur-
ance. While theory suggests that this cost is ultimately borne by employ-
ees in the form of lower cash wages and by consumers in higher prices,
the hidden nature of the cost and the “stickiness”87 of wages means that
employers probably would not be able to immediately transfer the entire
burden onto employees in the form of lower wages and would therefore
suffer temporary transitional costs. Canadian employers who believe that
the only alternative to Canadian health policy is the American system
might therefore conclude that moving from the status quo in Canada
would transfer the costs of health insurance from taxpayers to employers.
erefore, the incentives for Canadian business are to support the sta-
tus quo because they perceive that it represents a subsidy paid by taxpay-
ers to business. Similarly, due to the false assumption that the US system
is the only alternative to Canada’s health policies, labor unions probably
also think that the presence of private health insurance would shift costs
onto employers. e fear that this cost is eventually passed on to employ-
ees in the form of lower wages creates incentives for unions to view the
introduction of private insurance options as a potential impediment to
future wage gains.88
Economists have argued that market prices are responsive to changes in supply
and demand. However, economists have observed that the price of labor (i.e., wages) is
not as downwardly responsive as the prices of other goods and services are to declin-
ing demand. Wages rise more quickly than they decline and are therefore referred
to as being “sticky.”
It is important to point out, however, that liberalization need not shift the cost
burden of health insurance onto business. For example, if there was a legal require-
ment for people to individually buy health insurance with their own after-tax incomes,
or if employment-provided health insurance benefits were simply taxed at the same
rate as cash income, then there would be no advantage to obtaining such benefits
from employers. Individuals would face no disincentives to buy insurance on their
own. Health insurance would be purchased in the same way as automobile, home, and
life insurance—none of which are obtained from employment benefits. is policy
approach would eliminate the insurance cost impediment to future wage gains and
one of labor’s economic incentives to resist health policy liberalization.
www.fraserinstitute.org | Fraser Institute
Chapter
Why nothing changes:
Political incentives
Rational choice and political incentives
As mentioned earlier, rational choice theory starts with the assumption
that people are motivated as much by their own self-interest in political
actions as they are in economic decisions. e theory proposes that poli-
tics and public policy outcomes can best be understood and explained
by analyzing the particular set of incentives faced by political actors in
much the same way that the science of economics attempts to explain
and predict the behavior of firms and consumers in a market. According
to Tullock (), the assumption that political actors are motivated by
rational self-interest leads immediately to the obvious conclusion that the
primary motivation of politicians in a democratic society is to win elec-
tions. While politicians are sometimes willing to risk losing voter support
in order to do something they believe in principle to be correct, on the
whole they can be expected to act in such a way that maximizes their own
well-being in terms of re-election prospects. As Tullock points out, this is
often interpreted to mean that because a plurality (sometimes a majority,
depending on the type of electoral system) of the public decides election
outcomes, policy decisions in a democracy should generally align with
the public interest. However, Tullock goes on to describe the ways in
which various factors can intervene to distort elections and produce policy
182 Canadian Health Policy Failures
Fraser Institute | www.fraserinstitute.org
outcomes that are not rationally aligned with the public interest, includ-
ing the impact of information asymmetry discussed in an earlier chapter.
Working under rational choice assumptions, it is easy to see the incentives
that could encourage the majority of voters to resist policy reforms that
serve the public interest. For instance, public policy outcomes that seem
irrational from a public interest point of view can often be preferred by a
plurality of the electorate because the distribution of the costs and ben-
efits of public policies is not equal across the population of voters. e
unequal distribution of benefits and costs can influence voters to prefer
public policies that do not necessarily serve universal public interests.
More specifically in regard to the thesis of this paper, the unequal dis-
tribution of the costs of failed health policies often means that a majority
of voters are insulated from the negative impacts of economically irratio-
nal policy approaches, and this potentially explains the reluctance of the
electorate to demand certain kinds of reforms. is chapter examines
the distributional impact of Canadian health policy failures to show that
the electoral incentives facing policy makers are counter to the adop-
tion of economically liberal health policy reforms—even when the cur-
rent policy regime is producing suboptimal outcomes. Specifically, the
electoral incentives produced by the distribution of the tax burden and
of illness are barriers to the introduction of economically liberal health
policy reforms. Buchanan () observed a similar dynamic in the British
National Health System (NHS). Buchanan noted several fairly obvious
and significant systemic failures that had accumulated between the intro-
duction of the NHS in and the writing of his paper in . He
observed that “governmental decision-makers have not expanded invest-
ment in supplying health services to the levels of expressed individual
demands. e inefficiencies that have arisen are clearly not in the form
of excessive total outlay on the health services. e British experience
strongly suggests that rather than responding to ‘needs’ through increases
in aggregate supply, governments have chosen to allow the quality of ser-
vices to deteriorate rapidly, both in some appropriate, physically-mea-
surable sense and in terms of congestion costs imposed on prospective
consumers”(Buchanan, : ). Similar observations about the Canadian
system have been empirically demonstrated in this paper. Buchanan could
Chapter 12: Why nothing changes: Political incentives 183
www.fraserinstitute.org | Fraser Institute
have indeed predicted Canadian health policy failures because the struc-
ture of the Canadian health system took its inspiration from the policy
structure of the NHS. According to Buchanan,
the observed failures of the NHS can be explained by the structure
of the institutions … In models that approximate to the British
structure, I shall explain the observed results by showing that in
their private or individual choice behaviour as potential users or
demanders of health-medical services, individuals are inconsistent
with their public or collective choice behaviour as voters-taxpayers
who make decisions on supplying these same services. e individ-
uals who are the demanders and those who are the suppliers are, of
course, basically the same persons acting in two separate roles, and
the facts themselves suggest the inconsistency. My central point
is that this inconsistency does not in any way reflect irrationality
on the part of individual decision-makers, but that it arises exclu-
sively from the institutional setting for choice on the two sides of
the account. Once this relatively simple point is recognised and
accepted, the directions for possible constructive reforms become
clear. (Buchanan, : –)
According to Buchanan, the problem is that these two roles represent
conflicting sets of interests, based on the underlying economic incentives.
As he explains,
If the price elasticity of individual demand, i.e. the responsiveness
to a (small) change in price, is significantly higher than zero over
the applicable range, governments cannot efficiently ‘give away’
goods or services … If government tries to supply goods or ser-
vices that are privately divisible among separate persons at zero
prices to users, the quantity demanded by all individuals in the
aggregate will be significantly larger than the quantity that would
be demanded at prices set by (marginal) cost, except where the
price elasticity approaches zero. For some goods and services, this
required elasticity condition is satisfied. For example, government
184 Canadian Health Policy Failures
Fraser Institute | www.fraserinstitute.org
could, without undue losses in efficiency, provide ‘free’ funeral ser-
vices, for the very simple reason that each person dies only once; a
zero price does produce a larger demand for funerals than a high
(or even a low) price. For other goods and services, ‘free’ provi-
sion would obviously be impossible, for example, beefsteaks, motor
cars, and minks. Between such extremes as these, various goods
and services may be arrayed in terms of predicted elasticity coef-
ficients over the relevant range of prices … Medical-health services
clearly fall somewhere along the spectrum … for certain types of
medical care, price elasticity may be low indeed; there should be
approximately the same number of broken legs treated under zero
and under marginal-cost prices. For other types of health service,
however, price elasticity may be relatively high. e British experi-
ence suggests that the demands for drugs and for consultation by
general practitioners and possibly for hospital care fall into this
category. For medical-health services taken as an undifferentiated
whole, individuals will be led to demand significantly larger quanti-
ties at zero user prices than they would demand at positive prices.
(Buchanan, : –)
Buchanan argues that as consumers, individuals will demand more
services privately than they are willing to supply publicly as taxpayers.
According to Buchanan, “this is the kernel of the internal conflict in the
National Health Service” (Buchanan, : ). Buchanan reasons that
suboptimal outcomes in single-payer health insurance systems like the
NHS and Canadian Medicare can be explained by the fact that the health
policy choices of governments are driven by the perverse political incen-
tives that result when resources are centrally allocated through collective
decision processes. According to Buchanan,
In responding to ‘needs’ criteria at zero user prices, governments
would have been predicted to devote relatively too much public
outlay to the provision of such divisible, personal services as medi-
cal care, ‘too much’ being measured against the standard criteria
for allocating resource use of consumer preferences as expressed
Chapter 12: Why nothing changes: Political incentives 185
www.fraserinstitute.org | Fraser Institute
in the market. e alternative response that governments might
make is such situations seems rarely to have been considered. ey
may make decisions on the supply of the service independently
of the demands for the service, and on the basis of quite different
considerations. As a result, the inefficiencies may take the form of
deterioration in the quality of the services themselves, including
congestion of available facilities. (Buchanan, : )
Buchanan focused his analysis on the perverse incentives facing
consumers/taxpayers/voters on the demand side of political decisions.
Mitchell and Simmons () also identify perverse political incentives
facing policy makers/politicians on the supply side of collective decision-
making processes. ey argue that political incentives also encourage the
adoption of policies that are suboptimal. According to their view,
Some spending is politically more profitable than others. Perhaps
the basis consideration is this: Spend money on private benefits
that are not only highly visible but also sufficiently large to make a
difference for recipients … In short, the politician asks two ques-
tions: () How many additional votes will I receive for each addi-
tional dollar spent? () How many additional votes will I lose for
advancing the welfare of some groups at the expense of others? In
choosing among alternative spending projects, politicians attempt
to compare the added votes form each added dollar of spending
per project and determine the mix that guarantees the maximi-
zation of votes. Minimizing votes lost from increasing taxes is
assured by the same logic, that is, when choosing among alterna-
tive taxes, it is best to match the marginal votes lost from each tax.
(Mitchell and Simmons, : )
e demand-side and supply-side incentives identified by Buchanan,
and Mitchell and Simmons might encourage perverse decisions about
how to allocate public health spending. For instance, the purpose of
health insurance is to collectively share the risk of medical expenses
that are individually unaffordable and which occur infrequently across
186 Canadian Health Policy Failures
Fraser Institute | www.fraserinstitute.org
a population. Yet there is an observed tendency in the Canadian public
health insurance system to extend coverage for services that are fre-
quently used by most people, but which are individually affordable with-
out insurance, such as physician office visits, generic drugs, pregnancy-
labor-delivery hospital services, and obsolete diagnostic technologies.
At the same time, Canadian governments increasingly restrict coverage
for (or spending on) advanced surgical services, newer medicines, and
advanced diagnostic technologies, as well as the goods and services
utilized by so-called “orphan” patient groups with rare diseases. is
policy approach is, of course, precisely the opposite of what insurance
is supposed to do, which is to collectively share the risk of infrequent
but catastrophic expenses.
Distribution of the tax burden and the burden of illness
e demand-side and supply-side incentives identified above can be theo-
retically illustrated by examining the distribution of the tax burden in
Canada. is paper has argued that there are some fairly obvious and
persistent failures of Canadian health policy that are related to Medicare’s
publicly funded, single-payer, full insurance structure. Yet Canadian gov-
ernments have resisted introducing economically liberal policy reforms
like user fees and other private payment options. One potential reason
for this is that it has been politically more expedient to instead rely on
taxes because the people who carry most of the tax burden in Canada
represent a minority of voters. is situation occurs because taxation and
public spending in Canada are highly redistributive. Figure shows the
distribution of the tax burden by family income deciles in Canada in .
Income deciles are grouped into the lowest income %, middle income
%, and upper income % of Canadian families. e graph indicates
that less than one third of the population pays two thirds of all personal

Chapter 12: Why nothing changes: Political incentives 187
www.fraserinstitute.org | Fraser Institute
taxes in Canada. e % of families with the highest incomes in Canada
pay roughly % of all personal taxes collected by governments.89
Ontario’s introduction of a new income surtax, labeled a “health
premium” by the province, also illustrates the unbalanced distribution
of the tax burden to pay for health care in Canada. Table displays
the amounts of surtaxes applying to individuals under the new health
premium for , , and subsequent taxation years, by designated
income categories. Table shows the estimated number of Ontario tax
filers in in each of the ranges of taxable income used to apply the
new health surtax. e data indicate that nearly four million Ontario tax
filers, or % of all tax filers in , were exempt from paying for the
new surtax and were therefore shielded entirely from the costs of this par-
ticular health policy decision. e distribution of the total tax burden to
pay for government health spending is heavily skewed toward the highest
income earners.90 e data illustrate the way in which the costs of health
care are borne most acutely by a relative minority of the population, and
therefore also a minority of voters.
e data shown above illustrate how the political incentives under tax-
funded government-run health insurance are not favorable to the intro-
duction of consumer cost sharing as an approach to financing medical
care. e unequal distribution of the tax burden means that policy makers
face fewer political risks from raising taxes to fund health care than from
introducing new price mechanisms that are paid by everyone on the basis
of their own consumption of medical goods and services—though this is
exactly the kind of policy that could make public health expenditures more
sustainable, improve the value for money spent on health care, and pre-
serve consumer choice. Politically, it is easier to impose disproportionate
According to Statistics Canada, in the top % (approximately) of Canadian
families with the highest incomes had gross annual family incomes from all sources
starting at $, before taxes (Statistics Canada, ). Looked at on the basis
of cash income after taxes, it has been estimated that in a Canadian family is
included in the highest income % when its annual net cash income after taxes
exceeds $, (Veldhuis and Walker, ).
is is also confirmed by table in chapter one.

188 Canadian Health Policy Failures
Fraser Institute | www.fraserinstitute.org
Figure 13: Percentage of the burden for paying all personal taxes, by
income decile group, 2005
Lower income
3 deciles
(30% of families),
4.3%
Upper income
3 deciles
(30% of families),
66.3%
Middle income
4 deciles
(40% of families),
29.4%
Source: Veldhuis and Walker, 2006; calculations by the author.
Table : Surtax assessments under Ontario’s “Health Premium”
Taxable income Surtax payable in
2004 taxation year
Surtax payable in 2005 and
subsequent taxation years
Up to $20,000 $0 $0
$20,000–$36,000 $150 $300
$36,000–$48,000 $225 $450
$48,000–$72,000 $300 $600
$72,000–$200,000 $375 $750
More than $200,000 $450 $900
Source: Skinner, 2004a; Ontario Ministry of Finance, 2004.

Chapter 12: Why nothing changes: Political incentives 189
www.fraserinstitute.org | Fraser Institute
tax increases on a minority of voters instead. By extension, the unequal
distribution of the tax burden also means most people are dispropor-
tionately insulated from the cost or “price” of public health insurance
programs. erefore, the majority of voters have significantly reduced
financial incentives to make cost-benefit calculations about the perfor-
mance of the health system.
Similarly, the distribution of the burden of illness in Canada reinforces
the proposition that perverse demand-side and supply-side incentives
could theoretically be part of the explanation for resistance to health
policy liberalization in Canada. Centrally planned rationing of access to
health care is obviously not a sustainable policy option for controlling
the annual growth in public health spending. It is certain that patients
will experience increasing medical risks from waiting if centrally imposed
rationing is used to hold down the growth in public health spending indefi-
nitely. Yet Canadian governments routinely use such policy approaches
to control public health expenditures. A natural question then is how are
policy makers still able to maintain support for a public health insurance
monopoly when the system is increasingly characterized by declining
value for money and inadequate access? A big part of the answer is that
Table 25: Number of Ontario tax filers in selected income categories,
2004 taxation year
Taxable income Estimated number of tax filers
Up to $20,000 3,995,000
$20,000–$36,000 2,125,000
$36,000–$48,000 1,195,000
$48,000–$72,000 1,295,000
$72,000–$200,000 650,000
More than $200,000 85,000
Total 9,345,000
Source: Skinner, 2004a; Ontario Ministry of Finance, 2004.
190 Canadian Health Policy Failures
Fraser Institute | www.fraserinstitute.org
those most directly and intensely harmed by a lack of access to medical
care make up an extremely small percentage of the population, and there-
fore represent too few votes to have a decisive influence on policy makers
about declining access and coverage under Medicare.
Skinner (c) examined individual-level data on Medicare utili-
zation covering the entire population of Nova Scotia over a seven-year
period. Figure shows the individual distribution of the use of physi-
cian services in the province for the year . Physician services are
used as proxy for access to Medicare services in general. e data show
that the distribution of physician utilization is heavily skewed toward a
small percentage of the population who are intensely ill. In this example,
serious expenditure on illness was defined with reference to expenditure
levels identified as “catastrophic” in the report by the parliamentary
Commission on the Future of Health care in Canada led by Roy Romanow.
e Romanow Commission defined a catastrophic expenditure on drugs
at $, per person annually (Romanow, ). Romanow’s catastrophic
threshold seems reasonable given that Statistics Canada data from the
same year shows that the average Canadian household spent $, on
recreation, $, on tobacco and alcohol, and $, on charitable
donations (Statistics Canada, b). e same level of expenditure is
used here as a proxy for catastrophic expenditures on medical services
in general. e Nova Scotia data (figure ) show that less than % of
the population used more than $, worth of physician services annu-
ally. is distribution was typical in any given year. Similarly, using data
from Manitoba, Romanow found in that only % of the population
had annual prescription drug costs above the commission’s catastrophic
threshold of $, per person (Romanow, ). Finally, data on hos-
pitalization across Canada indicates that less than % of the population
is admitted to hospital annually (CIHI, c). is means that at any
given time, only a very small percentage of the public uses health care
intensely. By contrast, the vast majority of the population is relatively
healthy and makes comparatively little use of medical goods and services.
In fact, nearly % of the Nova Scotia population never used a physi-
cian’s services at all in (figure ). What such statistics show is that
seriously ill people—those who are most directly affected by government

Chapter 12: Why nothing changes: Political incentives 191
www.fraserinstitute.org | Fraser Institute
policies that restrict access to publicly funded medical care—represent a
very small minority of voters.91
Evans (b: ) has also observed, “the fact that at any one point in time a
majority of the population is very little touched by health care costs, means that most
people would not immediately be hurt by a reduction in public funding. Some would
be hurt a great deal, but they are a minority.”
$0 Less than Less than Less than More than
$500 $1,000 $1,500 $1,500
Percentage of spending
10
20
30
40
50
60
70
80
90
100
Figure 14: Distribution of annual individual spending on physician
services, Nova Scotia, 2001
Source: Skinner, 2005c; PHRU, 2002.
192 Canadian Health Policy Failures
Fraser Institute | www.fraserinstitute.org
It is possible that politicians are not merely ignoring the ill segment of
the population. Elected officials may just be less acutely aware of how the
failures of Canadian health policy are affecting these people. Moreover,
poor health conditions prevent the ill from being politically active enough
to register their plight with elected officials. However, these factors are
countered by the presence of patient advocacy organizations who have
given ill Canadians a voice in the political process. e media is also pay-
ing increasing attention to the failures of access in Canada’s health care
system. Nevertheless, even when politicians are aware of how Canada’s
health policy failures are affecting ill people, they face a general popula-
tion that is mostly unaware of the failings of the health care system. Most
Canadians believe the health care system will be there for them when they
need it, even if the evidence suggests it fails when people need it most. is
is because most people are healthy, and healthy people don’t use much
health care. Most people assume the system is working fine because they
very rarely need health care or very rarely make more than marginal use
of medical goods and services. Politically, this simply means that it is more
expedient for elected officials to declare that the system is working fine
instead of drawing attention to the failures of government health policies
and making an otherwise satisfied population become discontent.
Unequal burden of policy failure
It has also been argued (Skinner, a) that it is important to consider
that policy makers have interests of their own and that the costs of policy
failures do not affect the interests of the policy makers and the public to
the same degree or in the same way. e implication of this observation is
that the political incentives that drive policy makers are often in conflict
with the public interest or in conflict with special interests in the policy
community. Some kinds of policy failures may also be perceived as more
important by policy makers because the impact on the interests of policy
makers is more acute than the effect on either the public or special inter-
ests. e implication of this observation is that the political incentives
that drive policy makers are often in conflict with the public interest or
Chapter 12: Why nothing changes: Political incentives 193
www.fraserinstitute.org | Fraser Institute
other special interests in the policy community. ese conflicting political
incentives can lead to policy failures.
A good example of this concept is observed in the regulation of drug
safety. Approving a new drug requires regulators to make decisions with
imperfect knowledge. ere are significant limitations to the information
that can be generated by pre-market clinical trials as well as post-market
drug surveillance. Data obtained from clinical testing is not necessarily a
reliable reflection of the expected effect of a drug in the general population.
e results obtained from pre-marketing clinical trials for a new medicine
sometimes do not reveal effects that later become apparent when the drug
is used by a larger patient population. e safety of new agents cannot
really be known with certainty until a drug has been on the market for
many years (Lasser et al., ). For example, a large clinical trial involv-
ing , patients might not reveal an adverse reaction that occurs at the
rate of one in , patients. Participants in a clinical trial are required
to be assessed against a number of inclusion and exclusion criteria nec-
essary for the clinical assessment of the drug. ese criteria might not
completely reflect the characteristics of the broader population of patients.
Additionally, to isolate the effect of one specific medication, patients in
clinical trials usually do not receive other medications and do not suffer
other known disease conditions (Lasagna, ). is situation is hardly
ever true for the patients who will take the drug after it is released to the
market. is means that pre-release clinical trials may provide little insight
into interactions and adverse reactions in populations with a number of
medical conditions and prescriptions.
Yet there are also limitations to the use of data obtained from the post-
market surveillance of a drug’s effects on the general population. ere is
usually little agreement among clinical pharmacologists on what causes an
adverse drug reaction. And a direct link between a drug and the adverse
reaction is almost impossible to establish with certainty. For patients who
take several drugs at the same time, it is hard to isolate which drug or
what combination of drugs caused the underlying reaction. Often the side
effects caused by drugs do not have any uniquely attributable character-
istics and anything that can be caused by an adverse reaction to a drug
could also occur independently (Lasagna, ). Furthermore, patients do
194 Canadian Health Policy Failures
Fraser Institute | www.fraserinstitute.org
not always receive prescribed drugs as directed and non-compliance can
lead to harmful consequences for human health (Lasagna, ). In fact,
it is estimated that % to % of the adverse drug reactions are prevent-
able because they result from over- or under-dosage and non-compliance
(Sjoqvist, ). In addition, from a statistical standpoint, there is a high
degree of variability in the rate of adverse drug reactions (ADRs) reported
to health agencies. e change in the number of ADRs reported to health
agencies is used to justify the withdrawal of a new drug from the market.
However, the change in reported ADRs often represents only a single
year of data and thus does not rule out the possibility that it was merely
a result of statistical chance. Without the drug remaining on the market
long enough to show a pattern, there is just no way to know if the number
of reported ADRs might have returned to the previously observed lower
rates (or even below them) in following years. Without further years of
data, it is simply impossible to know whether the observed results in any
of these cases represented real risks or statistical anomalies.
e cost of increasing post-market surveillance must also be consid-
ered. Imperfect information leaves regulators in a position of uncertainty.
Yet there are diminishing returns from imposing increased drug testing
in order to further reduce uncertainty. Post-market surveillance can be
an important part of a drug’s safety and efficacy assessment. It can cor-
roborate the findings of previous clinical studies and add new information
that can only be obtained after the product has been used by the larger
patient population (Lasser et al., ). However, pre-market regulation
of drug safety already involves a significant trade-off: assurance of product
safety at the cost of lengthy delays before the health benefits associated
with a new drug are available to patients. Increasing the rigor or scale of
pre-market clinical testing would worsen this trade-off and add additional
costs to drug development, which is already expensive. In economic terms,
the additional information on drug safety and efficacy that can be obtained
from more rigorous or frequent testing is subject to diminishing returns.
In other words, the additional amount of reassurance of drug safety that
comes with more testing gets smaller as more trials are conducted. At
some point, both the direct and indirect costs of more testing outweigh
the benefits that can be gained from it.

Chapter 12: Why nothing changes: Political incentives 195
www.fraserinstitute.org | Fraser Institute
Inadequate or imperfect knowledge can lead to errors in regulatory
decisions. To make matters worse, not only do regulators operate in an
environment of uncertainty, they also face conflicting incentives when
trying to reduce the potential for errors in drug-approval decisions that
might encourage them to be excessively cautious. A drug-approval regula-
tor can make two types of decision errors.92 Table displays a regulatory
decision matrix showing the two types of errors. e first decision error,
commonly called type , is that of mistakenly allowing an unsafe drug into
the market (Grabowski and Vernon, ). A type- error is the opposite:
mistakenly rejecting a new drug that is safe and effective (Grabowski and
Vernon, ). e regulator faces unbalanced incentives to reduce these
two kinds of errors (Grabowski and Vernon, ). e burden of a type-
error is borne directly by consumers, who suffer harm because they are
denied access to a potentially beneficial treatment that they may have been
willing to risk much earlier. Type- errors also directly affect drug makers.
When a regulator mistakenly refuses to allow a new, effective medicine to
enter the market, the innovative drug firm loses the opportunity to earn
the revenue that could have been gained from sales of the unapproved
drug. e loss of revenue could affect decisions to invest in the develop-
ment of new medicines in the future.
Conversely, regulators face very few potential negative outcomes from
making a type- error. e lost health benefits caused by a regulator who
mistakenly rejects a safe and effective drug are hidden from the public.
e public may never become aware of the lost potential health gains since
the drug never becomes available on the market. By contrast, a type-
error is very obvious to the public. Adverse drug reactions are monitored
and reported by health professionals and researchers and vigorously pub-
licized by the media. Type- errors, therefore, expose regulators to far
greater public-relations repercussions than type- errors. Grabowski and
Vernon (), Higgs (), and Graham () have all argued that the
unbalanced incentives upon the regulator to avoid type- errors can lead
to excessive caution in the approval process for drug products. Excessive
e classification of these errors is frequently referenced and explained through-
out the economics literature.

196 Canadian Health Policy Failures
Fraser Institute | www.fraserinstitute.org
caution minimizes the risk that the regulator will be held responsible for
any errors but does not necessarily minimize the net health risk to the
public as a whole that is caused by the loss of unrealized potential health
benefits.
Table : Drug safety decision matrix
Quality of drug
Regulator’s decision Drug is safe Drug is unsafe
Approve Correct decision Type 1 error
Reject Type 2 error Correct decision
Source: Skinner, 2007a.
www.fraserinstitute.org | Fraser Institute
Chapter
Prospects for reform in Canada
Room to move within the CHA
e formal structure of Canadian federalism, centralized parliamentary
government, and the country’s electoral system should theoretically
facilitate any type of health policy innovation, including liberalization.
Specifically, the constitutional division of powers grants the provinces
independent legislative authority for medical insurance and medical ser-
vices policy, and so provincial policy makers are empowered to adopt
reform if they choose to. e tendency of the single member, simple plu-
rality electoral system to produce majority governments for parties with a
plurality, but a minority, of the vote should also make it easier for provin-
cial parties that favor reform to win elections and adopt major changes in
health policy. And finally, the centralized nature of political power result-
ing from party discipline should also make it easier for governments to
introduce policies that deviate significantly from the status quo.
Despite this, provincial governments have not pursued health policy
liberalization. Part of the reason is that the actual practice of federalism
is not consistent with the formal constitutional division of powers. e
national government’s policy of making federal transfers conditional on
compliance with the Canada Health Act (CHA) significantly reduces the
degrees of freedom for health policy options in the provinces. e condi-
tional use of federal spending power has produced a de facto institutional
barrier to health policy liberalization.
198 Canadian Health Policy Failures
Fraser Institute | www.fraserinstitute.org
Yet, two paradoxes remain. First, despite its significant constraints
on provincial policy freedom, the actual degree of policy freedom that
the CHA allows is still greater than most people assume. Second, the
economic incentives produced by the universal publicly funded design
of provincial health insurance would act as a barrier to health policy lib-
eralization even in the absence of the CHA.
e CHA is not as restrictive of provincial health policy choices as
many believe. For instance, the act does not specify what “medically
necessary” means in terms that are equally recognized and implemented
across the provinces. e actual provisions of the CHA define “medically
necessary” to include physician and hospital/surgical care and further
defines these terms as follows:
“hospital services” means any of the following services provided to
in-patients or out-patients at a hospital, if the services are medi-
cally necessary for the purpose of maintaining health, preventing
disease or diagnosing or treating an injury, illness or disability,
namely, (a) accommodation and meals at the standard or public
ward level and preferred accommodation if medically required, (b)
nursing service, (c) laboratory, radiological and other diagnostic
procedures, together with the necessary interpretations, (d) drugs,
biologicals and related preparations when administered in the hos-
pital, (e) use of operating room, case room and anaesthetic facilities,
including necessary equipment and supplies, (f) medical and sur-
gical equipment and supplies, (g) use of radiotherapy facilities, (h)
use of physiotherapy facilities, and (i) services provided by persons
who receive remuneration therefor from the hospital, but does not
include services that are excluded by the regulations.
“insured health services” means hospital services, physician services
and surgical-dental services provided to insured persons, but does
not include any health services that a person is entitled to and eli-
gible for under any other Act of Parliament or under any Act of
the legislature of a province that relates to workers’ or workmen’s
compensation.” (Canada Health Act, R.S., , c. C-)
Chapter 13: Prospects for reform in Canada 199
www.fraserinstitute.org | Fraser Institute
However, in practice, the type and range of medical goods and ser-
vices insured in each province varies. It has come to be accepted that if
something is funded by a province, this means it has been deemed by
that province to be “medically necessary.” If it is not publicly funded, it is
by default considered to be medically unnecessary by that province. It is
conceivable that the provinces could game this definitional lack of clarity
in the CHA to privatize many insurable goods and services. is could be
achieved by introducing a deductible and defining (by default) expenses
below the deductible to not be “medically unnecessary” for the purposes
of insurance coverage eligibility. ere is precedent for this in government
decisions to withdraw coverage for previously insured goods and services
under provincial health insurance programs.
Furthermore, despite commonly held beliefs, the CHA does not pro-
hibit private insurance for medical services—even those covered by pro-
vincial health plans (Flood and Archibald, ; Giorno, ; Boychuk,
). While six out of provinces have their own laws prohibiting pri-
vate health insurance, the prohibition is not actually required by the pro-
visions of the CHA. In addition, in the six provinces that do ban private
health insurance, the ban extends only to the purchase of health insurance
for services provided within the province. In all Canadian provinces,
people are free to buy health insurance that covers access to hospital and
physician services outside the province they reside in, and in four of
provinces there is no ban on private health insurance at all. Legal experts
have also noted that the CHA
does not control what individuals or businesses can or cannot do
regarding health insurance. In fact, courts have consistently held
that they cannot rule on whether a province has complied with the
CHA. Courts have held this is a political rather than a legal matter,
and that the ramifications of non-compliance with the CHA must
be determined by the federal cabinet and Minister of Health, by
possibly withholding cash transfers. (Bridge, )
Yet despite the actual limitations of the CHA, the fact remains that, in
practical terms, private health insurance has not actually been available

200 Canadian Health Policy Failures
Fraser Institute | www.fraserinstitute.org
in Canada for any medical service covered under provincial health insur-
ance plans. ere are three main reasons for the lack of available insur-
ance coverage for core medical services in the private sector in Canada.
First, universal eligibility for public health insurance reduces the
demand for private insurance coverage to the point where there is no
viable market. People are not incentivized to pay privately for insurance
coverage that they believe they already have paid for through taxes.93 e
lack of adequate market demand for health insurance covering hospital
and physician services means it has not been economically feasible for the
private sector to offer medical insurance in Canada. Under the current
system, the demand for private insurance increases with the realization
that government health insurance does not provide adequate or timely
access to medical care. People only discover the failings of the government
health insurance system when they are sick and can’t get access to publicly
funded treatment. At that point, they have a pre-existing condition and
therefore cannot be insured by private plans even if they wish to pay for it.
Second, some provinces prohibit parallel billing by health care provid-
ers. In these provinces, hospitals and physicians are not allowed to accept
private payment or private insurance reimbursement while also accepting
public payment from provincially insured patients. Health care providers
must choose to work either for private payment or public payment but
cannot elect both. Because the market for private payment is small when
everyone is eligible for public insurance coverage, most doctors are not
willing to surrender their billing rights in the public system, and therefore
do not even make their services available for private payment.
ird, the federal government has interpreted the CHA more broadly
than its actual provisions and threatened to reduce federal transfers where
private payment is allowed. It is possible for the federal government to
do this because the provinces do not have a legal claim to federal fund-
ing for health care. Federal health transfers are discretionary spending of
the national government and can be withheld for any reason, whether it
is an actual violation of the CHA or a violation of the government’s own
is might help to explain Boychuk’s () finding that public opinion does not
favor the introduction of private financing.
Chapter 13: Prospects for reform in Canada 201
www.fraserinstitute.org | Fraser Institute
particular interpretation of the CHA. When political demands to limit the
involvement of the private sector are on the rise, the spirit, if not the letter
of the CHA can be cited to enforce an effective ban on private payment for
health care in Canada through the threat of withdrawing federal funding.
Public opinion
Based on the analysis presented in this paper, the political factors that act
as barriers to health policy liberalization in Canada appear formidable.
Additionally, public opinion is often perceived to be solidly opposed to
economically liberal reforms (e.g., Boychuk ). However, interpret-
ing public opinion is often a subjective enterprise. As pollsters know, the
kinds of responses reported by survey participants can be heavily influ-
enced by the kinds of questions asked in the survey. e real trade-offs
between policy choices, and the real alternative policy approaches are
not always presented to survey respondents. Public opinion surveys have
the potential to produce a picture of public opinion that is not reflective
of actual views, and this in turn could lead policy makers to incorrectly
interpret the results of opinion polls on health care reform. In other words,
research on public opinion has the potential to create information asym-
metry for policy makers, leading them to believe that Canadians are more
(or less) opposed to economically liberal reforms than they actually are.
In fact, there is some polling evidence that suggests that economically
rational health policies could be successfully adopted in Canada.
In , just prior to the publication of the final report of the federal
parliamentary Commission on the Future of Health Care in Canada led by
Roy Romanow, I examined the state of Canadian public opinion regard-
ing health policy reform. Research at the time suggested that, at the core,
many Canadians simply wanted a health care system that provided high-
quality medical services and was financially sustainable at an acceptable
economic price, without excluding lower income people from access to
medically necessary services. In their typically pragmatic way, Canadians
were not worried about whether it was the private sector or the public sec-
tor that achieved this goal; they just wanted results. Yet, when Canadians
202 Canadian Health Policy Failures
Fraser Institute | www.fraserinstitute.org
did express a preference for either private or public approaches to health
reform, the majority was willing to fund many of their future medical
needs themselves rather than pay higher taxes to expand the single-payer
model of health care.
According to a Environics poll entitled e National Pulse on
Health Strategy (Environics, ), % of Canadians at the time wanted
major reforms to the health care system. Additionally, two thirds of
Canadians (%) tended to be supportive, more or less, of a host of new
models of financing in order to reduce stress on the system—for example,
where everyone (except those with low incomes) pays a small amount
for health care services out of their own pocket. Just under half (%)
tended to be supportive of market-oriented reforms built on concepts like
greater efficiency, accountability, and customer service, including private-
sector companies delivering health care services. e same poll found that
fewer than half of respondents would support increasing taxes to pay for
health reforms. However, only % of Canadians would accept a health
care system that excludes those who cannot afford to pay for services.
ese results need not be seen as a contradiction. As Jane Armstrong,
senior vice president of Environics Research Group says, “Canadians, ever-
constant champions of fair play and equity, are devoted to maintaining a
system that ensures access to quality health care for all … they’re willing to
make changes, even if this includes new and varied ways of financing the
system as well as a greater dependence on market forces such as private
companies delivering certain health services” (Environics, ).
A Decima Research poll also found that more than half (%) of
Canadians were opposed to paying higher personal income taxes even if
these funds were designated to pay for health care. An even larger majority
of respondents (%) also believed that they would have to rely on their
own personal savings to pay to use health services in the future (Lawlor,
). Similarly, a POLLARA poll taken between March and April of
(POLLARA, ) found that % of respondents believed that
any solution to fix health care sustainability would require more money
either through taxes or out-of-pocket payments by consumers, % were
willing to pay more to maintain the current level of health care, and %
were willing to pay more to increase the range of services or improve the
Chapter 13: Prospects for reform in Canada 203
www.fraserinstitute.org | Fraser Institute
timeliness of care. But, when asked specifically about how they would pre-
fer to pay for future health care costs, % of respondents were opposed
to using taxes to cover future expenses, and the majority of this group
(% of all respondents) favored out-of-pocket payments or private insur-
ance while the rest (% of all respondents) favored budget reallocations
from existing tax revenues. ese polling data suggest that there might be
potentially significant but latent political support for economically liberal
health reform in Canada.
A review of the direction of health policy reforms in the rest of the
world indicates that Canadians are not alone in preferring pragmatic
approaches to health policy. Chernichovsky () identified an emerg-
ing set of values that is commonly influencing international approaches
to health policy reform. Essentially, a functioning market in health care,
regulated by the state to achieve certain minimum societal goals, increas-
ingly characterizes the direction of health policy in advanced industrial
democratic societies. e public consensus that is emerging is concerned
with ensuring universal access to a core package of medically necessary
services while maximizing consumer choice, controlling cost pressures on
public budgets, and satisfying consumer demands for timely access to high
quality health care services (Eriksson et al., ; Musgrove, ). e
result is an evolving convergence among health system designs. ere is a
wide scope for consumer empowerment, competition, and private-sector
involvement in the arrangement and provision of health care within this
set of values. ere are also many lingering criticisms of an expanded role
for the private sector in health care. Yet, for every criticism there seems
to be an answer somewhere between a theoretical free market in health
care (which doesn’t actually exist anywhere) and the virtual government-
monopoly health system in Canada. A private competitive market for
health insurance and medical services, combined with a regulatory-subsi-
dization role for the state, could ensure that everyone has access to medi-
cally necessary services while still allowing Canadians the advantages of
consumer empowerment and competition among insurers and providers.
204 Canadian Health Policy Failures
Fraser Institute | www.fraserinstitute.org
Health reform as an electoral strategy
e formal institutional effects of Canadian parliamentary democracy
should also, theoretically, create opportunities for health policy innova-
tion of any type, including economically liberal reforms (Maioni, ).
e first-past-the-post (simple-plurality) single-member-constituency
design of the Canadian parliamentary electoral system, coupled with
multi-party competition, creates institutional dynamics that are favorable
to non-centrist reform platforms. Canada’s electoral system makes it pos-
sible for a party with a minority level of popular support to win a majority
of the seats in Parliament, depending on how the opposition parties split
the remainder of the vote. If a party happens to support health policy
liberalization, then it is much easier for that party to form a government
under Canada’s electoral system than would be possible under a two party
system where politics is, by necessity, fought around the center of public
opinion. In a parliamentary system, with single-member, simple-plurality
electoral representation and three or more parties, radical policy issues
can become election wedges that can split the opposition into separate
party interests collectively representing a minority of seats in Parliament.
e adoption of the Canada-US free trade agreement is an empirical
example of a radical policy change that, while not supported by a majority
of popular opinion at the time, can nevertheless be implemented by a party
that wins a minority of the popular vote in an election, but a majority of
parliamentary seats. In the federal election, the Conservative party
made free trade with the United States a primary issue. It is widely believed
that by doing so, it forced the Liberal and New Democratic parties to split
the portion of the popular vote that opposed the agreement. is left
Conservative candidates with the plurality of votes in many electoral dis-
tricts, and this translated into a disproportionate number of seats for the
party. In the end, the Conservatives won a majority of seats in the House of
Commons, while capturing a minority of the popular vote (table ). is
is not at all an unusual result in Canadian elections at either the national
or provincial level. Majority governments are almost never formed by
parties that win more than % of the popular vote in Canada. But the
electoral dynamic of Canadian parliamentary democracy has implications

Chapter 13: Prospects for reform in Canada 205
www.fraserinstitute.org | Fraser Institute
for radical policy innovation when an election becomes a referendum on
a single issue. e single-member, simple-plurality electoral system made
it possible for the Conservatives to achieve enough seats in Parliament to
legislate a free trade policy into action, even when it was not supported by
most of the public at the time. e executive-centered nature of Canadian
parliamentary democracy (Savoie, ) subsequently made it possible
for the governing party to ensure passage of the controversial piece of
legislation enshrining the policy. is electoral dynamic could allow an
enlightened federal government to repeal the provisions of the Canada
Health Act that are barriers to health policy liberalization in the prov-
inces. Alternatively, reform-minded federal governments might choose
simply not to enforce the provisions of the CHA, but this would make for
an unpredictable policy environment which could reduce the expected
benefits that could be achieved by more explicit liberalization of health
policy in Canada.
Table : Canadian national general election results
Political party Elected
members
Number of
valid votes
Percentage of
popular vote
Progressive Conservative 169 5,667,563 43%
Liberal 83 4,205,072 31%
New Democratic 43 2,685,308 20%
Other 0 719,841 4%
Social Credit 0 3,407 0%
Total 295 13,281,191 100%
Source: Library of Parliament, 2007.
www.fraserinstitute.org | Fraser Institute
References and resources
Adams, Christopher P., and Van V. Brantner (). New Drug
Development: Estimating Entry from Human Clinical Trials. FTC
Working Paper No. . Federal Trade Commission.
Adams, Christopher P., and Van V. Brantner (). Estimating the
Cost of New Drug Development: Is It Really $ Million? Health
Affairs , : –.
Adams, Duane (). Conclusions: Proposals for Advancing
Federalism, Democracy and Governance of the Canadian Health
System. In Duane Adams (ed.), Federalism, Democracy and Health
Policy in Canada (McGill-Queen’s University Press): –.
Adams, T., and I.L. Bourgeault (). Feminism and Female Health
Professions. Women’s Health , : –.
Alford, R. (). Health Care Politics: Normative and Interest Group
Barriers to Reform. University of Chicago Press.
Anderson, G.F., B.K. Frogner, and U.E. Reinhardt (). Health
Spending in OECD Countries in : An Update. Health Affairs , :
,–.
Angell, Marcia (). Excess in the Pharmaceutical Industry.
Canadian Medical Association Journal , (December): ,–.
208 Canadian Health Policy Failures
Fraser Institute | www.fraserinstitute.org
Anis, Aslam (). Pharmaceutical Policies in Canada: Another
Example of Federal-Provincial Discord. Canadian Medical Association
Journal , : –.
Armstrong, Pat (). Privatizing Care. In P. Armstrong et al., Medical
Alert: New Work Organizations in Health Care. Garamond Press.
Armstrong, Pat, and Hugh Armstrong (). Wasting Away: e
Undermining of Canadian Health Care. Oxford University Press.
Arrow, J.A. (). Uncertainty and the Welfare Economics of Medical
Care. American Economic Review , : –.
Association of Canadian Medical Colleges [ACMC] (). Canadian
Medical Education Statistics.
Attaran, A., and Lee Gillespie-White (). Do Patents for
Antiretroviral Drugs Constrain Access to AIDS Treatment in Africa?
Journal of the American Medical Association , : ,–.
Attaran, Amir (). How Do Patents and Economic Policies Affect
Access to Essential Medicines in Developing Countries? Health Affairs
, : –.
Avery, Roberta (, March ). MD Rejects Woman, . Toronto Star.
Badgely, Robin F., and Samuel Wolfe (). Doctors’ Strike: Medical
Care and Conflict in Saskatchewan. Macmillan Press.
Banting, Keith, and Stan Corbett (). Health Policy and Federalism:
An Introduction. In Keith G. Banting and Stan Corbett (eds.), Health
Policy and Federalism: A Comparative Perspective on Multi-Level
Governance (McGill-Queen’s University Press): –.
References and resources 209
www.fraserinstitute.org | Fraser Institute
Barer, Morris L., V. Bhatia, G.L. Stoddart, and R.G. Evans ().
e Remarkable Tenacity of User Charges: A Concise History of the
Participation, Positions, and Rationales of Canadian Interest Groups in
the Debate over Direct Patient Participation in Health Care Financing.
Centre for Health Services and Policy Research, University of British
Columbia.
Barer, Morris L., R.G. Evans, and G.L. Stoddart (). Controlling
Health Care Costs by Direct Charges to Patients: Snare or Delusion?
Occasional Paper No. . Ontario Economic Council.
Barer, Morris L., K.M. McGrail, K. Cardiff, L. Wood, and C.J. Green
(). Tales from the Other Drug Wars. In Barer, Morris L., K.M.
McGrail, K. Cardiff, L. Wood, and C.J. Green (eds.), Tales from
the Other Drug Wars: Papers from the 12th Annual Health Policy
Conference [Nov. , ]. Centre for Health Services and Policy
Research, University of British Columbia..
Barer, Morris L., and G.L. Stoddart (). Toward Integrated Medical
Resource Policies for Canada. Centre for Health Services and Policy
Research, University of British Columbia.
Barlow, Maude (). Profit Is Not the Cure. Council of Canadians.
Bator, Francis M. (). e Anatomy of Market Failure. Quarterly
Journal of Economics (August): –.
Baumol, William J. (). Welfare Economics and the eory of the
State. London School of Economics and Political Science; Longmans,
Green and Co.
BlueCross BlueShield Association [BCBS] (). e Uninsured in
America. BCBS.
210 Canadian Health Policy Failures
Fraser Institute | www.fraserinstitute.org
Beck, R.G., and J.M. Horne (). Utilization of Publicly Insured
Health Services in Saskatchewan Before, During and After Copayment.
Medical Care , : –.
Becker, Gary S. (). A eory of Competition among Pressure
Groups for Political Influence. Quarterly Journal of Economics
(August): –.
Becker, Gary S. (). Public Policies, Pressure Groups, and
Deadweight Costs. Journal of Public Economics : –.
Béland, François (). Arithmetic Failure and the Myth of the
Unsustainability of Universal Health Insurance. Canadian Medical
Association Journal , : –.
Benady, S. (). Quebec Gov’t Approach reatening: Physicians Will
Leave Province if ‘Force’ Continues: FMQQ. e Medical Post ,
(October).
Bermingham, John (, June ). -Hour Hospital Admission Wait
Means System’s Working: Minister. e Province.
Berndt, Ernst R., Iain M. Cockburn, and Karen A. Grepin ().
e Impact of Incremental Innovation in Biopharmaceuticals:
Drug Utilisation in Original and Supplemental Indications.
Pharmacoeconomics , (December): –.
Bhatia, V., and W.D. Coleman (). Ideas and Discourse: Reform and
Resistance in the Canadian and German Health Systems. Canadian
Journal of Political Science , : –. Canadian Political Science
Association.
Blackwell, Tom (, August ). MD Uses Lottery to Cull Patients.
National Post: A.
References and resources 211
www.fraserinstitute.org | Fraser Institute
Blatchford, Christie (, April ). How Health Care’s Red Tape
Snarled a Suffering Woman. Globe and Mail.
Blendon, R.J., M. Kim, and J.M. Benson (). e Public Versus the
World Health Organization on Health System Performance. Health
Affairs , : –.
Blendon, Robert J., Cathy Schoen, Karen Donelan, Robin Osborn,
Catherine M. DesRoches, Kimberly Scoles, Karen Davis, Katherine
Binns, and Kinga Zapert (). Physicians’ Views on Quality of Care:
A Five-Country Comparison. Health Affairs , : –.
Blomqvist, Ake (). e Health Care Business: International
Evidence on Private Versus Public Health Care Systems. Fraser Institute.
Blomqvist, Ake (a). Introduction: Economic Issues in Canadian
Health Care. In Ake Blomqvist and David M. Brown (eds.), Limits to
Care: Reforming Canada’s Health System in an Age of Restraint (C.D.
Howe Institute): –.
Blomqvist, Ake (b). Conclusion: emes in Health Care Reform. In
Ake Blomqvist and David M. Brown (eds.), Limits to Care: Reforming
Canada’s Health System in an Age of Restraint (C.D. Howe Institute):
–.
Blouin, Chantal, John Foster, and Ronald Labonte (). Canada’s
Foreign Policy and Health: Toward Policy Coherence. North-South
Institute.
<http://www.nsi-ins.ca/english/pdf/foreign_policy_health.pdf>,
as of May , .
Boase, Joan Price (). Shifting Sands: Government-Group
Relationships in the Health Care Sector. McGill-Queen’s University Press.
212 Canadian Health Policy Failures
Fraser Institute | www.fraserinstitute.org
Boase, Joan Price (). Federalism and the Health Facility Fees
Challenge. In Duane Adams (ed.), Federalism, Democracy and Health
Policy in Canada. McGill-Queen’s University Press.
Boldrin, Michele, and David K. Levine (). Rent-Seeking and
Innovation. Journal of Monetary Economics , (January): –.
Boston Consulting Group (). Sustaining Innovation in US
Pharmaceuticals: Intellectual Property and the Role of Patent. Boston.
Bourgeault, I.L., and J. Angus (). Pay and Human Resource
Management in Nursing and Medicine: An Examination of Gendered
Structural Relations Between the Professions and the State. Health and
Canadian Society , : –.
Boychuk, Gerard W. (). e Changing Political and Economic
Environment of Health Care in Canada. Discussion Paper No. .
Commission on the Future of Health care in Canada.
Boychuk, Gerard W. (). e Regulation of Private Health
Funding and Insurance in Alberta Under the Canada Health Act: A
Comparative Cross-Provincial Perspective. SPS Research Papers: e
Health Series , (December). University of Calgary, School of Policy
Studies.
Braen, Andre (). Health and the Distribution of Powers in Canada.
Discussion Paper No. . Commission on the Future of Health Care in
Canada.
Bridge, Kieran (). e Canada Health Act: Myths and Realities.
Health Frontiers . Canadian Independent Medical Clinics Association
[CIMCA].
References and resources 213
www.fraserinstitute.org | Fraser Institute
Brimacombe, Glenn G. et al. (). e Future Cost of Health Care
in Canada, 2000–2020: Balancing Affordability and Sustainability.
Conference Board of Canada.
Brogan Inc. (). Special Data Request, iMAM database. Contact:
Arash Azarbar, Business Analyst/Client Support.
Brousselle, Astrid (). Controlling Health Expenditures: What
Matters. In Canada Health Action: Building on the Legacy. Papers
Commissioned by the National Forum on Health. Volume . Striking a
Balance: Health Care Systems in Canada and Elsewhere: –.
Buchanan, A. (). Privatization and Just Health Care. Bioethics , :
–.
Buchanan, James M. (). e Inconsistencies of the National
Health Service: A Study in the Conflict Between Individual Demand
and Collective Supply. Occasional Paper (November). e Institute of
Economic Affairs Limited.
Buchanan, James M., and Gordon Tullock (). e Calculus of
Consent: Logical Foundations of Constitutional Democracy. University
of Michigan Press.
Buchanan, Joan L., E.B. Keeler, J.E. Rolph, and M.R. Holmer ().
Simulating Health Expenditures Under Alternative Insurance Plans.
Management Science , : ,–.
Bueckert, Dennis (, February ). Quebec Accuses Generic Drug
Makers of Illicit Kickbacks to Druggists. Canadian Press.
Bueckert, Dennis (, July ). Ontario to Buy Private Clinics.
Canadian Press.
214 Canadian Health Policy Failures
Fraser Institute | www.fraserinstitute.org
Bueckert, Dennis (, September ). Ontario to Open Nine New
MRI Sites, Buy Back more Private Testing Facilities. Canadian Press.
Bueckert, Dennis (, May ). Chretien’s Plan to Deliver Cheap
Medicines for Africa Stuck in Uncertainty. Canadian Press.
Burke, Mike, and H. Michael Stevenson (). Fiscal Crisis and
Restructuring in Medicare: e Politics of Health in Canada. In
David Coburn, Carl D’Arcy, and George M. Torrance (eds.), Health
and Canadian Society: Sociological Perspectives (rd ed., University of
Toronto Press): –.
Cameron, David, and Megan Evans (). Alberta Resident Brings
Class Action Law Suit to Challenge Prohibition on Private Health care
Insurance.
<http://casselsbrock.com/publicationdetail.asp?aid=1165>, as of
May , .
Canada, Competition Bureau (). Canadian Generic Drug Sector
Study.
<http://www.competitionbureau.gc.ca/epic/site/cb-bc.nsf/
en/02495e.html>, as of June , .
Canada Health Act [CHA] (R.S., , c. C-).
<http://laws.justice.gc.ca/en/showtdm/cs/C-6>, as of September , .
Canadian Agency for Drugs and Technologies in Health [CADTH]
(). Procedure for Common Drug Review.
<http://cadth.ca/media/cdr/
process/CDR_Procedure_April%202008.pdf>, as of February , .
Canadian Broadcasting Corporation [CBC] (, February ). Heart
Death Triggers ER Investigation. CBC News.
<http://www.cbc.ca/
canada/britishcolumbia/story/2004/02/27/bc_rch20040227.html>, as of
Sept. ,
References and resources 215
www.fraserinstitute.org | Fraser Institute
Canadian Constitution Foundation [CCF] (). Ontario’s Health
Care Monopoly Challenged in Court: Brain Cancer Would Have Killed
Lindsay McCreith.
<http://www.canadianconstitutionfoundation.ca/files/
pdf/newsrelease-05-02-2007.pdf>, as of June , .
Canadian Generic Pharmaceutical Association [CGPA] ().
Getting to Market in the Generic Pharmaceutical Industry.
<http://www.canadiangenerics.ca/en/advocacy/generic_market.asp>,
as of May , .
Canadian Institute for Health Information [CIHI] (a). Medical
Imaging in Canada 2005.
Canadian Institute for Health Information [CIHI] (b). Table B.3.1:
Public Sector Health Expenditure, by Province/ Territory and Canada,
1975 to 2005—Current Dollars.
Canadian Institute for Health Information [CIHI] (a). Supply,
Distribution, and Migration of Canadian Physicians, 1961–2005.
Canadian Institute for Health Information [CIHI] (b). Medical
Imaging Technologies in Canada, 2006 – Supply, Utilization, and
Sources of Operating Funds.
Canadian Institute for Health Information [CIHI] (c). National
Survey of Selected Medical Imaging Equipment, 2006.
Canadian Institute for Health Information [CIHI] (d). Waiting for
Health Care in Canada: What We Know and What We Don’t Know.
Canadian Institute for Health Information [CIHI] (a).
Understanding Emergency Department Wait-times: How Long Do
People Spend in Emergency Departments in Ontario?
216 Canadian Health Policy Failures
Fraser Institute | www.fraserinstitute.org
Canadian Institute for Health Information [CIHI] (b). National
Health Expenditure Trends, 1975–2007.
Canadian Institute for Health Information [CIHI] (c). Trends in
Acute Inpatient Hospitalizations and Day Surgery Visits in Canada,
1995–1996 to 2005–2006.
Canadian Institute for Health Information [CIHI] (a). National
Health Expenditure Trends, 1975–2008.
Canadian Institute for Health Information [CIHI] (b). Drug
Expenditure in Canada, 1985–2007.
Canadian Press (, February ). Quebec Targets Generic Drug
Makers. Globe and Mail online.
Canadian Press (, October ). New Calgary Hospital Miscarriage
Raises Concerns. CTV.
<http://www.ctv.ca/servlet/ArticleNews/story/
CTVNews/20061004/calgary_miscarriages_061004/20061004?hub=Canada>,
as of Sept. , .
Canadian Press (, April ). Charges Laid, Legal Action Taken in
Ontario Drug Resale Scheme. Canadian Press.
Canadian Press (, May ). Health Minister to End Hiring Freeze
Friday. Hamilton Spectator online.
Canadian Resident Matching Service [CARMS] (). Operations:
Reports and Statistics—R-1 Match Reports—2006. Table : Discipline
Choices of Canadian Applicants Match First Iteration.
Carroll, R.J. et al. (). International Comparison of Waiting Times
for Selected Cardiovascular Procedures. Journal of the American
College of Cardiology (March): –.
References and resources 217
www.fraserinstitute.org | Fraser Institute
Cassels, Alan (). Peddling Paranoia. New Internationalist
(November): .
Caswell, Mike (, December ). Canada’s Public Health Facing Trial
by YouTube. Street Wire.
Center for Drug Evaluation and Research [CDER] (). CDER
Update 2007 Drug Review. US FDA, Department of Health and Human
Services, Center for Drug Evaluation and Research.
Centre for International Statistics (). Health Spending and Health
Status: An International Comparison. In Canada Health Action:
Building on the Legacy. Papers Commissioned by the National Forum
on Health. Volume . Striking a Balance: Health Care Systems in
Canada and Elsewhere (National Forum on Health; Health Canada;
Canadian Government Publishing, Public Works and Government
Services Canada; Éditions MultiMondes): -.
Chan, Benjamin T.B. (). From Perceived Surplus to Perceived
Shortage: What Happened to Canada’s Physician Workforce in the
1990s? Canadian Institute for Health Information.
Chaoulli v. Quebec (Attorney General), [] S.C.R. , SCC .
Chernichovsky, D. (). Health System Reforms in Industrialized
Democracies: An Emerging Paradigm. e Milbank Quarterly , .
Clair, M. (). Emerging Solutions. Commission d’Étude sur les
Services de Santé et les Services Sociaux.
Coburn, David (). State Authority, Medical Dominance, and
Trends in the Regulation of the Health Professions: e Ontario Case.
In David Coburn, Carl D’Arcy, and George M. Torrance (eds.), Health
and Canadian Society: Sociology Perspectives (rd ed., University of
Toronto Press): –.
218 Canadian Health Policy Failures
Fraser Institute | www.fraserinstitute.org
Coburn, David (). Phases of Capitalism, Welfare States, Medical
Dominance, and Health Care in Ontario. International Journal of
Health Services , : –.
Coburn, David (). Income Inequality, Social Cohesion and the
Health Status of Populations: e Role of Neo-liberalism. Social
Sciences and Medicine , : –.
Coburn, David, Carl D’Arcy, and George M. Torrance (). Health
and Canadian Society: Sociology Perspectives (rd ed.). University of
Toronto Press.
Coburn, David, S. Rappolt, I.L. Bourgeault, and J. Angus ().
Medicine, Nursing and the State. Garamond Press.
Coleman, William D. (). e Political Organization of Business
Interests in the Canadian Industrial Chemicals and Pharmaceutical
Industries. International Institute of Management; McMaster
University.
Coleman, William D., and Grace Skogstad (). Policy Communities
and Public Policy in Canada: A Structural Approach. Copp Clark Pitman.
Collins-Nakai, R.L., H.A. Huysmans, and H.E. Skully (). Task
Force : Access to Cardiovascular Care: An International Comparison.
Journal of the American College of Cardiology : ,–.
Contandriopoulos, Damien (). How Canada’s Health Care System
Compares with that of Other Countries: An Overview. In Canada
Health Action: Building on the Legacy. Papers Commissioned by the
National Forum on Health. Volume . Striking a Balance: Health
Care Systems in Canada and Elsewhere (National Forum on Health;
Health Canada; Canadian Government Publishing, Public Works and
Government Services Canada; Éditions MultiMondes): –.
References and resources 219
www.fraserinstitute.org | Fraser Institute
Cowan, Pamela (, October ). Long Road to Cancer Diagnosis.
Regina Leader-Post.
<http://www.canada.com/reginaleaderpost/story.
html?id=becfbdbe-9767-4118-84a3-228309ad3f4f>, as of Sept. , .
Coyte, P.C., et al. (). Waiting Times for Knee Replacement Surgery
in the United States and Ontario. New England Journal of Medicine ,
(October): ,–.
Crémieux, Pierre-Yves, and Pierre Ouellette (). e Value of
Pharmaceuticals in Canada. Université du Québec à Montréal and
Analysis Group Economics.
Crémieux, Pierre-Yves, Marie-Claude Meilleur, Pierre Ouellette,
Patrick Petit, Martin Zelder, and Ken Potvin (). Public and Private
Pharmaceutical Spending as Determinants of Health Outcomes in
Canada. Health Economics , : –.
Crowley, Brian Lee, Brian Ferguson, David Zitner, and Brett J.
Skinner (). Definitely Not the Romanow Report: Achieving Equity,
Sustainability, Accountability and Consumer Empowerment in
Canadian Health Care. Atlantic Institute for Market Studies [AIMS].
CTV News (, September ). US Mobile Ultrasound Clinic Banned
in Ontario.
D’Cruz, J.R., W. Hejazi, and G. Fleischmann (). Comparisons of
Retail Prices of Generic Prescription Drugs in Canada vs. United States:
A Comprehensive Study. A Report Prepared for the Canadian Generic
Pharmaceutical Association. University of Toronto, Rotman School of
Business.
Danzon, Patricia M. (). Health Care Industry. In David R. Henderson
(ed.), e Fortune Encyclopaedia of Economics. Warner Books.
220 Canadian Health Policy Failures
Fraser Institute | www.fraserinstitute.org
Danzon, Patricia M., and Li-Wei Chao (). Cross-National Price
Differences for Pharmaceuticals: How Large and Why? Journal of
Health Economics , : –.
Danzon, Patricia M., and Michael F. Furukawa (). Prices and
Availability of Pharmaceuticals: Evidence from Nine Countries. Health
Affairs—Web Exclusive (October , ) web pages W-–W-.
<www.healthaffairs.org>.
Danzon, Patricia M., and Michael F. Furukawa (). Prices and
Availability of Biopharmaceuticals: An International Comparison.
Health Affairs , : ,–.
Danzon, Patricia M., and Jeong D. Kim (). International Price
Comparisons for Pharmaceuticals: Measurement and Policy Issues.
Pharmacoeconomics , : –.
Davis, Karen, Cathy Schoen, Stephen C. Schoenbaum, Michelle
M. Doty, Alyssa L. Holmgren, Jennifer L. Kriss, and Katherine K.
Shea (). Mirror, Mirror On e Wall: An International Update
On e Comparative Performance Of American Health Care. e
Commonwealth Fund.
Deber, Raisa B. (). Quality of Care in For-Profit Hospitals.
Canadian Medical Association Journal , : .
Deber, Raisa, Lutchmie Narine, Pat Baranek, Natasha Sharpe, Katya
Masnyk Duvalko, Randi Zlotnik-Shaul, Peter Coyte, George Pink,
and Paul Williams (). e Public-Private Mix in Health Care. In
Canada Health Action: Building on the Legacy. Papers Commissioned
by the National Forum on Health. Volume . Striking a Balance: Health
Care Systems in Canada and Elsewhere (National Forum on Health;
Health Canada; Canadian Government Publishing, Public Works and
Government Services Canada; Éditions MultiMondes): –.
References and resources 221
www.fraserinstitute.org | Fraser Institute
Deber, Raisa, and Bill Swan (). Puzzling Issues in Health
Care Financing. In Canada Health Action: Building on the Legacy.
Papers Commissioned by the National Forum on Health. Volume .
Striking a Balance: Health Care Systems in Canada and Elsewhere
(National Forum on Health; Health Canada; Canadian Government
Publishing, Public Works and Government Services Canada; Éditions
MultiMondes): –.
DeNavas-Walt, Carmen, Bernadette D. Proctor, and Jessica Smith
(). Income, Poverty, and Health Insurance Coverage in the United
States: 2007. US Department of Commerce, US Census Bureau
publication P- (August ).
Devereaux, P.J., Peter T.L. Choi, Christina Lacchetti, Bruce Weaver,
Holger J. Schunemann, Ted Haines, John N. Lavis, Brydon J.B. Grant,
David R.S. Haslam, Mohit Bhandari, Terrence Sullivan, Deborah
J. Cook, Stephen D. Walter, Maureen Meade, Humaira Khan, Neera
Bhatnagar, and Gordon H. Guyatt (). A Systematic Review and
Meta-Analysis of Studies Comparing Mortality Rates of Private
For-Profit and Private Not-For-Profit Hospitals. Canadian Medical
Association Journal , : ,–.
Devereaux, P.J., Diane Heels-Ansdell, Christina Lacchetti, Ted Haines,
Karen E.A. Burns, Deborah J. Cook, Nikila Ravindran, S.D. Walter,
Heather McDonald, Samuel B. Stone, Rakesh Patel, Mohit Bhandari,
Holger J. Schunemann, Peter T.L. Choi, Ahmed M Bayoumi, John N.
Lavis, Terrence Sullivan, Greg Stoddart, and Gordon H. Guyatt ().
Payments for Care at Private For-Profit and Private Not-For-Profit
Hospitals: A Systematic Review and Meta-Analysis. Canadian Medical
Association Journal , : ,–.
Dhalla, Irfan (). Canada’s Health Care System and the Sustainability
Paradox. Canadian Medical Association Journal , : –.
222 Canadian Health Policy Failures
Fraser Institute | www.fraserinstitute.org
DiMasi, J.A. (). Risks in New Drug Development: Approval
Success Rates for Investigational Drugs. Clinical Pharmacology and
erapeutics : –.
DiMasi, J.A. et al. (). Research and Development Costs for New
Drugs by erapeutic Category: A Study of the US Pharmaceutical
Industry. PharmacoEconomics , : –.
DiMasi, J.A., R.W. Hansen, and H.G. Grabowski (). e Price of
Innovation: New Estimates of Drug Development Costs. Journal of
Health Economics , : –.
Di Matteo, Livio, and Rosanne Di Matteo (). e Fiscal
Sustainability of Alberta’s Public Health Care System. SPP Research
Papers: e Health Series , (April). University of Calgary School of
Public Policy.
Donaldson, C., and G. Currie (). e Public Purchase of Private
Surgical Services: A Systematic Review of the Evidence on Efficiency and
Equity. Working Paper -. Institute of Health Economics.
Dranove, David, and Michael L. Millenson (, February ).
Medical Bankruptcy: Myth Versus Fact. Health Affairs—Web Exclusive.
<http://content.healthaffairs.org/cgi/content/abstract/25/2/w74>, as of
Sept. , .
Duggan, Mark G. (). Hospital Ownership and Public Medical
Spending. Quarterly Journal of Economics , : ,–.
Duggan, Mark G. (). Do New Prescription Drugs Pay for
emselves? e Case of Second-Generation Antipsychotics. Journal of
Health Economics , : –.
References and resources 223
www.fraserinstitute.org | Fraser Institute
Dunleavy, Patrick (). Democracy, Bureaucracy and Rational
Choice (aka Public Choice): Economic Explanations in Political Science.
Harvester.
Einhorn, Jessica (). e World Bank’s Mission Creep. Foreign
Affairs , : –.
Enthoven, Alain C., and Wynand P.M.M. Van De Ven (). Going
Dutch: Managed-Competition Health Insurance in the Netherlands.
e New England Journal of Medicine , : ,–.
Environics Research Group (). e National Pulse on Health
Strategy. October .
Eriksson, P., V. Diwan, and I. Karlberg (). Health Sector Reforms:
What About Hospitals? Nordic School of Public Health.
Esmail, Nadeem (). Hitting the Health Care Wall. Fraser Forum
(July): –. Fraser Institute
Esmail, Nadeem (). Canada’s Physician Shortage: Effects,
Projections, and Solutions. Fraser Institute.
Esmail, Nadeem, Jason Clemens, Niels Veldhuis, and Milagros Palacios
(). Federal Health Transfers to the Provinces: Expensive and
Ineffective. Fraser Alert (March). Fraser Institute.
Esmail, Nadeem, Maureen Hazel, and Michael Walker (). Waiting
Your Turn: Hospital Waiting Lists in Canada, 2008 Report (th ed.)
Fraser Institute.
Esmail, Nadeem, and Milagros Palacios (). How Much Do We
Really Pay? e Price of Public Health Insurance. Fraser Forum
(September): –. Fraser Institute.
224 Canadian Health Policy Failures
Fraser Institute | www.fraserinstitute.org
Esmail, Nadeem, and Michael Walker (). How Good is Canadian
Health care? 2008 Report: An International Comparison of Health Care
Systems. Fraser Institute.
Esmail, Nadeem, and Dominika Wrona (). Medical Technology in
Canada. Studies in Health Care Policy. Fraser Institute.
European Medicines Agency [EMEA] (). Annual Report of the
European Medicines Agency 2007. European Medicines Agency.
<http://www.emea.europa.eu/pdfs/general/direct/emeaar/AnnualReport2007.pdf>
,
as of June , .
European Observatory on Health Care Systems (). Health Care
Systems in Transition: Switzerland. WHO Regional Office for Europe;
Government of Norway; Government of Spain; European Investment
Bank; World Bank; London School of Economics and Political
Science; London School of Hygiene and Tropical Medicine. European
Observatory on Health Care Systems.
Evans, Robert G. (). Strained Mercy. Butterworths.
Evans, Robert G. (a). Going for the Gold: e Redistributive
Agenda behind Market-Based Health Care Reform. Journal of Health
Politics, Policy and Law , : –.
Evans, Robert G. (b). Coarse Correction And Way Off Target.
Journal of Health Politics, Policy and Law , : –.
Evans, Robert G. (). Uses and Abuses of Research and the Research
Process. In M.L. Barer, K.M. McGrail et al. (eds.), Tales From the Other
Drug Wars (Centre for Health Services and Policy Research, University
of British Columbia): –.
References and resources 225
www.fraserinstitute.org | Fraser Institute
Evans, Robert G. (a). Financing Health Care: Taxation and the
Alternatives. In Elias Mossialos, Anna Dixon, Josep Figueras, and Joe
Kutzin (eds.), Funding Health Care: Options for Europe (European
Observatory on Health Care Systems: World Health Organization): –.
Evans, Robert G. (b). Raising the Money: Options, Consequences,
and Objectives for Financing Health Care in Canada. Discussion
Paper No. . Commission on the Future of Health Care in Canada.
Government of Canada.
Evans, Robert G. (). Political Wolves and Economic Sheep: e
Sustainability of Public Health Insurance in Canada. Working Paper
CHSPR : W. Centre for Health Services and Policy Research,
University of British Columbia.
Evans, Robert G. (a). Preserving Privilege, Promoting Profit: e
Payoffs from Private Health Insurance. In Colleen M. Flood, Kent
Roach, and Lorne Sossin (eds.), Access to Care, Access to Justice: e
Legal Debate Over Private Health Insurance in Canada (University of
Toronto Press): –.
Evans, Robert G. (b). Devil Take the Hindmost? Private Health
Insurance and the Rising Costs of American ‘Exceptionalism.’ Draft
Working Paper. University of British Columbia, Centre for Health
Services and Policy Research.
Evans, Robert G. (). Toward a National Pharmaceuticals Strategy:
A Summary of the 2006 Health Policy Conference of the UBC Centre
for Health Services and Policy Research. Centre for Health Services and
Policy Research, University of British Columbia.
Evans, Robert G., J. Lomas, M.L. Barer, R.J. Labelle, C. Fooks, G.L.
Stoddart, G.M. Anderson, D. Feeny, A. Gafni, G.W. Torrance et al.
(). Controlling Health Expenditures—e Canadian Reality. New
England Journal of Medicine , : –.
226 Canadian Health Policy Failures
Fraser Institute | www.fraserinstitute.org
Evans, Robert G., M.L. Barer, and T.R. Marmor (eds.) (). Why Are
Some People Healthy and Others Not? e Determinants of Health of
Populations. Aldine DeGruyter.
Feldman, Roger, Carlos Escribano, and Laura Pellise (). e Role
of Government in Health Insurance Markets with Adverse Selection.
Health Economics , : –.
Feldstein, Martin S. (). e Welfare Loss of Excess Health
Insurance. e Journal of Political Economy , : –.
Feldstein, Martin S. (). Rethinking Social Insurance. American
Economic Review ,: –.
Ferguson, Brian S. (a). Expenditures on Medical Care in Canada:
Looking at the Numbers. Atlantic Institute for Market Studies (AIMS).
Ferguson, Brian S. (b). Profits and the Hospital Sector: What Does
the Literature Really Say? Atlantic Institute for Market Studies (AIMS).
Ferguson, Brian S. (c). Doctors Have to Make a Living Too: e
Microeconomics of Physician Practice. Atlantic Institute for Market
Studies (AIMS).
Fidelman, Charlie (, March ). Cancer Drug Has OK—It Just Isn’t
Available; Quebec May Pay for It; Other Provinces Are Withholding
Funds. Montreal Gazette.
Fierlbeck, Katherine (). Cost Containment in Health Care: e
Federalism Context. In Duane Adams, (ed.), Federalism, Democracy,
and Health Policy in Canada (Social Union Series; Institute of
Intergovernmental Relations, School of Policy Studies, Queen’s
University): –.
References and resources 227
www.fraserinstitute.org | Fraser Institute
Flood, Colleen M., and Tom Archibald (). e Illegality of Private
Health Care in Canada. Canadian Medical Association Journal , :
–.
Forget, C. (). Comprehensiveness in Public Health Care: An
Impediment to Effective Restructuring. Policy Matters : .
Fournier, Marc-Andre (). e Impact of Health Care
Infrastructures and Human Resources on Health Expenditures. In
Canada Health Action: Building on the Legacy. Papers Commissioned
by the National Forum on Health. Volume . Striking a Balance: Health
Care Systems in Canada and Elsewhere (National Forum on Health;
Health Canada; Canadian Government Publishing, Public Works and
Government Services Canada; Éditions MultiMondes): –.
Frank, Richard, and Karine Lamiraud (). Choice, Price Competition,
and Complexity in Markets for Health Insurance. NBER Working Paper
. National Bureau of Economic Research.
Frech, H.E. III (). Physician Fees and Price Controls. In Roger D.
Feldman (ed.), American Health Care: Government, Market Processes,
and the Public Interest (e Independent Institute): –.
Frech, H.E. III, and Richard D. Miller Jr. (). e Productivity of
Health Care and Pharmaceuticals. American Enterprise Institute for
Public Policy Research.
Friedman, Milton (). Capitalism and Freedom. University of
Chicago Press.
Fyke, K.J. (). Caring for Medicare: Sustaining a Quality System.
Saskatchewan Commission on Medicare.
228 Canadian Health Policy Failures
Fraser Institute | www.fraserinstitute.org
Gaebel, K., N. Toeg, and M. Levine (). Clinical and Economic
Effects of a erapeutic Substitution Policy for Proton Pump Inhibitors
in Aboriginal Patients in Northern Communities in Canada’s
Northwest Territories. Disease Management and Health Outcomes
, : –.
Gannon, Nathan, Karen Sheng, and Delal Ismail (). Price Controls
on U.S. Pharmaceuticals: Is this Good Public Policy? e Heinz Journal
, (October).
Gaynor, Martin, and William B. Vogt (). What Does Economics
Have to Say about Health Policy Anyway? A Comment and Correction
on Evans and Rice. Commentary. Journal of Health Politics, Policy and
Law , : –.
Gerdtham, U.G., and B. Jönsson (). International Comparisons of
Health Expenditure. In A.J. Culyer and J.P. Newhouse (eds.), Handbook
of Health Economics. Elsevier.
Giaccotta, Carmelo, Rexford E. Santerre, and John A. Vernon ().
Drug Prices and Research and Development Investment Behavior in
the Pharmaceutical Industry. Journal of Law and Economics XL, VIII
(April): –.
Giorno, Guy W. (). Private Health Insurance for Medically
Necessary Services: Comment on Chaoulli v. Quebec (Attorney
General), SCC , () S.C.J. No. . Fasken Martineau
DuMoulin LLP (June , ). An edited version of this commentary
appeared in the Globe and Mail, June , , p. A, beneath the
headline “Supreme Court or no Supreme Court, the Canada Health Act
is not what’s stopping private health insurance.”
Glied, Sherry A., Jacob Hartz, and Genessa Giorgi (). Consider It
Done? e Likely Efficacy of Mandates for Health Insurance. Health
Affairs , : ,–.
References and resources 229
www.fraserinstitute.org | Fraser Institute
Gooi, Malcolm, and Chaim Bell (). Differences in Generic Drug
Prices Between the US and Canada. Applied Health Economics and
Health Policy , : –.
Gorecki, Paul K., and Ida Henderson (). Compulsory Patent
Licensing of Drugs in Canada: A Comment on the Debate. Canadian
Public Policy , : –.
Grabowski, H.G., and J.M. Vernon (). e Regulation of
Pharmaceuticals, Balancing the Benefits and Risks. American
Enterprise Institute for Public Policy Research.
Grabowski, H.G., and J.M. Vernon (). Returns to R&D on New
Drug Introductions in the s. Journal of Health Economics , :
–.
Grabowski, H.G., J. Vernon, and J.A. DiMasi (). Returns on
Research and Development for s New Drug Introductions.
PharmacoEconomics , : –.
Graham, John R. (). Prescription Drug Prices in Canada and the
United States—Part 2: Why the Difference? Public Policy Sources .
Fraser Institute.
Graham, John R. (). e Fantasy of Reference Pricing and the
Promise of Choice in B.C. Pharmacare. Public Policy Sources . Fraser
Institute.
Graham, John R. (). A Lethal Guardian: e Canadian
Government’s Ban on Prescription Drugs. Fraser Institute.
Graham, John R. (). California’s Uninsured: Crisis, Conundrum, or
Chronic Condition? Pacific Research Institute.
230 Canadian Health Policy Failures
Fraser Institute | www.fraserinstitute.org
Graham, John R., and B.A. Robson (). Prescription Drug Prices in
Canada and the United States—Part 1: A Comparative Survey. Public
Policy Sources . Fraser Institute.
Graham, John R., and Tanya Tabler (). Canadian Pharmacare:
Performance, Incentives, and Insurance. Fraser Institute.
Gratzer, David (). Code Blue: Reviving Canada’s Health Care
System. ECW Press.
Gratzer, David (). Better Medicine: Reforming Canadian Health
Care. ECW Press.
Gratzer, David, and Neil Seeman (). Mortality Rates Don’t Tell the
Whole Story. National Post (June ): PA.
Gray, C. (). How Bad is the Brain Drain? Canadian Medical
Association Journal : –.
Gray, John (ed.) (). John Stuart Mill: On Liberty and Other Essays.
Oxford University Press.
Gruber, Jonathan (). Covering the Uninsured in the United States.
Journal of Economic Literature , : –.
Guyatt, Gordon, Armine Yalnizyan, and P.J. Devereaux (). Solving
the Public Health Care Sustainability Puzzle. Canadian Medical
Association Journal , : –.
Guyatt, Gordon H., P.J. Devereaux, Joel Lexchin, Samuel B. Stone,
Armine Yalnizyan, David Himmelstein, Steffie Woolhandler, Qi Zhou,
Laurie J. Goldsmith, Deborah J. Cook, Ted Haines, Christina Lacchetti,
John N. Lavis, Terrence Sullivan, Ed Mills, Shelley Kraus, and Neera
Bhatnagar (). A Systematic Review of Studies Comparing Health
Outcomes in Canada and the United States. Open Medicine , : E–.
References and resources 231
www.fraserinstitute.org | Fraser Institute
Han, D., and E.C.Y. Wang (). e Value of Medicines in Canada.
Canadian Journal of Clinical Pharmacology , : –.
Hastings, John, and Elizabeth J. Adams (). Joint Project of the
International network of Agencies for Health Technology Assessment
– Part : Survey Results on Diffusion, Assessment, and Clinical Use of
Positron Emission Tomography. International Journal of Technology
Assessment in Health Care , : –.
Hayek, F.A. (). e Use of Knowledge in Society. American
Economic Review , : –.
Health Consumer Powerhouse/Frontier Centre for Public Policy [HCP/
FCPP] (). Euro-Canada Health Consumer Index 2008. FC Policy
Series No. . Health Consumer Powerhouse/Frontier Centre for Public
Policy.
Health Canada (). Importation of Human-Use Drugs for Personal
Use Enforcement Directive. Health Products and Food Branch
Inspectorate ; revised .
Health Canada (). Royal Commission on Health Services, 1961–1964.
<http://www.hc-sc.gc.ca/hcs-sss/com/fed/hall-eng.php>, as of June , .
Health Canada (). Canada’s Health Care System: Timeline.
<http://www.hc-sc.gc.ca/hcs-sss/pubs/system-regime/2005-hcs-sss/time-
chron-eng.php>, as of June , .
Health Canada (a). 2007 Annual Drug Submission Performance
Report: Part I erapeutic Products Directorate (TPD); Part II Biologics
and Genetic erapies Directorate (BGTD). Health Canada, Health
Products and Food Branch.
Health Canada (b). Special data request. Contact: Helen MacLellan.
232 Canadian Health Policy Failures
Fraser Institute | www.fraserinstitute.org
Health Forum LLC (). Fast Facts on US Hospitals. American
Hospital Association.
<http://www.aha.org/aha/resource-center/Statistics-
and-Studies/fast_facts_2009.pdf>, as of June , .
Henderson, D.R. (). Myths About US Health Care. In D. Gratzer
(ed.), Better Medicine: Reforming Canadian Health Care. ECW Press.
Herrick, Devon M. (). Update 2006: Why Are Health Costs Rising?
Brief Analysis (September ). National Center for Policy Analysis.
Herrick, Devon M. (). Crisis of the Uninsured: 2008 Update. Brief
Analysis (August ). National Center for Policy Analysis.
Herzlinger, Regina (). Who Killed Health Care? America’s $2 Trillion
Medical Problem—and the Consumer-Driven Cure. McGraw-Hill.
Higgs, Robert (). Banning a Risky Product Cannot Improve Any
Consumer’s Welfare (Properly Understood), with Applications to FDA
Testing Requirements. Review of Austrian Economics , : –.
Himmelstein, David U., Deborah orne, Elizabeth Warren, and Steffie
Woolhandler (). Medical Bankruptcy in the United States, :
Results of a National Study. American Journal of Medicine. <
http://pnhp.
org/new_bankruptcy_study/Bankruptcy-2009.pdf>, as of Sept. , .
Himmelstein, David U., Elizabeth Warren, Deborah orne, and Steffie
Woolhandler (). Illness and Injury as Contributors to Bankruptcy.
Health Affairs—Web Exclusive. <
http://content.healthaffairs.org/cgi/
reprint/hlthaff.w5.63v1.pdf>, as of Sept. , .
Hollis, Aidan (a). e Importance of Being First: Evidence from
Canadian Generic Pharmaceuticals. Health Economics , : –.
References and resources 233
www.fraserinstitute.org | Fraser Institute
Hollis, Aidan (b). e Link Between Publicly Funded Health Care
and Compulsory Licensing. Canadian Medical Association Journal ,
: –.
Horwitz, Jill R. (). Making Profits and Providing Care: Comparing
Nonprofit, For-Profit, and Government Hospitals. Health Affairs , :
–.
Hurley, Jeremiah R., R. Vaithianathana, T.F. Crossley, and D. Cobb-
Clark (). Parallel Private Health Insurance in Australia: A
Cautionary Tale and Lessons for Canada. McMaster University Centre
for Health Economics and Policy Analysis (CHEPA) Research Working
Paper.
IMS Health (). IMS Drug Monitor: Canada. IMS Health Canada Inc.
IMS Health (). Special data request. CompuScript database.
Irvine, Carl, Johan Hjertqvist, and David Gratzer (). Health Reform
Abroad. In D. Gratzer (ed.), Better Medicine: Reforming Canadian
Health Care. ECW Press.
Irvine, Carl, and David Gratzer (). Medicare and User Fees: Unsafe
at any Price? AIMS Health Care Reform Background Paper No. .
Atlantic Institute for Market Studies.
Jackson, N.W., M.P. Doogue, and J.M. Elliott (). Priority Points
and Cardiac Events while Waiting for Coronary Artery Bypass Surgery.
Heart : –.
Keeler Emmett B. (). Effects of Cost Sharing on Use of Medical
Services and Health. Journal of Medical Practice Management
(Summer): –.
234 Canadian Health Policy Failures
Fraser Institute | www.fraserinstitute.org
Keeler Emmett B., Joan L. Buchanan, J.E. Rolph, J.M. Hanley, and D.M.
Reboussin (). e Demand for Episodes of Medical Treatment in the
Health Insurance Experiment. R--HHS (March). RAND Corp.; US
Department of Health and Human Services.
Keeler, Emmett B., J.P. Newhouse, and C.E. Phelps (). Deductibles
and the Demand for Medical Care Services: e eory of a Consumer
Facing a Variable Price Schedule under Uncertainty. Econometrica ,
: –.
Kennedy, Wendy (). Managing Pharmaceutical Expenditures: How
Canada Compares. In Canada Health Action: Building on the Legacy.
Papers Commissioned by the National Forum on Health. Volume .
Striking a Balance: Health Care Systems in Canada and Elsewhere
(National Forum on Health; Health Canada; Canadian Government
Publishing, Public Works and Government Services Canada; Éditions
MultiMondes): –.
Kirby, Michael J.L. (). e Health of Canadians—e Federal Role
Volume Five: Principles and Recommendatios for Reform—Part I. e
Standing Senate Committee on Social Affairs, Science and Technology.
Kornai, Janos (). Resource-Constrained Versus Demand-
Constrained Systems. Econometrica , : –.
Kornai, Janos (). e Soft Budget Constraint. Kyklos , : –.
Kornai, Janos, Eric Maskin, and Gerard Roland (). Understanding the
Soft Budget Constraint. Journal of Economic Literature , : ,–.
Lang, Ronald W. (). e Politics of Drugs: A Comparative Pressure-
Group Study of the Canadian Pharmaceutical Manufacturers
Association and the Association of the British Pharmaceutical Industry,
1930–1970. Saxon House/Lexington Books.
References and resources 235
www.fraserinstitute.org | Fraser Institute
Lasagna, L. (). Balancing Risks versus Benefits in Drug erapy
Decisions. Clinical erapeutics (suppl C.): C–.
Lasser, K.E., P.D. Allen, S.J. Woolhandler, D.U. Himmelstein, S.M.
Wolfe, and D.H. Bor (). Timing of New Black Box Warnings
and Withdrawals for Prescription Medications. Journal of American
Medical Association , : ,–.
Lawlor, A. (). Canadians Split over New Health Taxes: Survey.
Globe and Mail (October ).
Lee, Marc (). Is BC’s Health care System Sustainable? A Closer
Look at the Costs of Aging and Technology. Canadian Centre for Policy
Alternatives [CCPA].
Le Grand, Julian (). e eory of Government Failure. British
Journal of Political Science , (October): –.
Leeson, Howard (). Constitutional Jurisdiction over Health and
Health Care Services in Canada. Discussion Paper No. . Commission
on the Future of Health Care in Canada.
Lexchin, Joel (). e Real Pushers: A Critical Analysis of the
Canadian Drug Industry. New Star Books.
Lexchin, Joel (). Pharmaceuticals, Patents and Politics: Canada and
Bill C-. International Journal of Health Services , : –.
Lexchin, Joel (). Drug Makers and Drug Regulators: Too Close for
Comfort. A Study of the Canadian Situation. In D. Coburn, C. D’Arcy,
and G.M. Torrance (eds.), Health and Canadian Society: Sociological
Perspectives (University of Toronto Press): –.
236 Canadian Health Policy Failures
Fraser Institute | www.fraserinstitute.org
Lexchin, Joel (). Controlling Pharmaceutical Expenditures in
Canada. In D. Drache and T. Sullivan (eds.), Health Reform: Public
Success, Private Failure (Routledge): –.
Lexchin, Joel (a). Pharmaceuticals: Politics and Policy. In P.
Armstrong, H. Armstrong, and D. Coburn (eds.), Unhealthy Times:
Political Economy Perspectives on Health Care in Canada (Oxford
University Press): –.
Lexchin, Joel (b). Profits First: e Pharmaceutical Industry in
Canada. In B.S. Bolaria and H. Dickinson (eds.), Health, Illness, and
Health Care in Canada (rd ed.): –.
Lexchin, Joel (). Canadian Pharmaceutical Marketplace: Where
Do We Go From Here? Canadian Centre for Policy Alternatives [CCPA].
Lexchin, Joel (b). Intellectual Property Rights and the Canadian
Pharmaceutical Marketplace: Where Do We Go from Here?
International Journal of Health Services , : –.
Library of Parliament (). 34th General Election Results. PARLINFO
v...
<http://tinyurl.com/kp6cfl>, as of June , .
Lichtenberg, Frank R. (). Are the Benefits of Newer Drugs Worth
eir Cost? Evidence from the MEPS. Health Affairs , : –.
Lichtenberg, Frank R. (a). Sources of US Longevity Increase, 1960–
1997. NBER Working Paper No. . National Bureau of Economic
Research.
Lichtenberg, Frank R. (b). e Effect of Changes in Drug Utilization
on Labour Supply and Per Capita Output. NBER Working Paper No.
. National Bureau of Economic Research.
References and resources 237
www.fraserinstitute.org | Fraser Institute
Lichtenberg, Frank R. (c). Benefits and Costs of Newer Drugs: An
Update. NBER Working Paper No. . National Bureau of Economic
Research.
Lichtenberg, F.R., and T.J. Philipson (). e Dual Effects of
Intellectual Property Regulations: Within—and Between—Patent
Competition in the US Pharmaceutical Industry. Journal of Law and
Economics XLV (October).
Lichtenberg, Frank R., and Suchin Virabhak (). Pharmaceutical-
Embodied Technical Progress, Longevity, and Quality of Life: Drugs as
Equipment for Your Health. NBER Working Paper No. . National
Bureau of Economic Research.
Light, D.W., and R.N. Warburton (a). Extraordinary Claims
Require Extraordinary Evidence. Journal of Health Economics , :
,–.
Light, D.W., and R.N. Warburton (b). Setting the Record Straight
in the Reply by DiMasi, Hansen and Grabowski. Journal of Health
Economics , : –.
Lindblom, C.E. (). e Policy-Making Process. Prentice Hall Inc.
Mackinnon, Janice (). e Arithmetic of Health Care. Policy
Matters , . Institute for Research on Public Policy [IRPP].
Maioni, Antonia (). Parting at the Crossroads: e Development
of Health Insurance in Canada and the United States, –.
Comparative Politics , : –.
Maioni, Antonia (). Decentralization in Health Policy. In Robert
Young (ed.), Stretching the Federation: e Art of the State in Canada
(Institute of Intergovernmental Relations, Queen’s University): –.
238 Canadian Health Policy Failures
Fraser Institute | www.fraserinstitute.org
Maioni, Antonia (a).e Citizenship-Building Effects of Canada’s
Universal Health Care Regime. Revista Mexicana de Estudios
Canadienses. Invierno , número . Asociación Mexicana de
Estudios sobre Canadá, A.C.
<http://www.amec.com.mx/revista/
num_5_2002/Maioni_Antonia.htm>, as of Sept. , .
Maioni, Antonia (b). Federalism and Health Care in Canada. In
Keith G. Banting and Stan Corbett (eds.), Health Policy and Federalism:
A Comparative Perspective on Multi-Level Governance. Social Union
Series. Institute for Intergovernmental Relations, School of Policy
Studies, Queen’s University.
Manning, Willard G. et al. (). Health Insurance and the Demand
for Medical Care: Evidence from a Randomized Experiment. e
American Economic Review , : –.
Marmor, eodore, R. Kieke, G.H. Okma, and Stephen R. Latham
(). National Values, Institutions and Health Policies: What Do ey
Imply for Medicare Reform? Discussion Paper No. . Commission on
the Future of Health Care in Canada.
Marstellar, J.A., R.R. Bovbjerg, and L.M. Nichols (). Non-profit
Conversion: eory, Evidence and State Policy Options. Health Services
Research , (December).
Maslove, Allan M. (). National Goals and the Federal Role
in Health Care. In Canada Health Action: Building on the Legacy.
Papers Commissioned by the National Forum on Health. Volume .
Striking a Balance: Health Care Systems in Canada and Elsewhere
(National Forum on Health; Health Canada; Canadian Government
Publishing, Public Works and Government Services Canada; Éditions
MultiMondes): –.
References and resources 239
www.fraserinstitute.org | Fraser Institute
Maynard, Alan (). How to Defend a Public Health Care System:
Lessons from Abroad. In Colleen M. Flood et al. (eds.), Access to Care,
Access to Justice: e Legal Debate over Private Health Insurance in
Canada (University of Toronto Press): –.
Mays, J., and M. Brenner (). Estimates of Medicare Beneficiaries’
Out-of-Pocket Drug Spending in 2006. Actuarial Research Corporation
and the Kaiser Family Foundation.
Mazankowski, D. et al. (). A Framework for Reform. Alberta
Premier’s Advisory Council on Health.
McClellan, M., and D. Staiger (). Comparing Hospital Quality at
For-Profit and Not-For-Profit Hospitals. NBER Working Paper No. .
National Bureau of Economic Research.
McKee, Martin, and Judith Healy (eds.) (). Hospitals in a Changing
Europe. European Observatory on Health Care Systems Series: World
Health Organization.
Menard, J.L. (). Pour Sortir de l’Impasse: La Solidarité Entre nos
Générations. Le Comité de Travail sur la Pérennité du Système de Santé
et de Services Sociaux du Québec.
Mhatre, S.L., and R. Deber (). From Equal Access to Health Care
to Equitable Access to Health: A Review of Canadian Provincial Health
Commissions and Reports. International Journal of Health Services
, : –. Also in D. Coburn, C. D’Arcy, and G.M. Torrance (eds.)
(), Health and Canadian Society: Sociological Perspectives (rd ed.):
–.
Miller, Edward G., John F. Moeller, and Randall S. Stafford (). New
Cardiovascular Drugs: Patterns of Use and Association with Non-Drug
Health Expenditures. Inquiry , : –.
240 Canadian Health Policy Failures
Fraser Institute | www.fraserinstitute.org
Mitchell, William C., and Randy T. Simmons (). Beyond Politics:
Markets, Welfare, and the Failure of the Bureaucracy. Westview Press.
Morgan, Steve (). Issues for Canadian Pharmaceutical Policy. In
Canada Health Action: Building on the Legacy. Papers Commissioned
by the National Forum on Health. Volume . Striking a Balance: Health
Care Systems in Canada and Elsewhere (National Forum on Health;
Health Canada; Canadian Government Publishing, Public Works and
Government Services Canada; Éditions MultiMondes): –.
Morgan, Steve, and Jeremiah Hurley (). Influences on the Health
Care Technology Cost-Driver. Discussion Paper No. . Commission on
the Future of Health Care in Canada.
Morgan, Steven G., Kenneth L. Bassett, James M. Wright, Robert
G. Evans, Morris L. Barer, Patricia A. Caetano, and Charlyn D.
Black (). “Breakthrough” Drugs and Growth in Expenditure on
Prescription Drugs in Canada. British Medical Journal online.
Morgan, Steven G. et al. (). Centralized Drug Review Processes
in Australia, Canada, New Zealand and the United Kingdom. Health
Affairs , : –.
Mossialos, Elias, Anna Dixon, Josep Figueras, and Joe Kutzin
(eds.) (). Funding Health Care: Options for Europe. European
Observatory on Health Care Systems Series: World Health
Organization.
Mueller, Dennis C. (ed.) (). Public Choice. Cambridge University Press.
Mueller, Dennis C. (). Public Choice II. Cambridge University Press.
Mueller, Dennis C. (). Perspectives on Rational Choice (aka Public
Choice): A Handbook. Cambridge University Press.
References and resources 241
www.fraserinstitute.org | Fraser Institute
Mullins, Mark (a). 2028 or Bust: Ontario’s Unsustainable Hospital
Funding. Fraser Alert. Fraser Institute.
Mullins, Mark (b). Where Does the Money Go? A Study of Worker
Pay in Ontario’s Hospitals. Fraser Institute.
Musgrove, P. (). Public and Private Roles in Health: eory and
Financing Patterns. Discussion Paper No. . e World Bank.
National Association of Community Health Centers [NACHC] ().
America’s Health Centers: Fact Sheet #0109 (March).
<www.nachc.com>,
as of Sept. , .
National Forum on Health (). Canada Health Action: Building on
the Legacy. Papers Commissioned by the National Forum on Health.
Volumes to . Canada: Editions MultiMondes, National Forum on
Health, Health Canada, and Canadian Government Publishing, Public
Works and Government Services Canada.
Navarro, Vincent (). Why Some Countries Have National Health
Insurance, Others Have National Health Services and the US Has
Neither. Social Science and Medicine (September): –.
Navarro, Vincent (). e World Health Report : Can Health
Care Systems Be Compared Using a Single Measure of Performance?
American Journal of Public Health , : –.
Naylor, David C. (). Private Practice, Public Payment: Canadian
Medicine and the Politics of Health Insurance, 1911–1966. McGill-
Queen’s University Press.
Naylor, David C. (). Your Money and/or Your Life? Canadian
Medical Association Journal , : ,–.
242 Canadian Health Policy Failures
Fraser Institute | www.fraserinstitute.org
Newhouse, Joseph P. et al. (). Free For All? Lessons From e RAND
Health Insurance Experiment. Harvard University Press.
Newhouse, Joseph P., C.E. Phelps, and W.B. Schwartz (). Policy
Options and the Impact of National Health Insurance. RAND Health
Abstract.
Newhouse, Joseph P., J.E. Rolph, B. Mori, and M. Murphy (). e
Effect of Deductibles on the Demand for Medical Care Services. Journal
of the American Statistical Association : –.
Normand, Charles, and Reinhard Busse (). Social Health Insurance
Financing. In Elias Mossialos, Anna Dixon, Josep Figueras, and Joe
Kutzin (eds.), Funding Health Care: Options for Europe. World Health
Organization, European Observatory on Health Care Systems Series.
Olson, Mary K. (). e Risk We Bear: e Effects of Review
Speed and Industry User Fees on New Drug Safety. Journal of Health
Economics , : –.
Olson, Mancur Jr. (). e Logic of Collective Action: Public Goods
and the eory of Groups. Harvard University Press.
Ontario Bill (). An Act to establish the Ontario Health
Quality Council, to enact new legislation concerning health service
accessibility and repeal the Health care Accessibility Act, to provide
for accountability in the health service sector, and to amend the Health
Insurance Act. First reading November , . st Session, th
Legislature, Legislative Assembly of Ontario.
Ontario Ministry of Finance (). 2004 Ontario Budget: e Plan for
Change.
References and resources 243
www.fraserinstitute.org | Fraser Institute
Organisation for Economic Co-operation and Development [OECD]
(). Rising Health Costs Put Pressure on Public Finances, Finds
OECD. News release.
Organisation for Economic Co-operation and Development [OECD]
(). OECD Health Data 2007. Statistics and Indicators for 30
Countries.
Organisation for Economic Co-operation and Development [OECD]
(). OECD Health Data 2008. Statistics and Indicators for 30
Countries.
Ovretveit, J. (). e Changing Public-Private Mix in Nordic Health
Care—An Analysis. Nordic School of Public Health.
Pacquette, P.R., P. MacNeil, T. Montague, K. Skilton, S. Cavanaugh, J.
Sproule, H. Trifonopoulos, M. Lustig, B. Ferguson, and E. McKenzie
(). e Waitlist for Access to Prescription Drugs in Canada.
International Society of Technology Assessment in Health Care,
Annual Meeting of the International Society of Technology Assessment
in Health Care. ; : .
Pal, Leslie A. (). Beyond Policy Analysis: Public Issue Management
in Turbulent Times. ITP Nelson.
Palacios, Milagros, and Niels Veldhuis (). Canadian Government
Debt 2008: A Guide to the Indebtedness of Canada and the Provinces.
Fraser Institute.
Palmer D’Angelo Consulting Inc. [PDCI] (). Generic Drug Prices: A
Canada US Comparison. PDCI Report Series.
Patented Medicine Prices Review Board [PMPRB] (). A Study of the
Prices of the Top Selling Multiple Source Medicines in Canada.
244 Canadian Health Policy Failures
Fraser Institute | www.fraserinstitute.org
Patented Medicine Prices Review Board [PMPRB] (). PMPRB 2006
Annual Report.
Patented Medicine Prices Review Board [PMPRB] (). FAQs.
Pauly, Mark V. (). e Economics of Moral Hazard: Comment.
American Economic Review , : –.
Pauly, Mark V. (). Is Cream-Skimming a Problem for the Competitive
Medical Market? Journal of Health Economics , : –.
Pauly, Mark V. (). Taxation, Health Insurance, and Market Failure
in the Medical Economy. Journal of Economic Literature , : –.
Pauly, Mark V. (). Nonprofit Firms in Medical Markets. American
Economic Review , : –.
Pauly, Mark V. (). Is Medical Care Different? Old Questions, New
Answers. Journal of Health Politics, Policy and Law , : –.
Pauly, Mark V. (). U.S. Health Care Costs: e Untold True Story.
Health Affairs , : –.
Pauly, Mark V. (). Who Was at Straw Man Anyway? A Comment
on Evans and Rice. Journal of Health Politics, Policy and Law , :
–.
Pauly, Mark V. (). James Buchanan as a Health Economist. In
G. Brennan, H. Kliemt, and R.D. Tollison (eds.), Method and Morals
in Constitutional Economics: Essays in Honor of James M. Buchanan.
Springer-Verlag.
Pauly, Mark V. (). Should We Be Worried About High Real Medical
Spending Growth In e United States? Health Affairs , W (January):
–.
References and resources 245
www.fraserinstitute.org | Fraser Institute
Pauly, Mark V., Patricia Danzon, Paul Feldstein, and John Hoff (). A
Plan For ‘Responsible National Health Insurance.’ Health Affairs , :
–.
Pengelley, H. (). Situation Tense in Quebec as Physicians Ordered
into ERs. Canadian Medical Association Journal , .
Phillips, Robert L. Jr., Stephen Petterson, George E. Fryer Jr., and
Walter Rosser (). e Canadian Contribution to the US Physician
Workforce. Canadian Medical Association Journal , : ,–.
Philipson, Tomas J., Ernst R. Berndt, Adrian H.B. Gottschalk, and
Matthew W. Strobeck (). Assessing the Safety and Efficacy of the
FDA: e Case of the Prescription Drug User Fee Acts. NBER Working
Paper No. . National Bureau of Economic Research.
Pitterle, M.E., C.A. Bond, C.L. Raehl, and T. Franke (). Hospital and
Pharmacy Characteristics Associated with Mortality Rates in United
States Hospitals. Pharmacotherapy , : –.
Poland, B., D. Coburn, and J.E. Robertson (). Wealth, Equity, and
Health Care: A Critique of a ‘Population Health’ Perspective on the
Determinants of Health. Social Science and Medicine , : –.
POLARRA (). e National Survey on Health in Canada.
Pollard, Stephen (). NICE is Nasty. Fraser Forum (March). Fraser
Institute.
Population Health Research Unit [PHRU] (). Special data request.
Halifax: Dalhousie University.
PriceWaterhouseCoopers, Health Research Institute [PWC] ().
Health Cast 2020: Creating a Sustainable Future.
246 Canadian Health Policy Failures
Fraser Institute | www.fraserinstitute.org
Priest, Lisa (, January ). A Boy’s Plight, A Nation’s Problem.
Globe and Mail.
Priest, Lisa (, May ). MPP Demands Help for Ailing Boy. Globe
and Mail.
Priest, Lisa (, January ). Patient’s Choice: Wait Weeks or Pay
$,. Globe and Mail.
Priest, Lisa (, April ). Cancer Patients Dig Deep to Pay for New
Drugs. Globe and Mail.
Priest, Lisa (, May ). Canada’s US Baby Boom. Globe and Mail: A.
Priest, Lisa (, August ). How Long Is Too Long to Wait for a
Cancer Operation? Globe and Mail.
Pross, A. Paul (). Pressure Groups: Adaptive Instruments of
Political Communication. In. A. Paul Pross (ed.), Pressure Group
Behaviour in Canadian Politics. McGraw-Hill Ryerson.
Pross, A. Paul (). Group Politics and Public Policy. Oxford
University Press.
Rachlis, Michael, Robert G. Evans, Patrick Lewis, and Morris L. Barer
(). Revitalizing Medicare: Shared Problems, Public Solutions.
Tommy Douglas Research Institute.
Ramsay, Cynthia (). Beyond the Public-Private Debate: An
Examination of Quality, Access and Cost in the Health-Care Systems of
Eight Countries. Marigold Foundation; Western Sky Communications Ltd.
Rand, Ayn (). Patents and Copyrights. In Ayn Rand with Nathaniel
Branden, Alan Greenspan, and Robert Hessen, Capitalism: e
Unknown Ideal. Penguin.
References and resources 247
www.fraserinstitute.org | Fraser Institute
Red Book (). Pharmacy’s Fundamental Reference: 2007 Edition.
omson PDR.
Redish, Angela, Janis Sarra, and Margaret Schabas (). Table :
Primary Causes of Bankruptcy, Reported—By Age. Growing Old
Gracefully: An Investigation into the Growing Number of Bankrupt
Canadians Over Age 55. Office of the Superintendent of Bankruptcy.
<http://www.ic.gc.ca/eic/site/bsf-osb.nsf/vwapj/Redish-Sarra-Schabas-
2006-ENG.pdf/$FILE/Redish-Sarra-Schabas-2006-ENG.pdf>, as of Sept.
, . See also Chart : Causes of Bankruptcy—Reported Primary
Cause. In Growing Old Gracefully: An Investigation into the Growing
Number of Bankrupt Canadians Over Age 55, Part .
<http://www.ic.gc.
ca/eic/site/bsf-osb.nsf/eng/br01686.html>, as of Sept. ,
Reinhardt, U.E., P.S. Hussey, and G.F. Anderson (). Cross-National
Comparisons of Health Systems Using OECD Data, . Health
Affairs , : –.
Renaud, Marc (). Reform or Illusion? An Analysis of the Quebec
State Intervention in Health. In D. Coburn, G.M. Torrance, and C.
D’Arcy (eds.), Health and Canadian Society (nd ed.): –.
Rice, omas (a). Can Markets Give Us the Health System We
Want? Journal of Health Politics, Policy and Law , : –.
Rice, omas (b). A Reply to Gaynor and Vogt, and Pauly.
Response. Journal of Health Politics, Policy and Law , : –.
Riker, William H. (). e eory of Political Coalitions. Yale
University Press.
Robinson, Ray (). User Charges for Health Care. In E. Mossialos, A.
Dixon, J. Figueras and J. Kutzin (eds.), Funding Health Care: Options for
Europe. European Observatory on Health Care Systems: World Health
Organization.
248 Canadian Health Policy Failures
Fraser Institute | www.fraserinstitute.org
Robson, William B.P. (). Will the Baby Boomers Bust the Health
Budget? Demographic Change and Health Care Financing Reform.
Commentary No. . C.D. Howe Institute.
Rocher, Francois, and Miriam Smith (). Federalism and Health
Care: e Impact of Political-Institutional Dynamics on the Canadian
Health Care System. Discussion Paper No. . Commission on the
Future of Health care in Canada.
Romanow, Roy (). Building on Values: e Future of Health Care
in Canada—Final Report. Commission on the Future of Health Care in
Canada.
Royal Commission on Health Services (). Vol . Government of
Canada. Catalogue No. Z-/-.
Ryten, Eva, A. Dianne urber, and Lynda Buske (). e Class of
and Physician Supply in Canada. Canadian Medical Association
Journal : –.
Saccone, Julie (, July ). Breast Cancer Patient Upset by Long Wait
for Further Treatment. e Star Phoenix.
Sanger, Toby (). How Rising Drug Costs Swallowed My Health Care
and Gobbled Up the Economy, Too. CUPE Economic Brief. Canadian
Union of Public Employees [CUPE].
Santerre, Rexford E., and John A. Vernon (). A Cost-Benefit
Analysis of Drug Price Controls in the U.S. AEI-Brookings Joint Center
for Regulatory Studies.
Santerre, Rexford, J.A. Vernon, and C. Giacotto (). e Impact of
Indirect Government Controls on U.S. Drug Prices and R&D. Cato
Journal , .
References and resources 249
www.fraserinstitute.org | Fraser Institute
Saskatoon StarPhoenix (, October ). Road to Cancer Diagnosis
Long for Hudson Bay Woman.
Savoie, Donald J. (). Governing from the Centre: e Concentration
of Power in Canadian Politics. University of Toronto Press.
Schneeweiss Sebastien, M. Maclure, C.R. Dormuth, R.J. Glynn, C.
Canning, and J. Avorn (). A erapeutic Substitution Policy
for Proton Pump Inhibitors: Clinical and Economic Consequences.
Clinical Pharmacology and erapeutics , : –.
Schoen C., R. Osborn, P.T. Huynh, M. Doty, K. Davis et al. ().
Primary Care and Health System Performance: Adults’ Experiences in
Five Countries. Health Affairs W: –.
Schoen, Cathy, Robin Osborn, Phuong Trang Huynh, Michelle Doty,
Kinga Zapert, Jordon Peugh, and Karen Davis (). Taking the Pulse
of Health Care Systems: Experiences of Patients with Health Problems
in Six Countries. Health Affairs (November). Web exclusive.
Schoen C., R. Osborn, M.M. Doty et al. (). Towards Higher-
Performance Health Systems: Adults’ Health Care Experiences in Seven
Countries, . Health Affairs , : –.
Schultze, Charles L. (). e Public Use of Private Interest.
Brookings Institute.
Schumaker, P. et al. (eds.) (). Normative Voices: An Anthology in
Modern Political Ideas. McGraw-Hill.
Scott, Claudia (). Public and Private Roles in Health Care Systems:
Reform Experience in Seven OECD Countries. Open University Press.
250 Canadian Health Policy Failures
Fraser Institute | www.fraserinstitute.org
Scott, Geoffroy (). International Comparison of the Hospital Sector.
In Striking a Balance: Health Care Systems in Canada and Elsewhere.
Volume . Canada Health Action: Building on the Legacy (National
Forum on Health): –.
Shaw, Andy (). Diagnostic Imaging Across Canada: e Emperors Still
Have No Clothes. Canadian Healthcare Technology (January/February).
Simoens, Steven, and Jeremy Hurst (). e Supply of Physician
Services in OECD Countries. OECD Health Working Papers No. .
Sjoqvist, F. (). Drug Safety in Relation to Efficacy: e View of a
Clinical Pharmacologist. Pharmacology and Toxicology , : –.
Skinner, Brett J. (). e Medical Brain Drain and its Potential
to Affect Health Care in Canada. Master’s Degree esis. Faculty of
Graduate Studies and Research, University of Windsor.
Skinner, Brett J. (a). e Non-Sustainability of Health Care
Financing under the Medicare Model. Atlantic Institute for Market
Studies [AIMS].
Skinner, Brett J. (b). Medicare, the Medical Brain Drain and
Human Resource Shortages in Health Care. Atlantic Institute for
Market Studies [AIMS].
Skinner, Brett J. (c). e Benefits of Allowing Business Back Into
Canadian Health Care. Atlantic Institute for Market Studies [AIMS].
Skinner, Brett J. (a). Paying More, Getting Less: Ontario’s Health
Premium and Sustainable Health Care. Fraser Institute.
Skinner, Brett J. (b). Generic Drugopoly: Why Non-Patented
Prescription Drugs Cost More in Canada than in the United States and
Europe. Fraser Institute.
References and resources 251
www.fraserinstitute.org | Fraser Institute
Skinner, Brett J. (a). Paying More, Getting Less 2005: Measuring
the Sustainability of Provincial Public Health Expenditure in Canada.
Fraser Institute.
Skinner, Brett J. (b). Canada’s Drug Price Paradox: e Unexpected
Losses Caused by Government Interference in Pharmaceutical Markets.
Fraser Institute.
Skinner, Brett J. (c). Why Medicare Fails to Provide Access to
Medically Necessary Health Care. Fraser Forum (October): –.
Fraser Institute.
Skinner, Brett J. (a). e Consequences of Questionable Research.
Fraser Forum (May): –. Fraser Institute.
Skinner, Brett J. (b). Price Controls, Patents and Cross-
Border Internet Pharmacies: reats to Canada’s Drug Supply and
International Trading Relations. Fraser Institute. Also, Prescription
Piracy: e Black Market in Foreign Drugs Will Not Reduce US Health
care Costs. In J.R. Graham (ed.) (), What States Can Do to Reform
Health Care: A Free-Market Primer. Pacific Research Institute.
Skinner, Brett J. (a). Risk, ‘Progressive Licensing’ and the Health
Benefits Lost by Over-Regulating New Drugs. Fraser Institute.
Skinner, Brett J. (b). Long-Term or Short-Term, Public Health
Insurance is Not Sustainable: A Reply to CUPE about Health Spending
Trends in Canada. Fraser Institute.
Skinner, Brett J. (c). Misinformation and Wishful inking About
Medicare’s Sustainability. Fraser Institute.
Skinner, Brett J. (). Barriers to Health Policy Liberalization in
Canada: Institutions, Information, Interests, and Incentives. University of
Western Ontario. Doctoral thesis. Catalogued in the Library of Canada.
252 Canadian Health Policy Failures
Fraser Institute | www.fraserinstitute.org
Skinner, B.J., J.R. Gray, and G.P. Attara (). Increased Health Costs
from Mandated erapeutic Substitution of Proton Pump Inhibitors
in British Columbia. Alimentary Pharmacology and erapeutics , :
–.
Skinner, Brett J., and Mark Rovere (). Paying More, Getting Less
2006: Measuring the Sustainability of Public Health Insurance in
Canada. Fraser Institute.
Skinner, Brett J., and Mark Rovere (a). Paying More, Getting Less
2007: Measuring the Sustainability of Government Health Spending in
Canada. Fraser Institute.
Skinner, Brett J., and Mark Rovere (b). e Misguided War Against
Medicines: Are Drug Expenditures Making Public Health Insurance
Financially Unsustainable? Fraser Institute.
Skinner, Brett J., and Mark Rovere (c). e Cost Burden of
Prescription Drug Spending in Canada and the United States. Fraser
Institute.
Skinner, Brett J., and Mark Rovere (d). Canada’s Drug Price
Paradox 2007. Fraser Institute.
Skinner, Brett J., and Mark Rovere (e). California Dreaming: e
Fantasy of a Canadian-Style Health Insurance Monopoly in the United
States. Fraser Institute.
Skinner, Brett J., and Mark Rovere (a). Paying More, Getting
Less: Measuring the Sustainability of Government Health Spending in
Canada. 2008 Report. Fraser Institute.
Skinner, Brett J., and Mark Rovere (b). e Misguided War Against
Medicines: Are Drug Expenditures Making Public Health Insurance
Financially Unsustainable? 2008. Fraser Institute.
References and resources 253
www.fraserinstitute.org | Fraser Institute
Skinner, Brett J., and Mark Rovere (c). Canada’s Drug Price
Paradox 2008. Fraser Institute.
Skinner, Brett J., and Mark Rovere (d). Access Delayed, Access
Denied: Waiting for New Medicines in Canada 2008. Fraser Institute.
Skinner, Brett J., and Mark Rovere (e). e Cost Burden of
Prescription Drug Spending in Canada and the United States. 2008
Report. Fraser Institute.
Skinner, Brett J., and Mark Rovere (). Health Insurance and
Bankruptcy Rates in Canada and the United States. Fraser Institute.
Skinner, Brett J., Mark Rovere, and Courtney Glen (). Access
Delayed, Access Denied: Waiting for Medicines in Canada. Fraser
Institute.
Skinner, Brett J., Mark Rovere, and Marisha Warrington (). e
Hidden Costs of Single-Payer Health Insurance: A Comparison of the
United States and Canada. Fraser Institute.
Sloan, Frank A. (). Not-For-Profit Ownership and Hospital
Behavior. In A.J. Culyer and J. Newhouse (eds.), Handbook of Health
Economics. Elsevier.
Sloan, Frank A., and Robert A. Vraciu (). Investor-Owned and Not-
for-Profit Hospitals: Addressing Some Issues. Health Affairs , : –.
Solomon, Sam (). Chaoulli Copycat Cases Crop Up Across
Country: Using Quebec’s Landmark Supreme Court Decision as a
Precedent, More Canadians Challenge Single-Payer System. National
Review of Medicine , .
254 Canadian Health Policy Failures
Fraser Institute | www.fraserinstitute.org
Statistics Canada (a). Canadian Community Health Survey,
. e Daily (June ).
<http://www.statcan.ca/Daily/English/040615/
d040615b.htm>, as of Sept. , .
Statistics Canada (b). Household Expenditure Statistics. CANSIM
Table -. Catalogue No. --XIE.
Statistics Canada (a). CANSIM Table -: Federal, provincial
and territorial general government revenue and expenditures, for fiscal
year ending March , annual (dollars).
Statistics Canada (b). CANSIM Table -: Gross Domestic
Product (GDP), expenditure-based, annual (dollars x ,,).
Statistics Canada (). Family income, by family type. CANSIM
Table - (for fee).
Statistics Canada (a). Canadian Community Health Survey. e
Daily (June ).
<http://www.statcan.gc.ca/daily-quotidien/080618/
dq080618a-eng.htm>, as of Sept. , . Also, tables “Usual source
of care, Canadians who do not have a regular medical doctor but
report having a usual source of care, by selected characteristics,
Canada excluding the territories, ” and “Percentage distribution
of Canadians aged years or older with or without a regular medical
doctor, by selected characteristics, Canada excluding the territories,
”
<http://www.statcan.gc.ca/daily-quotidien/080618/t080618a-eng.htm>,
as of Sept. , .
Statistics Canada (b). Financial Management System. Statistics
Canada.
Statistics Canada (a). Provincial and Territorial Economic
Accounts Review, 2008 preliminary estimates, Vol. 5, No. 1. Catalogue
No. 13-016-X.
<http://www.statcan.gc.ca/bsolc/olc-cel/olc-cel?catno=13-
016-x&lang=eng>, as of Sept. 11, 2009.
References and resources 255
www.fraserinstitute.org | Fraser Institute
Statistics Canada (b). Unemployment rates, Canada and the
United States.
<http://www.statcan.gc.ca/pub/71-222-x/2008001/sectionp/
p-unemployment-chomage-eng.htm>, as of Sept. , .
Stevenson, James (, October ). Alta. Health Minister “Deeply
Concerned” Over rd Emergency Room Miscarriage. CBC News.
Stigler, George (). e eory of Economic Regulation. e Bell
Journal of Economics and Management Science , : –.
Stiglitz, Joseph E. (). e Private Uses of Public Interests: Incentives
and Institutions. Journal of Economic Perspectives (Spring): –.
Stokes, Ernie, and Robin Somerville (). e Economic Costs of Wait
Times in Canada. Centre for Spatial Economics. A study commissioned
by the British Columbia Medical Association (BCMA) and the
Canadian Medical Association (CMA).
Sullivan, Patrick (a). Family Medicine Crisis? Field Attracts
Smallest Ever Share of Residency Applicants. Canadian Medical
Association Journal , : –.
Sullivan, Patrick (b). Doctors Worried About Emergence of “Have-
Not” Specialties and Have-Not Patients. Canadian Medical Association
(January).
<http://www.cma.ca/index.cfm/ci_id/10037495/1a_id/1.htm>, as
of June , .
Sullivan, Terrence (). Commentary on Health Care Expenditures,
Social Spending and Health Status. In Canada Health Action: Building
on the Legacy. Papers Commissioned by the National Forum on Health.
Volume . Striking a Balance: Health Care Systems in Canada and
Elsewhere (National Forum on Health; Health Canada; Canadian
Government Publishing, Public Works and Government Services
Canada; Éditions MultiMondes): –.
256 Canadian Health Policy Failures
Fraser Institute | www.fraserinstitute.org
Sundakov, Alex (). New Zealand Pharmaceutical Policies: Time to
Take a Fresh Look. Castalia Advisory Group.
Swartz, Donald (). e Politics of Reform: Public Health Insurance
in Canada. International Journal of Health Services , : –.
Sylvain, Matthew (, February ). Ticket to Health. NS Health
Authority Holds Patient Lottery; Winners Get a Family Physician.
Medical Post.
Task Force Two: A Physician Human Resource Strategy for Canada
(). Canada’s Physician Workforce: Occupational Human Resources
Data Assessment and Trends Analysis. Report prepared by Canadian
Labour and Business Centre and Canadian Policy Research Networks
for Task Force Two: A Physician Human Resource Strategy for Canada.
Government of Canada.
Taylor, Carole (). Economic and Fiscal Update: First Quarterly
Report. PowerPoint presentation. (September ). British Columbia
Ministry of Finance.
Taylor, Malcolm G. (). Health Insurance and Canadian Public
Policy: e Seven Decisions that Created the Canadian Health
Insurance System. Institute of Public Administration of Canada.
Taylor, Malcolm G.(). Insuring National Health Care: e
Canadian Experience. University of North Carolina Press.
orpe, K.E. (). Is Canada Really Different? A Comparison of
Health Care Spending in Selected US States and Canadian Provinces.
In R.J. Arnould et al. (eds.), Competitive Approaches to Health Care
Reform. Urban Institute Press.
References and resources 257
www.fraserinstitute.org | Fraser Institute
Tierney, M., V. Shukla, T. O’Grady, and S. Pagotto (). An Analysis
of Reasons Why Reimbursement Is Not Recommended For New
Drugs. Health Technology Assessment International. Handbook of
Health Technology Assessment , : . Meeting abstracts. Canadian
Agency for Drugs and Technology in Health [CADTH].
Timely Medical (). BC Waiting List Forces Vernon Patient to Seek
Treatment in the US. Timely Medical.
Times Colonist (, May ). Shift Patients From Emergency Wards:
e Crowding at Hospitals Is Made Worse Because Patients Have
Nowhere to Go. Times Colonist.
Tollison, Robert D. (). Rent Seeking. In Dennis C. Mueller (ed.),
Perspectives on Public Choice: A Handbook. Cambridge University Press.
Torrance, George M. (). Socio-Historical Overview: e
Development of the Canadian Health System. In D. Coburn, C. D’Arcy,
and G.M. Torrance (eds.), Health and Canadian Society: Sociological
Perspectives (rd ed.): –.
Tullock, Gordon (). Efficient Rent-Seeking and Rent-Seeking as a
Negative-Sum Game. In James M. Buchanan, Robert D. Tollison, and
Gordon Tullock (eds.), Toward a eory of the Rent-Seeking Society.
Texas A&M University Press.
Tullock, Gordon (). e eory of Public Choice. In Gordon
Tullock, Arthur Seldon, and Gordon L. Brady (eds.), Government
Failure: A Primer in Public Choice. Cato Institute.
Tullock, Gordon, Arthur Seldon, and Gordon L. Brady ().
Government Failure: A Primer in Public Choice. Cato Institute.
258 Canadian Health Policy Failures
Fraser Institute | www.fraserinstitute.org
Tuohy, C.H., C.M. Flood, and M. Stabile (). How Does Private
Finance Affect Public Health Care Systems? Marshalling the Evidence
from OECD Nations. University of Toronto Department of Economics.
Working Paper.
Tuohy, C.J. (). Medicine and the State in Canada: e Extra-Billing
Issue in Perspective. Canadian Journal of Political Science , : –.
US Census Bureau (). Annual Estimates of the Population for the
United States, Regions, States, and Puerto Rico: April 1, 2000–July 1,
2007. Population Division, US Census Bureau.
US Food and Drug Administration, Department of Health and Human
Services [FDA] (). Generic Drug Prices in the US Are Lower than
Drug Prices in Canada. White paper. US FDA Office of Planning.
US National Center for Health Statistics [NCHS] (a). Health,
United States, 2006: With Chartbook on Trends in the Health of
Americans. Table : National health expenditures, average annual
percent change, and percent distribution, by type of expenditure:
United States, selected years –.
US National Center for Health Statistics [NCHS] (b). Health,
United States, 2006: With Chartbook on Trends in the Health of
Americans. Table : Doctors of medicine, by activity and place of
medical education: United States and outlying US areas, selected years
–.
Van Kleef, R.C., K. Beck, W.P.M.M. Van de Ven, and R.C.J.A. van Vliet
(). Risk Equalization and Voluntary Deductibles: A Complex
Interaction. Journal of Health Economics , : –.
Vaughan, Frederick (). Emmett Matthew Hall: e Activist as
Justice. Osgoode Hall Law Journal , : –.
References and resources 259
www.fraserinstitute.org | Fraser Institute
Veldhuis, Niels, and Michael Walker (). Tax Facts 14. Table .:
Decile distribution of taxes (percent). Calculated from the Fraser
Institute’s Canadian Tax Simulator . Fraser Institute.
Vernon, John A. (). Examining the Link between Price Regulation
and Pharmaceutical R&D Investment. Health Economics , : –.
Walters, Vivienne (). State, Capital, and Labour: e Introduction
of Federal-Provincial Insurance for Physician Care in Canada.
Canadian Review of Sociology and Anthropology , : –.
Weimer, David L., and Aidan R. Vining (). Policy Analysis: Concepts
and Practice (rd ed.). Prentice Hall.
Wente, Margaret (, March ). Saves Lives, Money? Not in Ontario.
Globe and Mail.
Wertheimer, Albert, Richard Levy, and omas O’Connor ().
Too Many Drugs? e Clinical and Economic Value of Incremental
Innovations. In Investing in Health: e Social and Economic Benefits of
Health Care Innovation : –.
World Health Organization [WHO] (). e World Health Report
2000. Health Systems: Improving Performance. Annex Table : Health
system performance in all Member States, WHO indexes, estimates for
. World Health Organization.
World Health Organization [WHO] (). Highlights on Health in
Switzerland. Regional Office for Europe [WHO-REO].
World Health Organization [WHO] (). WHO Statistical Information
System [WHOSIS].
<http://www.who.int/whosis/en/index.html>, as of June
, .
260 Canadian Health Policy Failures
Fraser Institute | www.fraserinstitute.org
Wiktorowicz, Mary E. (). Emergent Patterns in the Regulation
of Pharmaceuticals: Institutions and Interests in the United States,
Canada, Britain, and France. Journal of Health Politics, Policy and Law
, (August): –.
Willcox, S., M. Seddon, S. Dunn et al. (). Measuring and Reducing
Waiting Times: A Cross-National Comparison of Strategies. Health
Affairs , : ,–.
Wilson, Donna M. (). Public and Private Health-Care Systems: What
the Literature Says. Canadian Public Administration , : –.
World Medical Association [WMA] (). World Medical Association
Declaration of Helsinki: Ethical Principles for Medical Research
Involving Human Subjects.
<http://www.wma.net/e/policy/b3.htm>, as of
June , .
Wolf, Charles Jr. (). A eory of Nonmarket Failure: Framework
for Implementation Analysis. Journal of Law and Economics (April):
–.
Woolhandler, Steffie, and David U. Himmelstein (). Costs of Care
and Administration at For-Profit and Other Hospitals in the United
States. New England Journal of Medicine , : –.
Woolhandler, Steffie, and David U. Himmelstein (). When Money
is the Mission—e High Cost of Investor-Owned Care. New England
Journal of Medicine , : –.
World Trade Organization [WTO] (). World Trade Agreement
1994: Trade Related Aspects of Intellectual Property Rights.
<http://www.wto.org/english/docs_e/legal_e/27-trips.pdf>, as of June , .
References and resources 261
www.fraserinstitute.org | Fraser Institute
Wyatt, George, Valerie Gladu, Kim McDonald-Taylor, Roger MacPhee,
Alan Coley, and Jacqueline Milne (). e 2007 Wyatt Health
International Comparison. Access to Innovative Pharmaceuticals: How
Do Countries Compare? A report prepared for Canada’s Research-Based
Pharmaceutical Companies (Rx&D). Wyatt Health Management Inc.
Canadian Health Policy Failures 263
www.fraserinstitute.org | Fraser Institute
About this publication
Distribution
is publication is available from <http://www.fraserinstitute.org>
in Portable Document Format (PDF) and can be read with Adobe
Acrobat® or with Adobe Reader®, which is available free of charge
from Adobe Systems Inc. To download Adobe Reader, go to this link
<http://get.adobe.com/reader> with your browser. We encourage you
to install the most recent version.
Ordering publications
For information about ordering the printed publications of the Fraser
Institute, please contact the publications coordinator
e-mail: sales@fraserinstitute.org
telephone: .. ext. or, toll free,
... ext.
fax: ..
Media
For media inquiries, please contact our Communications Department
telephone: ..
e-mail:
communications@fraserinstitute.org
Disclaimer
e opinions and analysis expressed in this book are entirely those of
the author and do not necessarily represent the views of the Fraser
Institute, anyone affiliated with or employed by the Fraser Institute,
or those who reviewed this book.
264 Canadian Health Policy Failures
Fraser Institute | www.fraserinstitute.org
ISBN
----
Date of issue
September
Editing and production
Kendal Egli
Design
Lindsey omas Martin and Kendal Egli
Cover design
Bill Ray
Images for cover
Kapsel rot-weiss © Rainer Claus; Fotolia
Spilled capsule © mashe; Fotolia
Supporting the Fraser Institute
To learn how to support the Fraser Institute, please contact
Development Department, Fraser Institute
Fourth Floor, Burrard Street
Vancouver, British Columbia VJ G
telephone, toll free: ... ext.
e-mail:
development@fraserinstitute.org
Canadian Health Policy Failures 265
www.fraserinstitute.org | Fraser Institute
About the Fraser Institute
Our vision is a free and prosperous world where individuals benefit
from greater choice, competitive markets, and personal responsibil-
ity. Our mission is to measure, study, and communicate the impact of
competitive markets and government interventions on the welfare of
individuals.
Founded in , we are an independent research and edu-
cational organization with locations throughout North America and
international partners in over countries. Our work is financed by
tax-deductible contributions from thousands of individuals, organi-
zations, and foundations. In order to protect its independence, the
Institute does not accept grants from government or contracts for
research.
菲沙研究所的願景乃一自由而昌盛的世界,當中每個人得以從
更豐富的選擇、具競爭性的市場及自我承擔責任而獲益。我們
的使命在於量度、研究並使人知悉競爭市場及政府干預對個人
福祉的影響。
Nous envisageons un monde libre et prospère, où chaque personne
bénéficie d’un plus grand choix, de marchés concurrentiels et de res-
ponsabilités individuelles. Notre mission consiste à mesurer, à étudier
et à communiquer l’effet des marchés concurrentiels et des interven-
tions gouvernementales sur le bien-être des individus.
Nuestra visión es un mundo libre y próspero donde los individuos se
beneficien de una mayor oferta, la competencia en los mercados y la
responsabilidad individual. Nuestra misión es medir, estudiar y comu-
nicar el impacto de la competencia en los mercados y la intervención
gubernamental en el bienestar de los individuos.
266 Canadian Health Policy Failures
Fraser Institute | www.fraserinstitute.org
Prof. Armen Alchian
Prof. Terry Anderson
Prof. Robert Barro
Prof. Michael Bliss
Prof. James M. Buchanan†
Prof. Jean-Pierre Centi
Prof. omas J. Courchene**
Prof. John Chant
Prof. Bev Dahlby
Prof. Erwin Diewert
Prof. Stephen Easton
Prof. J.C. Herbert Emery
Prof. Jack L. Granatstein
Prof. Herbert G. Grubel
Prof. Friedrich A. Hayek* †
Prof. James Gwartney
Prof. H.G. Johnson*
Prof. Ronald W. Jones
Dr. Jerry Jordan
Prof. David Laidler**
Prof. Richard G. Lipsey**
Prof. Ross McKitrick
Prof. Michael Parkin
Prof. F.G. Pennance*
Prof. Friedrich Schneider
Prof. L.B. Smith
Prof. George Stigler* †
Mr. Vito Tanzi
Sir Alan Walters
Prof. Edwin G. West*
Editorial Advisory Board
* deceased; ** withdrawn;
†
Nobel Laureate
