
Arkansas Tech University Arkansas Tech University
Online Research Commons @ ATU Online Research Commons @ ATU
ATU Theses and Dissertations 2021 - Present Student Research and Publications
Winter 12-16-2023
The Relationship Between Student Engagement And ACT Aspire The Relationship Between Student Engagement And ACT Aspire
Reading Scores Among Ninth-Grade Students In One Northwest Reading Scores Among Ninth-Grade Students In One Northwest
Arkansas Junior High School Arkansas Junior High School
Dwight Vincent Jr.
Arkansas Tech University
Follow this and additional works at: https://orc.library.atu.edu/etds_2021
Part of the Educational Leadership Commons
Recommended Citation Recommended Citation
Vincent, Dwight Jr., "The Relationship Between Student Engagement And ACT Aspire Reading Scores
Among Ninth-Grade Students In One Northwest Arkansas Junior High School" (2023).
ATU Theses and
Dissertations 2021 - Present
. 53.
https://orc.library.atu.edu/etds_2021/53
This Dissertation is brought to you for free and open access by the Student Research and Publications at Online
Research Commons @ ATU. It has been accepted for inclusion in ATU Theses and Dissertations 2021 - Present by
an authorized administrator of Online Research Commons @ ATU. For more information, please contact
THE RELATIONSHIP BETWEEN STUDENT ENGAGEMENT AND ACT ASPIRE
READING SCORES AMONG NINTH-GRADE STUDENTS IN ONE
NORTHWEST ARKANSAS JUNIOR HIGH SCHOOL
By
DWIGHT VINCENT, JR.
Submitted to the Faculty of the Graduate College of
Arkansas Tech University
in partial fulfillment of the requirements
for the degree of
DOCTOR OF EDUCATION IN SCHOOL LEADERSHIP
December 2023
© 2023, Dwight Vincent, Jr.
ii
DEDICATION
I would like to thank my parents, Dwight and Melissia Vincent, and my sister
April Vincent, for always loving, encouraging, and supporting me. Also, I was blessed
with a second set of parents. I want to thank my Uncle Fred and Aunt Marilyn for the
impact that they have had on my life. I also want to thank Aunt B for being such a special
auntie. Lastly, I want to dedicate this dissertation, this doctoral degree, and my career to
my brother, Frank Watson. Frank passed away in November of 2022 while I was in this
program. I thought about quitting, but I knew Frank would want me to finish, so I
finished this program in honor of him. I have always been proud to be his little brother. I
know Frank is proud of me for finishing this program. I want to say thank you to Frank
for showing me, and everyone who knew him, how to live life.
iii
ACKNOWLEDGEMENTS
I would like to thank God for bringing me to this place and this time in my life to
finish this dissertation and earn a terminal degree in education. I would like to thank Dr.
John Freeman for his patience, guidance, and for helping me get to the finish line. I
would also like to thank Dr. Steve Bounds for serving on my committee. I would like to
thank Rickey Hicks, who I met in 2014 while we were both coaching at Parkview.
Rickey Hicks has proven to be a true friend, and I am thankful for the impact he has had
on my personal and professional growth over the last nine years. I hope that one day, we
work in the same district together again in some capacity. I would like to thank my
childhood friends for their friendship and for our brotherhood. I would like to thank Dr.
Jeff Flanigan for pushing me to pursue a terminal degree in the first place. I met Dr. Jeff
Flanigan in the summer of 2013 when we were both coaching in the Blytheville School
District. In our very first conversation, he told me to “play chess, not checkers.” My first
chess move was that I listened to his advice, and I’ve been listening to his advice ever
since. Thank you for being a true friend and mentor to me as I navigate my career as an
educator. I would not have earned my last three degrees, including this doctoral degree, if
I had not met him. Now that I have earned this terminal degree, I can rightfully say,
“checkmate.”
iv
ABSTRACT
THE RELATIONSHIP BETWEEN STUDENT ENGAGEMENT AND ACT ASPIRE
READING SCORES AMONG NINTH-GRADE STUDENTS IN ONE
NORTHWEST ARKANSAS JUNIOR HIGH SCHOOL
Dwight Vincent, Jr.
The purpose of this study was to examine the relationship between academic
achievement and attendance. Reading proficiency is foundational to overall academic
success. In this study, reading proficiency served as the operational definition for the
level of student academic success. Out-of-school suspension is a disciplinary
consequence as a result of student behavior and correlates to student attendance. This
quantitative, correlational study examined the relationship between student engagement,
as defined by student attendance and discipline, and reading proficiency, as measured by
the 2021-22 ACT Aspire Reading scores for ninth-grade students in one northwest
Arkansas junior high school.
Descriptive data analysis was conducted to show the demographic makeup of the
school and the frequencies and means of attendance and discipline data. Raw scores for
the ACT Aspire Reading Assessment were used as a measure of student academic
success. Using Spearman Rho and multiple linear regression analysis, the results of this
study revealed the effect of chronic absenteeism on the reading proficiency of these
ninth-grade students in one Northwest Arkansas junior high school. Three regression
models were formulated using student attendance, gender, and ethnicity as predictor
variables, with a combined 11.6% explanation for the variance in the reading scores.
While the analysis indicated that attendance, gender, and ethnicity predicted reading
scores, student discipline was removed from the regression analysis as a predictor
variable.
Conclusions from the research include that out-of-school suspensions have a
negative effect on reading proficiency due to their increasing student attendance.
Discipline alone did not appear to affect reading proficiency and academic achievement
significantly. The results support previous research in this field, indicating that students
with higher attendance tend to have better reading proficiency. This research suggests
that school leaders must provide alternatives to out-of-school suspensions and find
solutions to negative student behavior to increase instructional time. This research
contributes to the ongoing dialogue surrounding the negative academic impact of low
attendance, exacerbated by out-of-school suspensions and academic achievement.
Keywords: academic achievement, attendance, chronic absenteeism, ethnicity, gender,
lost instructional time, moderate absenteeism, out-of-school suspension, reading
proficiency, school discipline
TABLE OF CONTENTS
Page
DEDICATION……………………………………………………………………………. ii
ACKNOWLEDGMENTS……………………………………………………………….. iii
ABSTRACT……………………………………………………………………………... iv
LIST OF TABLES………………………………………………………………………... x
LIST OF FIGURES……………………………………………………………………… xi
I. INTRODUCTION……………………………………………………………………… 1
Background of the Problem………………………………………………………. 4
Statement of the Problem…………………………………………………………. 6
Purpose Statement………………………………………………………………… 6
Conceptual Framework…………………………………………………………… 7
Research Methods and Design Overview………………………………………… 7
Research Questions and Hypotheses……………………………………………... 8
Significance of the Study…………………………………………………………. 9
Delimitations…………………………………………………………………….. 10
Limitations………………………………………………………………………. 10
Definitions of Key Terms……………………………………………………... 10
Assumptions……………………………………………………………………... 14
Chapter Summary……………………………………………………………….. 14
Organization of the Study……………………………………………………….. 15
II. REVIEW OF THE LITERATURE…………………………………………………... 17
At-Risk Students and School Accountability…………………………………… 17
Affective, Cognitive, and Behavioral Student Engagement…………………….. 18
Accountability in Arkansas Schools…………………………………………….. 20
School Performance……………………………………………………... 20
School Quality and Student Success…………………………………….. 21
Student Engagement…………………………………………………….. 22
Reading at Grade Level…………………………………………………. 22
The American College Test……………………………………………... 23
The ACT Readiness Benchmark………………………………………… 24
The 2.8 GPA on a 4.0 Scale……………………………………………... 24
On-time Credits………………………………………………………….. 25
Advanced Placement, International Baccalaureate, or Concurrent Credit
Courses…………………………………………………………… 25
Student Attendance and Student Engagement…………………………………... 25
Student Discipline and Student Engagement……………………………………. 28
Attendance and Reading Scores………………………………………………….30
Effects of Lost Instructional Time on Reading Scores Due to Discipline………. 32
Chapter Summary……………………………………………………………….. 32
III. METHODOLOGY………………………………………………………………….. 34
Research Questions and Hypotheses……………………………………………. 35
Research Methodology………………………………………………………….. 36
Research Design………………………………………………………………….36
Population and Sample………………………………………………………….. 37
Setting…………………………………………………………………………… 38
Instrumentation………………………………………………………………….. 39
Data Sources…………………………………………………………………….. 40
Operational Definitions of Variables……………………………………………. 41
Data Collection………………………………………………………………….. 41
Data Analysis……………………………………………………………………. 42
Assumptions……………………………………………………………………... 44
Ethical Assurances………………………………………………………………. 45
Chapter Summary……………………………………………………………….. 45
IV. DATA ANALYSIS AND RESULTS……………………………………………... 46
Descriptive Results……………………………………………………………… 47
Data Collection………………………………………………………………….. 50
Data Analysis……………………………………………………………………. 50
Results…………………………………………………………………………… 51
Research Question 1 (RQ1)....................................................................... 51
Research Question 2 (RQ2)....................................................................... 55
Research Question 3 (RQ3)....................................................................... 56
Chapter Summary……………………………………………………………….. 63
V. CONCLUSIONS, IMPLICATIONS, AND RECOMMENDATIONS……………. 65
Summary of Results……………………………………………………………... 65
Implications for Educational Practice…………………………………………… 68
Recommendations for Educational Practice…………………………………….. 69
Recommendations for Future Research…………………………………………. 71
Study Summary………………………………………………………………….. 72
REFERENCES………………………………………………………………………….. 74
APPENDICES…………………………………………………………………………... 82
Appendix A: ATU IRB Approval Letter……………………………………… 83
Appendix B: District Approval to Conduct Study………………………………. 84
x
LIST OF TABLES
Table Page
1: Sample Population by Ethnicity and Gender…………………………………………. 39
2: Variables Analyzed and Statistical Analysis Used for Each Research Question…….. 43
3: Number of Chronic Absentees by Ethnicity and Gender…………………………….. 48
4: Number of Suspensions by Ethnicity and Gender……………………………………. 49
5: Correlation Results for Attendance and ACT Aspire Reading Scores……………….. 55
6: Correlation Results for Suspensions and ACT Aspire Reading Scores………………. 57
7: Coefficients for Regression Models………………………………………………….. 60
8: ANOVA Results for Regression Models……………………………………………... 62
9: Model Summary……………………………………………………………………… 63
xi
LIST OF FIGURES
Figure Page
1: Histogram Showing the Distribution of Attendance Data……………………………. 52
2: Histogram Showing the Distribution of ACT Aspire Reading Scores……………….. 53
3: Scatterplot of Attendance and ACT Aspire Reading Scores…………………………. 54
4: Scatterplot of Suspensions and ACT Aspire Reading Scores…………………………55
5: Scatterplot of z Prediction and z Residual Scores for ACT Aspire Reading…………. 58
6: Histogram Showing the Distribution of Unstandardized Residuals for ACT Aspire
Reading Scores………………………………………………………………………...61
1
CHAPTER I
INTRODUCTION
U.S. public education faces many obstacles in preparing all students to succeed
academically. The recent COVID-19 epidemic exacerbated obstacles that were already
existent in the schools by forcing an ill-prepared transition to online instruction. As the
nation returns to some semblance of normalcy in the schools, it is predicted that the
effects of the pandemic on student academic performance may be felt for years to come.
The immediate effects can be seen in the 2022 National Assessment of Educational
Progress (NAEP) results, which show the most significant decrease in scores nationally
since the assessment began.
Contrary to post-COVID education concerns, U.S. public schools struggled before
the pandemic. A litany of obstacles can be cited for poor academic performance. The
pandemic made it even more challenging to deal with those obstacles. Poverty, low
attendance, and discipline problems were just a few of the obstacles already contributing
to low academic performance at all grade levels, nationally and in Arkansas.
Student engagement is one obstacle that profoundly impacts academic success
(Varjas et al., 2009). If a student is not present and engaged during the teaching/learning
process, it becomes impossible for that student to succeed. While the research literature
regarding student engagement is vast and includes many variables, this study sought to
view student engagement in its most elemental state: attendance and discipline.
Identifying student engagement as the number of days the student is present at
school, compounded by the number of discipline referrals, provides evidence of how
engaged the student is with the school and his/her teachers and is actively contributing to
2
their academic success. Attendance and discipline referrals often affect at-risk students to
a higher degree because those students are already facing other issues unrelated to the
school environment that act as obstacles to academic success (Vargas et al., 2009).
Many issues, such as illness or lack of parental supervision, impact student
attendance. In truth, many legitimate issues related to attendance are outside the school's
control. However, one issue that is within the school’s control and may affect attendance
is the school’s discipline policy. If suspension or expulsion is a part of the punitive results
of various violations of the school’s discipline policy, then the policy contributes to the
low attendance problem. In effect, disciplinary punishment such as out-of-school
suspension, expulsion, and in-school suspension acts as covariates to attendance.
Disciplinary policies are developed at the district and school levels to provide
rules for maintaining an orderly learning environment. Students and parents are provided
access to a student policy handbook by the school administrators outlining those rules
and the consequences or penalties for breaking those rules. In many cases, the
disciplinary policies do not solve the underlying causes of disruptive behavior that leads
to suspension or expulsion (Tyre et al., 2011).
The impact of suspension and expulsion on the student’s academic success is
most pronounced in lost instructional time. Since at-risk students are often more likely to
engage in conduct that violates school rules, they also lose the most instructional time.
For example, students struggling with tardiness and absenteeism are often given
consequences such as detention, in-school suspension, or out-of-school suspension.
Tardiness and absenteeism result in lost instructional time, and the consequences for
3
violating school rules compound the issue by adding to lost instructional time (Tyre et al.,
2011).
Poverty is another obstacle to student academic success, contributing to student
attendance issues (D’Agostino et al., 2018). A student who lives in a low-income
environment may have more stress outside of the classroom due to home and
neighborhood factors, including drug use, violence, abuse, secondhand smoke, neglect,
and low academic expectations. Low-income students often have fewer academic
resources at home, such as a safe and quiet place to study, reliable home internet, or food
insecurity (D’Agostino et al., 2018). These factors can contribute to a student’s
disengagement from the learning process while at school and lead to higher rates of
absenteeism and discipline referrals.
Additionally, because of food insecurity and the threat of homelessness, students
missing school to work is prevalent in high-poverty areas (D’Agostino et al., 2018). The
extra income a teenager can bring home reduces the financial stress on the household,
and this often takes precedence over attending school. This issue is compounded in the
case of the teen parent. Teen parents are most common among teenagers who come from
low-income families (Shane, 1991).
Students who are teen parents often settle for entry-level income that does not
require a high school diploma over staying in school to earn a diploma. Data shows that
teen parents are less likely to attend and graduate from a postsecondary institution
(Shane, 1991). These issues surrounding poverty put the student at risk for poor academic
performance, affecting the student’s attendance, discipline, and ability to succeed in
school.
4
Background of the Problem
An at-risk student is a student who has a predisposition for poor academic
performance based on any number of factors (Rieg, 2007). Some of these factors include
living in a single-parent home, being a minority, having limited English language
proficiency, receiving at least one academic intervention, frequent absenteeism, retention
in one or more grades, severe behavior problems, low academic performance, low
socioeconomic status, and drug and alcohol use (Rieg, 2007). Concerning attendance and
discipline, a student who has missed 10% or more of the school year falls under chronic
absenteeism (Learning, 2022). This includes excused absences, unexcused absences, and
absences due to suspension.
More than 20% of students in the U.S. are chronically absent, with 10% of
Arkansas students being identified as such (Learning, 2022). Northwest Arkansas's
diverse student population mirrors that statewide average of 10% chronic absenteeism.
Chronic absenteeism means lost instructional time, which, in turn, directly affects student
academic success (Roby, 2004).
The National Assessment of Educational Progress (NAEP), or The Nation’s
Report Card, is a standardized test given to fourth-, eighth-, and twelfth-graders to
measure their academic achievement in Reading, Math, and Science. The 2022 NAEP
results show that nationally, only 29% of eighth graders read proficiently on grade level,
while only 26% of Arkansas eighth graders were proficient in reading.
As a result of poor attendance and discipline, a student who does not read on
grade level usually struggles with content in every other subject area. If the student is not
reading on grade level, the student does not have the academic foundation to be
5
successful on grade level in any other subject. Mathematics primarily deals with
numbers, but students must be able to read at grade level to understand instructions for
mathematics assignments. Every other core subject is reading intensive, including
English Language Arts, Social Studies, and Science. Reading achievement strongly
correlates to overall academic success (Baysu et al., 2023).
The Arkansas Department of Education uses a formula that produces a school
letter grade to determine a school’s effectiveness (Learning, 2023). Formulating school
letter grades is an intricate process, with 17 modules contributing to a formula
determining a letter grade (Learning, 2023). The modules measure various aspects of the
school, including student attendance, teacher quality, student performance on
standardized tests, school safety, and student discipline, to name a few data sources
(Learning, 2023).
Of the 17 school report card modules, this research study included the three
indicators most closely related to student engagement. These three modules are School
Quality and Student Success, School Performance, and School Environment (Learning,
2023). These three modules relate to the research on student engagement and align with
the independent variables, attendance and discipline, and the dependent variable, ACT
Aspire reading test scores.
From an administrative standpoint, school leaders must understand that many of
our students need parental support and encouragement to perform well academically
(Allensworth & Evans, 2016). An administrator must have effective interventions to
improve student engagement for students who typically have disproportionately low
attendance and disproportionately high discipline referrals (Montero-Sieburth & Turcatti,
6
2022). With that, this research attempted to show the relationship and predictability of
attendance and discipline as a measure of student engagement in a Northwest Arkansas
junior high school on ninth-grade ACT Aspire Reading scores.
Statement of the Problem
Student engagement reflects a student's passion or motivation to succeed
academically. It is reflected in the quality of a student’s relationship with family, school
staff, and peers (Li & Xue, 2023; Montero-Sieburth, 2022). It can also be reflected in the
student's effort to double-check school work after completion, seek tutoring, and extend
learning beyond the classroom (Shin & Bolkan, 2021). It reflects the student’s perception
of the relevance of the curriculum and school to the student’s life outside and after high
school (Rose & Bowen, 2021). If student engagement is low or non-existent, it can be
predicted that student academic success will suffer. Therefore, the problem addressed by
this study was to determine the relationship between student engagement and academic
success as measured by scores on the ninth-grade ACT Aspire Reading scores for one
Northwest Arkansas junior high school.
For this study, student engagement was operationally defined by the level of
attendance and disciplinary referrals by ninth-grade students in the participating junior
high school and served as the independent variables. Academic success was measured by
ACT Aspire Reading Assessment scores that served as the dependent variable.
Purpose Statement
This study aimed to examine the relationship between student engagement, as
measured by the level of student attendance and disciplinary referrals, and the reading
scores for these participating ninth-grade junior high school students. Students in
7
Arkansas public schools are required to take a standardized test, the ACT Aspire, which
measures reading ability. Considering attendance data, discipline data, and ACT Aspire
reading scores, the study aimed to show the correlation between student engagement and
reading. Since reading comprehension indicates overall academic achievement (Beluce et
al., 2018), if reading scores are suffering, finding solutions to the causes of those low
scores is incumbent upon schools. Therefore, if high absenteeism and discipline referrals
are one of the causes of low reading scores, administrators can focus on solutions to
absenteeism and discipline issues.
Conceptual Framework
Student engagement is a construct that affects academic achievement (Williams et
al., 2023). Recent research characterizes student engagement as the relationships with
peers, sponsors, teachers, and athletic coaches (Williams et al., 2023). These relationships
make up the affective aspect of student engagement. Behavioral engagement comprises
aspects of student engagement such as attendance, behavior, and discipline. Lastly,
feelings of motivation and a sense of belonging constitute cognitive engagement.
Cognitive engagement is essential because a positive relationship exists between
student interest in the curriculum and engagement in learning activities associated with
that given curriculum (Williams et al., 2023). This is further relevant because students
can perform better with a curriculum they are not necessarily interested in if there is some
other aspect of school, namely extracurricular activities, holding the students’ interest.
Research Methods and Design Overview
This quantitative study obtained student engagement data from the 2021-22
academic year for ninth-grade students at one Northwest Arkansas junior high school in
8
the form of attendance and discipline data. The data were retrieved from the school’s
student information system (SIS). The collection of student attendance and discipline data
allowed the examination of the level of student engagement.
Academic achievement was measured by examining ACT Aspire reading scores
for all ninth-grade students at one Northwest Arkansas junior high school. ACT Aspire
Reading scores broken down by demographics allowed for further examination of
academic achievement by gender and ethnicity.
Research Questions and Hypotheses
The purpose of this study was to determine the relationship between student
engagement as defined by the number of days of attendance and discipline referrals
during the 2021-22 school year for the ninth-grade students in one Northwest Arkansas
junior high school and student academic success as measured by raw scores on the ACT
Aspire Reading Assessment. The following research questions and hypotheses guided the
study:
RQ1: Is there a statistically significant relationship between student attendance and ninth-
grade ACT Aspire Reading scores in the participating Northwest Arkansas junior high
school?
H
0
1: There is no statistically significant relationship between student attendance and
ninth-grade ACT Aspire Reading scores in the participating Northwest Arkansas junior
high school.
RQ2: Is there a statistically significant relationship between student discipline and ninth-
grade ACT Aspire Reading scores in the participating Northwest Arkansas junior high
school?
9
H
0
2: There is no statistically significant relationship between student discipline and
ninth-grade ACT Aspire Reading scores in the participating Northwest Arkansas junior
high school.
RQ3: Do attendance, discipline, gender, and ethnicity predict ninth-grade ACT Aspire
Reading scores in the participating Northwest Arkansas junior high school?
H
0
3: Attendance, discipline, gender, and ethnicity do not predict ninth-grade ACT Aspire
Reading scores in the participating Northwest Arkansas junior high school.
Significance of the Study
The significance of this study lies in the results that may contribute to the vast
literature relating to student engagement and its impact on student academic success. For
the school participating in this study, it reflected how those ninth-grade students are
performing academically and how their level of student engagement is impacting that
success or lack of success. The results may provide this school and other similar schools
with a better understanding of how these variables relate and provide an impetus for
administrators and teachers to develop ways to increase student engagement and improve
student academic success. In addition, by including gender and ethnicity in the analysis, it
provided information that may assist in personalizing support based on the individualized
needs of students through disaggregation of data.
Reading scores were used in this study to reflect overall student academic success
due to the importance that reading ability plays in overall learning (Bowers & Schwarz,
2018). Chronically absent students have experienced so much learning loss that grade-
level reading standards become more challenging to maintain, regardless of individual
subject area (Bowers & Schwarz, 2018). This study sought to determine how detrimental
10
chronic absenteeism is to academic achievement and the importance of students being
present in the classroom.
Finally, this study may contribute to existing knowledge by advising educators
and parents that students perform better if they have good attendance and discipline rates,
thereby leading these stakeholders to seek solutions to the problem of low attendance
rates and reducing the number of discipline referrals in the schools.
Delimitations
This study examined and collected data from one grade level of one junior high
school in one area of Arkansas. The study does not account for additional outside
influences that may impact the standardized testing data collected, such as socioeconomic
status and quality of home life. The scores that were used are from ninth grade only. The
demographics only include gender and ethnicity. The indicators only include attendance
and discipline.
Limitations
The scope of this study was narrow, and the results may not be generalizable to
other geographical locations with differing demographics. Therefore, the results may only
reflect the school that participated in the study. Although the results may partially align
with other geographical areas of Arkansas, the process and investigative direction are
transferable.
Definitions of Terms
● ACT Aspire: end-of-year online summative assessment for grades 3-10 in English,
Reading, Math, Science, and Writing (Learning Services, 2022).
11
● Affective engagement: the emotional value a student holds toward their education.
This can be affected by curriculum interest, safety, relationships with teachers and
peers, parent support, a sense of belonging, and the perception of school as
valuable (Fisher & Frey, 2021).
● American College Testing (ACT): A standardized college admissions test that
comprises four subject areas, including English, Math, Reading, and Science.
Scoring ranges from one to thirty-six.
● At-risk students: students who have specific demographic characteristics such as
living in a single-parent home, being a minority, having limited English language
proficiency, receiving at least one academic intervention, frequent absenteeism,
retention in one or more grades, severe behavior problems, low academic
performance, low socioeconomic status, and drug and alcohol use are indicators
of an at-risk student (Rieg, 2007).
● Behavioral engagement: the observable act of students involved in learning,
characterized by school attendance, class participation, and classroom behavior
(Fisher & Frey, 2021).
● Breadth of involvement: the number of extracurricular activities a student
participates in.
● Child nutrition: federally assisted meal program operating in public and nonprofit
private schools and residential child care institutions. It provides children
nutritionally balanced, low-cost, or free breakfast and lunch each school day.
12
● Co-curricular activity: a school-sponsored activity, program, or learning
experience that complements the school’s academic curriculum (Abro et al.,
2018).
● Cognitive engagement: the extent to which students are willing and able to take
on the learning task (Fisher & Frey, 2021). This can be demonstrated through
time investment in learning.
● Culturally responsive instruction: using students’ customs, characteristics,
experience, and perspectives to improve classroom instruction.
● Depth of involvement: the amount of time or intensity level a student dedicates to
an extracurricular activity
● Effective school: an effective school has received an A or B letter grade from the
Arkansas Department of Education
● Extracurricular activity: a school-sponsored activity that students are
productively involved with outside of the classroom, including academic (i.e.,
performing arts, student government, and yearbook) and nonacademic (i.e.,
sports, vocational clubs, service clubs, and hobby clubs) (Palmer et al., 2017).
● Literacy: the student’s ability to read and write, often identified by a standardized
assessment
● Local control: a school part of a school district that is governed by a locally
elected school board
● Low achieving: for this study, a low achieving school has received a D or an F
letter grade from the Arkansas Department of Education based on the seventeen
modules used to produce a letter grade (Learning Services, 2022)
13
● Poverty: poverty can be defined as follows: (a) based on the federal government’s
formula of the poverty line, (b) based on free and reduced lunch formulas that
vary from state to state, or (c) based on particular characteristics and situations
people find themselves in because of the amount of monetary and related material
capital they have or lack (Burney & Beilke, 2008).
● School safety: schools and school-related activities where students are safe from
violence, bullying, harassment, the sale or use of illegal substances on school
grounds, and other emergencies.
● School turnaround: “Turnaround” refers to quickly realizing academic
achievement in schools that have long been failing schools (Peck & Reitzug,
2014).
● Secondary schools: For this study, a secondary school is a school that serves
grades 9-12 (Danzig & Aljarrah, 1999).
● Social-emotional learning: a methodology that helps students better comprehend
their emotions and demonstrate empathy for others
● State control: a school part of a district identified as low achieving by the
Arkansas Department of Education (ADE) for three consecutive years. ADE has
dissolved the locally elected school board.
● Student engagement: the student’s degree of interest in their education,
identifiable by data indicators such as attendance, discipline, and academic
achievement (Dickinson et al., 2021) (Li et al., 2023).

14
Assumptions
Student attendance and student discipline make up student engagement. Student
achievement improves as student engagement improves. This is true regardless of the
ethnicity and gender of students. Reading proficiency is an indicator of overall academic
achievement. Even for math, students must understand the instructions to perform math
operations. All other core subjects are reading intensive, including English Language
Arts, Science, and Social Studies. For this reason, reading proficiency indicates overall
academic achievement, which is why ACT Aspire Reading scores were included in this
research. The data provided included all students' best efforts in taking the reading ACT
Aspire Assessments.
Chapter Summary
Student engagement reflects a student’s passion or interest level toward their
education (Li & Xue, 2023). Student engagement can be reflected in the quality of a
student’s relationship with family, school staff, and peers (Montero-Sieburth & Turcatti,
2022). In terms of school data, student engagement can be measured using attendance
data and discipline data. Discipline data are relevant to attendance data because
disciplinary consequences often include removing the student from the classroom
(Kennedy-Lewis & Murphy, 2016).
A suspension is an example of discipline data that includes removing the student
from the classroom (Kennedy-Lewis & Murphy, 2016). This is significant because
students often receive different instruction quality while suspended, contributing to
learning loss. Learning loss occurs when the student does not receive learning
opportunities in the classroom (Kennedy-Lewis & Murphy, 2016).
15
Student engagement was determined by student attendance and discipline referral
data. Students absent less than five percent of the school year were at a low risk of
chronic absenteeism. Students absent from 5% up to 10% of the school year were at
moderate risk of chronic absenteeism. Students who were absent 10% or more of the
school year were considered to be in the category of chronic absenteeism. As it related to
this study, student discipline was associated with absenteeism. The number of out-of-
school suspension days due to student discipline was a construct in this study.
Organization of the Study
This correlational, quantitative study disaggregated student engagement data for
ninth-grade students at a northwest Arkansas junior high school from the school’s student
information system (SIS). These data were from the 2021-2022 school year to identify
possible trends between attendance, discipline, and academic achievement. Academic
achievement was explicitly measured by examining ACT Aspire reading scores. The
collection of student attendance and discipline data from the school’s student information
system (SIS) allowed for the examination of the level of student engagement, while ACT
Aspire Reading scores broken down by demographics permitted the analysis of academic
achievement by gender and ethnicity.
In Chapter 2, the researcher reviewed relevant literature covering the following
topics: ACT Aspire, literacy, student engagement, student attendance, and student
discipline. The ACT Aspire is a summative assessment that tests students in
Mathematics, English Language Arts, Science, Reading, and Writing. As per this study,
literacy was the degree to which students tested in Reading.
16
In Chapter 3, the researcher describes the research design and methods used to
conduct the study. This quantitative study examined data from the school’s student
information system (SIS) and ACT Aspire testing portal. These databases provided
student demographic data, ethnicity, and gender without identifying individual students
by name. The data were collected from the most recent testing window during the 2021-
2022 school year to identify possible relationships between student attendance, student
discipline, and ACT Aspire reading scores by ethnicity and gender. The data collection
from the most recent school year's testing window allowed for the timeliest data available
about this school. The chapter also details the instrumentation, data analysis, and results
from the study.
In Chapter 4, the researcher presents the results from the statistical analysis and
how those results addressed the three guiding research questions. Chapter 5 presents the
conclusions and implications of those results and provides recommendations for practice
for school leaders and further study. Finally, the researcher provides an overall summary
and reflection on the study in that chapter.
17
CHAPTER II
REVIEW OF THE LITERATURE
The literature review was organized to reflect the relationship between student
engagement, reading proficiency, and overall academic achievement across subgroups.
EBSCOHost was used to locate peer-reviewed articles using search terms applicable to
the research. These terms included student engagement, attendance, absenteeism, chronic
absenteeism, at-risk, discipline, out-of-school suspension, reading comprehension,
reading proficiency, and lost instructional time. Research related to student engagement,
absenteeism, and chronic absenteeism were reviewed in relation to student attendance.
The terms at-risk, discipline, and out-of-school suspension also affect attendance through
consequences of student behavior. Absenteeism due to student behavior, in turn, affects
reading comprehension, reading proficiency, and overall academic achievement.
At-Risk Students and School Accountability
Much research has been conducted on at-risk students and school accountability.
An at-risk student has specific predispositions usually align with lower academic
achievement (Rury et al., 2022). These predispositions include coming from a single-
parent home, being a minority, having low socioeconomic status, being an English
language learner, having been previously retained, frequent absenteeism, severe behavior
problems, homelessness, and teen parenthood (Rury et al., 2022).
Along the same lines, a school with a high percentage of at-risk students will need
more intensive support to meet its at-risk students' needs. These supports include safety
and security at school, meal programs, academic intervention, social and emotional
instruction, and adequate housing (Hughes & Adera, 2006).
18
Concerning school accountability in Arkansas, the school environment, student
performance in response to academic intervention, and student performance in response
to social and emotional instruction are all school accountability measures (Lasater et al.,
2021). The performance of at-risk students has been studied, but this research focused on
how at-risk students affect school accountability from the lens of student engagement.
Affective, Cognitive, and Behavioral Student Engagement
Affective, behavioral, and cognitive engagement are types of student engagement
with distinct characteristics (Fisher & Frey, 2021). Research shows a strong correlation
between affective, behavioral, and cognitive engagement and academic achievement.
Affective engagement concerns students' emotional value toward their education (Fisher
& Frey, 2021). This is not to be confused with social-emotional learning, which involves
teaching students’ general emotional maturity, not necessarily toward curriculum or
school (Neth et al., 2020).
One aspect of affective engagement is the student’s interest in the curriculum
(Fisher & Frey, 2021). Best practices call for teachers to use instructional strategies that
engage student interests regardless of ethnicity, gender, and other identifiers (Abacioglu
et al., 2020). This is culturally responsive teaching (Abacioglu et al., 2020). At the same
time, the curriculum is the curriculum, and students have a particular intrinsic motivation
to want to learn it. Intrinsic motivation can fluctuate and can be positively affected by a
healthy extracurricular activity experience (Daniels, 2017).
Safety is another facet of affective engagement (Fisher & Frey, 2021). Students
face many issues regarding school safety, including bullying, cyberbullying, and the
school's physical environment (Varjas et al., 2009). Students feel safe at school, which
19
has a physical component addressed by school staff and an emotional component built
through extracurricular activity participation (Varjas et al., 2009). One of the most
impactful aspects of affective engagement is the relationship-building students'
experience with staff and peers (Li et al., 2022). These relationships create a sense of
belonging, intrinsic motivation, and value in school because of the relationships created
there (Li et al., 2022).
Behavioral engagement is the observable act of students involved in learning.
Behavioral engagement is characterized by attendance and behavior (Fisher & Frey,
2021). Concerning extracurricular activities, there is usually an attendance requirement
and a behavior requirement to participate (Shaffer, 2019). Naturally, students
participating in extracurricular activities tend to have a higher attendance rate and a lower
rate of discipline infractions than students who do not participate in extracurricular
activities (Shaffer, 2019).
Cognitive engagement is the extent to which students are willing and able to take
on the learning task (Fisher & Frey, 2021). Extracurricular activities serve as a
motivational factor for some students in the sense that students understand they must put
forth effort in the classroom to be able to participate in extracurricular activities (Power et
al., 2009). Students may also find themselves in before-school, after-school, or weekend
tutoring to maintain eligibility for extracurricular activity participation (Power et al.,
2009). Either way, students participating in extracurricular activities display academic
behaviors consistent with a student who intends to stay in school, unlike academic
behaviors of students at risk of dropping out of school (Power et al., 2009).
20
This study investigated affective, behavioral, and cognitive engagement and how
these three engagement types impact academic outcomes through the scope of
extracurricular activity participation. The study examined whether extracurricular
activities sharpen students' affective, behavioral, and cognitive engagement outcomes.
Accountability in Arkansas Schools
School Performance
All Arkansas schools serving grades 3-10 must administer the ACT Aspire. This
summative assessment is given at the end of the school year in a specific testing window
that begins in April and ends in May. Students are tested in English, Reading, Math,
Science, and Writing. Schools should aim to test every student in their respective grade,
with a grace of 5%, meaning schools should test 95% of students in all five areas in every
grade that the school serves from grades 3-10. Schools have flexibility within a testing
window, and all five tests take approximately five hours to complete. Schools must also
offer accessibility features for all students.
This is usually not a problem as there are Arkansas state and federal requirements
for schools to offer these features to students any other day of the school year. Schools
must also provide accommodations for qualifying students. Like accessibility features,
schools already offer accommodations to qualifying students, so there will be no changes
concerning ACT Aspire testing. With any other school-wide function, the best practice in
the administration of the ACT Aspire is for the Special Education teachers and Special
Education director to be involved in the planning process (Essex, 1962).
Schools receive a predicted score for the ACT for students in grades 7-10 based
on the student’s performances on the five parts of the ACT Aspire. After receiving these
21
data, the best practice is for schools to provide ACT Prep interventions based on the
student’s needs in each subject area (Ray & Graham, 2021). There are a few ways that
high school students can receive ACT Prep intervention support. Virtual Arkansas offers
a course entitled ACT Prep Resources. This course includes diagnostics tests, drills,
videos, and content aligned to the reading, writing, math, science, and English portions of
the ACT. Many high schools offer summer ACT Prep courses.
Teachers provide intervention in reading, writing, math, science, and English so
that students have a deeper understanding of standards for these content areas. Many
colleges and universities also offer free ACT prep summer courses. This serves students
by putting them in a position to score better on the ACT and as a recruiting tool for these
postsecondary institutions. ACT offers learning tools and a practice test for students
interested in scoring higher on the ACT.
According to the modules, this applies to the college readiness module in keeping
with school improvement. Consequently, this is an example of modules being
interdependent upon one another and having an exponential effect on the overall school
letter grade. Lastly, schools must set their ACT Aspire testing schedule within the testing
window.
School Quality and Student Success
There are 11 indicators used to determine school quality and student success. The
indicators are on a point system. Higher school quality indicators receive more points,
while lower ones receive fewer. Schools receive a total score based on the points
accumulated by each student. Points are accumulated for each student for each indicator
22
to produce a mean score, which is then used to calculate a value for overall school quality
and student success.
Student Engagement
Concerning the Arkansas Department of Education, student engagement is the
first indicator of school quality and student success. Student engagement measures
absenteeism. One point is assigned for each student absent less than 5% of the school
year. This student is considered low-risk. Half a point is given for each absent student,
anywhere from 5% to 10% of the school year. This student is considered a moderate risk.
Zero points are assigned for the absent student for over 10% of the school year. Points are
accumulated for each student for this indicator to produce a mean score, which is then
used to calculate a value for overall school quality and student success.
Concerning the operational definition of student engagement, attendance and
discipline are the two indicators of student engagement. Attendance refers to the presence
or absence of the student at school and in the classroom. Discipline data is relevant
because it often affects attendance. Discipline consequences that affect attendance
include detention, in-school suspension, out-of-school suspension, and expulsion.
Reading at Grade Level
Reading at grade level is another school quality and student success indicator.
Reading at grade level is measured in grades three through ten. Students are assigned one
point for scoring at ready or exceed and zero points for scoring at close or not ready.
Reading is one of the five ACT Aspire tested areas. Points are accumulated for each
student for this indicator to produce a mean score, which is then used to calculate a value
for overall school quality and student success.
23
The American College Test
The American College Test, or ACT, indicates school quality and student success.
The ACT contains multiple-choice questions in English, Math, Reading, and Science.
The English portion of the ACT measures the student’s ability to make decisions to revise
and edit short texts and essays in different genres. Students have forty-five minutes to
answer seventy-five questions on the English portion of the ACT. The Math portion of
the ACT measures the student’s mathematical skills typically acquired in courses up to
the beginning of grade 12.
Students have 60 minutes to answer 60 questions on the Math portion of the ACT.
The Reading portion of the ACT measures the student’s ability to read closely, reason
logically about texts using evidence, and integrate information from multiple resources.
Students have 35 minutes to answer 40 questions on the Reading portion of the ACT. The
Science portion of the ACT measures the student’s interpretation, analysis, evaluation,
reasoning, and problem-solving skills required in Biology, Chemistry, Earth/Space
Sciences, and Physics. Students have 35 minutes to answer 40 questions on the Science
portion of the ACT. The Writing portion of the ACT is optional. The Writing portion of
the ACT measures the student’s writing skills taught in high school English classes and
entry-level college composition courses. Students have 40 minutes to respond to one
prompt.
Students can send their ACT scores directly to colleges and various scholarship
agencies. Students will receive a score between one and 36 on each test. These scores are
averaged to calculate one composite score. There is also a super score. There is no limit
to the number of times students can take the ACT. A super score is a composite score
24
calculated by taking the highest individual tested area of each ACT session the student
has ever earned. Some postsecondary institutions accept super scores for admission,
while others do not accept super scores for admission. Super scores are not considered in
determining the school letter grade. Points are accumulated for each student for this
indicator to produce a mean score, which is then used to calculate a value for overall
school quality and student success.
The ACT Readiness Benchmark
The ACT Readiness Benchmark is another school quality and student success
indicator. This indicator follows the super score model, meaning individually tested areas
for all testing sessions from the previous three years are considered in calculating ACT
readiness. Students are assigned one-half of a point for ACT Reading scores of 22 or
higher. Students are assigned one-half of a point for ACT Math scores of 22 or higher.
Students are assigned one-half of a point for ACT Science scores of 23 or higher.
Students who have not scored the minimum score for each tested area receive zero points
toward the student’s total earned points. Points are accumulated for each student for this
indicator to produce a mean score, which is then used to calculate a value for overall
school quality and student success.
The 2.8 GPA on a 4.0 scale
The 2.8 GPA on a 4.0 scale is another school quality and student success
indicator. The student’s final grade point average is pulled at the end of the student’s
senior year. Students with a grade point average equal to or greater than 2.8 receive one
point toward their total earned points. Students with a grade point average of less than 2.8
receive zero points toward their total earned points. Points are accumulated for each
25
student for this indicator to produce a mean score, which is then used to calculate a value
for overall school quality and student success.
On-time Credits
On-time credits are another school quality and student success indicator. A
student receives one point if he earns 5.5 or more credits in the first year of high school,
11 credits by the end of the second year, and 16.5 credits by the third year. Students who
have recovered credits after the fact do not receive a point for on-time credits. Points are
accumulated for each student for this indicator to produce a mean score, which is then
used to calculate a value for overall school quality and student success.
Advanced Placement, International Baccalaureate, or Concurrent Credit Courses
A student receives one point if the student has earned at least one advanced
placement, international baccalaureate, concurrent credit, or ACE course in grades 9-12.
Students who have not yet earned this credit as ninth through eleventh graders are not
missing this point because this indicator is only exercised during what should be the
student’s last semester of high school. Points are accumulated for each student for this
indicator to produce a mean score, which is then used to calculate a value for overall
school quality and student success.
Student Attendance and Student Engagement
Student attendance is a critical factor in student engagement. Student attendance
is the presence of the student at school and in the correct classroom at the appropriate
time (Fallis & Opotow, 2003). It is important to note that student attendance refers to the
student being in the correct classroom at the appropriate time because the student can be
at the school campus but not in the classroom (Fallis & Opotow, 2003). A student can
26
intentionally skip a class by hiding on campus outside, in a class not assigned to the
student at the time, in or around an athletic facility on campus, in the media center,
roaming the halls, or several other places (Fallis & Opotow, 2003).
This action is commonly known as skipping and is not consistent with positive
attendance action (Fallis & Opotow, 2003). Skipping class is described in one study as
“the slow-motion process of dropping out made class-by-class and day-by-day in
students’ daily lives (Fallis & Opotow, 2003).” A student’s grades, on-time credits, and
the likelihood of graduation are significantly impacted by moderate absenteeism
(Allensworth & Evans, 2016). The construct of on-time credits concerns the pace at
which students earn credits. The Arkansas Department of Education’s effectiveness
system accounts for every student and awards the school full credit for the student who
has earned five and a half credits per school year. That is the minimum expectation, but
students can earn more credits per school year. However, earning five and a half credits
per school year is unlikely if the student falls into the chronic absenteeism category,
meaning the student misses ten percent or more of the school year.
Absenteeism is a more predictive graduation factor than race, gender, or poverty
(Allensworth & Evans, 2016). In one study, course attendance is eight times more
predictive of course failure in the freshman year than 8th-grade test scores (Allensworth
& Evans, 2016). This means that the data shows a student has a better chance to be
successful statistically speaking if the student is present, even more so than eighth-grade
test scores indicating the student is academically ready for the next grade level. The same
study shows that one week’s worth of absences per semester is associated with a 20%
decline in the probability of graduating from high school (Allensworth & Evans, 2016).
27
Middle school students who are chronically absent have a 50% chance of veering off
track in high school. These students have little chance of graduating without dramatically
changing their educational experience (Allensworth & Evans, 2016). Tardiness is also a
part of attendance. A tardy student has suffered learning loss by missing instruction
during tardiness, and chronic tardiness means more substantial learning loss (Tyre et al.,
2011). Therefore, tardiness is a part of student attendance.
There is existing research on the relationship between attendance and student
engagement. Higher attendance usually means a higher level of student engagement
(Herman, 2012). The problem with tardiness and excessive absenteeism is that they
produce learning loss. One way that significant learning loss occurs is when a student is
absent during instruction (Roby, 2004). Tier 1 instruction is the initial instruction given to
students by the teacher. There are intervention and remediation, which are small group or
individual follow-up instructional sessions, but the initial instruction is what students
miss when they are tardy or absent. This can be in the form of tardiness or being absent
altogether.
There is also existing research on the relationship between discipline and
extracurricular activity participation on student engagement. Discipline infractions may
result in removal from the classroom through suspension or expulsion, where Tier 1
instruction is initially provided (Kennedy-Lewis & Murphy, 2016). The problem with
excessive discipline infractions is the consequences that come with them, sometimes
removal from the classroom, thereby causing learning loss (Kennedy-Lewis & Murphy,
2016). Fewer discipline infractions usually mean a higher level of student engagement,
28
while extracurricular activity participation usually means more student engagement
(Dickinson et al., 2021).
Student Discipline and Student Engagement
Student discipline is a critical factor in student engagement. The prevalence of
learning loss when consequences are issued to maintain discipline in the school is an
issue with student engagement (Kennedy-Lewis & Murphy, 2016). Many forms of school
discipline result in learning loss by removing the student from the classroom, causing the
student to miss Tier 1 instruction. Ironically, a student may receive a consequence of an
out-of-school suspension for skipping class. School discipline should act to remedy the
behavior, but out-of-school suspensions add to learning loss. Many education experts
argue against out-of-school suspensions altogether (Kennedy-Lewis & Murphy, 2016).
Detentions, in-school suspensions, out-of-school suspensions, and expulsions are
potential consequences for tardiness and chronic absenteeism. Detentions are usually
served before, during, or after school. If the detention is to be served during school, it
should be during the student’s time that does not require them to miss instruction (Welsh,
2022). For example, recess and lunch are times when students can serve detention
without missing instruction. The detention is meant to serve as an inconvenience to the
student, which is intended to motivate the student to avoid the inconvenience of detention
in the future by not being tardy anymore (Welsh, 2022). The opposite is true for in-school
suspensions and out-of-school suspensions in many cases. In-school suspensions can be
more effective than out-of-school suspensions for students who enjoy the social aspects
of being at school (Welsh, 2022). In-school suspension is inconvenient because students
are isolated from the rest of the student body and school activities (Welsh, 2022). This is

29
meant to motivate the student to avoid the inconvenience of in-school suspension by
correcting the behavior that landed the student in in-school suspension, which in this case
is tardiness.
This may only work for some students (Welsh, 2022). Another issue with in-
school suspension is the quality of instruction students receive while serving time in in-
school suspension (Welsh, 2022). Students are usually given review work, which
prevents new learning (Welsh, 2022). Even if the student is given classwork current to
the regular class setting, the student misses the Tier 1 instruction given in the classroom,
including all of the learning activities and supplemental resources that are a part of the
Tier 1 instruction (Welsh, 2022).
In-school suspension is essentially a learning loss (Welsh, 2022). Out-of-school
suspension is also a learning loss, but not as complex. Many students view out-of-school
suspension as a vacation day, especially students who do not have parental support at
home (Welsh, 2022). It is not viewed as a punishment at all. Students receive no
instruction during out-of-school suspension and will have missed a significant amount of
the curriculum upon return (Welsh, 2022). For these reasons, schools should work to
minimize or eliminate both in-school and out-of-school suspensions by addressing the
reasons behind the actions that cause students to be assigned these consequences (Maag
& Katsiyannis, 2010).
Wraparound services are a construct that can be used to remedy many underlying
issues causing tardiness and chronic absenteeism. The concept of a school providing
wraparound services is the idea of the school providing resources to the students outside
of instruction (Maag & Katsiyannis, 2010). These resources can include mental,

30
emotional, and social health support (Maag & Katsiyannis, 2010). Wraparound services
include physical support for homeless students and students from low-income families
regarding food, clothing, academic supplies, job placement, and housing (Basford et al.,
2021). Students needing wraparound services do not meet their most basic needs outside
of what the school can offer, which is the foundation of Maslow’s Hierarchy of Needs
(Basford et al., 2021).
A school providing wraparound services can fill a student's void and minimize or
eliminate discipline issues for that student (Basford et al., 2021). For example, a student
may skip a class to avoid bullying for wearing a dirty school uniform. The student may
not have a working washer and dryer at home. Wraparound services include giving the
student a clean set of school uniform clothes for the week, washing the dirty set, and then
returning this set to the student clean for the next week. For this student, a need has been
met, a discipline issue has been resolved, and learning loss has been eliminated by
providing wraparound services.
Attendance and Reading Scores
Reading scores are indicative of attendance (Gottfried, 2019). Chronic
absenteeism is a category of absenteeism achieved when a student has missed 10% or
more of the school year. Chronically absent students usually have lower reading scores
(Gottfried, 2019). Reading scores are affected by chronic absenteeism because students
miss grade-level vocabulary when grade-level standards are taught during Tier 1
instruction, which is simply the initial instruction provided to the class as a whole
(Grasley-Boy et al., 2022). During Tier 1 instruction, the teacher introduces new
vocabulary during the lesson). While students in the classroom are learning new
31
vocabulary presented in the lesson, the suspended student is missing the lesson, thereby
missing the growth in reading comprehension skills. The students in the classroom
continue to grow with each engaging lesson, while the suspended student continues to get
further behind with each missed day of instruction (Grasley-Boy et al., 2022).
Students who are not chronically absent usually have higher reading scores
(Gottfried, 2019). Students who are not chronically absent are present in the classroom
when the teacher introduces new grade-level vocabulary in the lesson. There is a greater
likelihood that the present student will grasp the new vocabulary than the likelihood of
the absent student learning the new vocabulary (Grasley-Boy et al., 2022). Concerning
academic achievement, the present student performs much better than the chronically
absent student (Grasley-Boy et al., 2022).
Reading scores indicate overall academic success (Lapasau et al., 2022). A
student reading on grade level usually achieves higher in all other subject areas than those
not reading on grade level. English Language Arts, Social Studies, and Science are all
reading-intensive subject areas, which is why the student’s ability to read on grade level
impacts overall academic achievement. However, reading on grade level also correlates
with higher math scores (Lapasau et al., 2022). A student must understand what a math
question or word problem asks them to do, how to manipulate the numbers, or what
operation to perform to succeed in math. In this way, reading comprehension or the
ability to read on grade level is a foundational tool for students to have overall higher
academic achievement versus not reading on grade level (Lapasau et al., 2022).
32
Effects of Lost Instructional Time on Reading Scores Due to Discipline
Discipline data indicates reading scores due to the learning loss that occurs from
disciplinary consequences (Arcia, 2006). Suspensions require students to be removed
from the classroom. This results in learning loss because the student is absent during
instructional time (Arcia, 2006). As a part of learning loss, students miss out on the grade
level standards being taught as a part of the curriculum presented to students during
instruction. A student who misses the introduction of new, grade-level, content-specific
vocabulary will only fall behind if the student receives the same quality of instruction
missed during the suspension, which is unlikely. For this reason, as disciplinary
infractions increase, reading scores decrease (Arcia, 2006).
Chapter Summary
The literature review details student engagement. Student engagement consists of
student attendance and student discipline. The results of student discipline often impact
student attendance, compounding the issue of a lack of student learning outcomes.
Affective, behavioral, and cognitive engagement are student actions and feelings toward
school. Extracurricular activities are tools schools can use to improve student
engagement. With high student engagement comes high student achievement. An
indicator of student achievement is reading comprehension. The ACT Aspire test
measures reading comprehension. All of these constructs come together to produce a
school’s overall effectiveness.
The following chapters will entail all of the data and the data’s implications of the
constructs above. The data will include student attendance, discipline, and ACT Aspire
33
reading scores, all broken down by ethnicity and gender. This data will show the
relationship between these constructs.

34
CHAPTER III
METHODOLOGY
This quantitative study sought to determine the relationship between student
engagement and academic achievement at an urban junior high school in Northwest
Arkansas. Student engagement was measured by the level of attendance and the number
of discipline referrals for students in this school. The purpose of this study was to identify
whether there is a relationship between student engagement and academic achievement as
identified by the individual student scores on the ACT Aspire Reading assessment. In
addition, the study sought to determine if there is an effect of gender and ethnicity upon
any relationship between student engagement and academic performance on the ACT
Aspire Reading assessment.
Student engagement is students' passion or interest level toward their education
(Li et al., 2023). Student engagement can be reflected in the quality of a student’s
relationship with family, school staff, and peers (Montero-Sieburth & Turcatti, 2022).
Student engagement can be reflected in the student's effort, such as double-checking
school work after completion, seeking tutoring, and extending learning beyond the
classroom (Shin & Bolkan, 2021). Student engagement is the student’s mentality
concerning the relevance of the curriculum and school to the student’s life outside and
after high school (Rose & Bowen, 2021). Concerning data, student engagement is
reflected in several ways, including attendance and discipline data. For this study, student
engagement will serve as the dependent variable. Attendance and discipline data will
serve as independent variables. The research will investigate the problem of student
underperformance as it relates to student engagement.

35
Research Questions and Hypotheses
The purpose of this study was to determine the relationship between student
engagement as defined by the number of days of attendance and discipline referrals
during the 2021-22 school year for the ninth-grade students in one Northwest Arkansas
junior high school and student academic success as measured by raw scores on the ACT
Aspire Reading Assessment. The following research questions and hypotheses guided the
study:
RQ1: Is there a statistically significant relationship between student attendance and ninth-
grade ACT Aspire Reading scores in the participating Northwest Arkansas junior high
school?
H
0
1: There is no statistically significant relationship between student attendance and
ninth-grade ACT Aspire Reading scores in the participating Northwest Arkansas junior
high school.
RQ2: Is there a statistically significant relationship between student discipline and ninth-
grade ACT Aspire Reading scores in the participating Northwest Arkansas junior high
school?
H
0
2: There is no statistically significant relationship between student discipline and
ninth-grade ACT Aspire Reading scores in the participating Northwest Arkansas junior
high school.
RQ3: Do attendance, discipline, gender, and ethnicity predict ninth-grade ACT Aspire
Reading scores in the participating Northwest Arkansas junior high school?
H
0
3: Attendance, discipline, gender, and ethnicity do not predict ninth-grade ACT Aspire
Reading scores in the participating Northwest Arkansas junior high school.

36
Research Methodology
This quantitative study examined data from the school’s student information
system (SIS) and ACT Aspire testing portal. These databases will provide student
demographic data, namely ethnicity and gender, without identifying individual students
by name. The data were collected from the most recent testing window during the 2021-
2022 school year to identify possible relationships between student attendance, student
discipline, and ACT Aspire reading scores by ethnicity and gender. The data collection
from the most recent school year's most recent testing window allowed for the timeliest
data available about this school.
Research Design
The purpose of this study was to determine if there is a relationship between
student engagement and academic performance in reading among ninth-grade students at
one Northwest Arkansas junior high school. The variables examined include student
attendance, discipline, gender, and ethnicity as predictor variables, and raw scores on the
2021-22 ACT Aspire Reading Assessment for the ninth-graders in the participating
middle school were used as the outcome variable.
After receiving approval from the Arkansas Tech University Institutional Review
Board (IRB) (See Appendix A) and permission from the school district to retrieve the
required data (See Appendix B), the researcher proceeded to collect data for the study.
The data were collected directly from the school databases by school administrators, and
an Excel file containing the data was provided to the researcher.
Since the data were not randomly sampled and the selection of the participating
middle school was made through convenience sampling, the purpose of the study was not

37
to determine a cause and effect between the variables but to investigate the relationships
between the variables, to understand the effect of the selected predictor variables on the
outcome variable, reading scores.
Correlation and regression were selected as the research methods for this
quantitative design. The 2021-2022 school year data was used to identify possible
relationships between attendance, discipline, and academic achievement. ACT Aspire
Reading scores measured academic achievement. The collection of student attendance
and discipline data from the school’s student information system (SIS) allowed for the
examination of the level of student engagement, while ACT Aspire Reading scores
broken down by demographics allowed for the analysis of academic achievement by
gender and ethnicity.
After determining whether or not there was a statistically significant correlation
between student attendance, student discipline, and ACT Aspire Reading scores, multiple
regression analysis was used to assess the predictability of the outcome variable based on
the effect size of the predictor variables. Through this statistical method, the researcher
determined how much each predictor variable explains the variance in the outcome
variable, reading scores.
The researcher determined that the selected research methods and design provided
the best procedure for analyzing the collected data and answering the research questions
developed for this study.
Population and Sample
The population for this research study included all public Arkansas ninth-grade
students. The target population for this research study included one grade level of the
38
participating Arkansas junior high school. The convenience sample for this study
consisted of all ninth-grade students in this participating junior high school who received
a score on the ACT Aspire reading assessment during the 2021-22 school year.
Setting
The data were collected from the 2021-2022 ninth-grade class in the selected
Northwest Arkansas junior high school. The participating school houses two grade levels
with an enrollment of 720. The school's demographic makeup is 65% Hispanic, 18.6%
Pacific Islander, 10% White, 2.6% African American, 1.8% Asian, and 1.9% Other. The
student population of this school does not reflect the overall demographics of public
schools in Arkansas. Due to the high percentage of Hispanic students, it should be noted
that 83.6% of the students are English Language Learners (ELL). The relatively high
percentage of Pacific Islanders is due to the concentration of Marshallese students who
migrated from the Marshall Islands for employment opportunities in the poultry industry.
Compared to the student population for Arkansas in 2021-22, the breakdown was
59.5% White, 19.4% African American, 13.9% Hispanic, 1.8% Asian, 1.0% Pacific
Islander, and 4.4% Other. Based on these percentages, the ethnic population of the
participating school is not reflective of Arkansas as a whole. The higher percentages of
ELL students may have impacted the study results since ELL was not included as a
predictor variable.
In terms of the sample population of ninth-grade students in this school, Table 1
provides the percentage of students by ethnicity and gender. Regarding the overall
ethnicity percentages, the ninth-grade is representative of the general population of the
participating school.

39
Table 1
Sample Population by Ethnicity and Gender
Ethnicity Male Female Total
Hispanic 121 (48.2%)
(66.9%)
130 (51.8%)
(64.7%)
251 (100%)
(65.7%)
Pacific Islander 31 (44.3%)
(17.1%)
39 (55.7%)
(19.4%)
70 (100%)
(18.3%)
White 17 (44.7%)
(9.4%)
21 (55.3%)
(10.4%)
38 (100%)
(9.9%)
African American 5 (50%)
(2.8%)
5 (50%)
(2.8%)
10 (100%)
(2.6%)
Asian 4 (57.1%)
(2.2%)
3 (42.9%)
(1.7%)
7 (100%)
(1.8%)
Other 3 (50%)
(1.7%)
3 (50%)
(1.7%)
6 (100%)
(1.7%)
Total 181 (47.4%) *
(100%) **
201 (52.6%)
(100%)
382 (100%)
Note: *Percentages by Row; **Percentages by Columns.
Instrumentation
The ACT Aspire is the instrument providing data for the outcome variable,
student academic performance in this study. The ACT Aspire is a standardized test that
measures student academic achievement in grades three through 10. The tested subject
areas are English, Math, Reading, Science, and Writing.
The ACT Aspire system will be aligned from elementary to high school,
connecting each grade level to the next. This will create a cohesive, comparable,
transportable longitudinal system from one state to the next. Teachers and parents
can confidently know where each student is on the path to college and career

40
readiness at every step. In addition to summative assessments that measure how
much students have learned over time, ACT Aspire will include formative
assessments that help teachers meet students’ learning needs within individual
classes throughout the year. The aligned assessments will inform teachers about
students’ progress toward specific learning standards so they can better tailor their
instructional activities and resources to help students learn (New, 2023, p. 1).
Concerning reliability and validity, one part of research posted on the ACT Aspire
website states, “In this report, we provide evidence to support Critical Element 3.4 of
ESSA Peer Review: “The State has documented adequate validity evidence that the
State’s assessment scores are related as expected with other variables” (US Department
of Education, 2018, p. 47).” Another part of the website reads, “Educators from across
the state of Arkansas convened during a four-day workshop and completed an alignment
of the ACT Aspire using the overall state standards, ACT Aspire Performance Level
Descriptors, and the ACT Aspire test items (Learning, 2023, p. 3).”
Data Sources
Student attendance and student discipline are individual data sets, but both come
from eSchool, the school’s student information system (SIS). eSchool can run a report for
student attendance and a report for student discipline broken down by ethnicity and
gender. eSchool can also run a report for student attendance and discipline for a specific
time frame. In this case, the time frame will be the first official day of school through the
last official day of school for ninth graders during the 2021-2022 school year. This will
allow for ascertaining any potential relationship between student attendance and student
discipline and ACT Aspire Reading scores by ethnicity and gender. Student attendance is

41
calculated according to whether the student missed more than or equal to ten percent of
the school year. Discipline data is broken down into the number of chronically absent
students, the number of in-school suspension assignments, and the number of out-of-
school suspension assignments. These assignments can overlap, meaning several more
than one student represents one.
Operational Definitions of Variables
Operationally defining a variable involves the specificity of how a variable will be
measured. Student attendance is measured by the percentage of a school year the student
is present or absent. A student who has missed more than or equal to 10% of the school
year is considered a chronically absent student. A student who has missed less than ten
percent of the school year is not considered chronically absent.
Concerning discipline, data are collected by the number of in-school or out-of-
school suspension assignments per student. ACT Aspire scores are on a numerical scale,
similar to the traditional 0-100 grading scales. These scores fall within the categories,
which are “In Need of Support,” “Close,” “Ready,” or “Exceeding.”
Data Collection
The data consisted of archived data maintained in eSchool, the school’s student
information system (SIS). Student data can be pulled from eSchool and the school ACT
Aspire portal with individual student names redacted, or the report can be designed in
such a way as to only draw statistics without drawing student names. This data will be
pulled by one of the current administrators. eSchool and the ACT Aspire portal can run
reports and redact any particular student identifiers. For this study, the administrator
pulling the data report redacted student names. Gender, ethnicity, and scores will be

42
visible in the data report. The data were provided in an Excel file and uploaded into SPSS
software for statistical analysis.
Data Analysis
The purpose of this study was to determine the relationship between student
engagement as defined by the number of days of attendance and discipline referrals
during the 2021-22 school year for the ninth-grade students in one Northwest Arkansas
junior high school and student academic success as measured by raw scores on the ACT
Aspire Reading Assessment. Table 2 presents the variables and statistical analysis used to
answer each of the research questions.
The following research questions and hypotheses guided the study:
RQ1: Is there a statistically significant relationship between student attendance and ninth-
grade ACT Aspire Reading scores in the participating Northwest Arkansas junior high
school? RQ1 was answered using a Spearman Rho correlation with the two variables,
attendance and ACT Aspire Reading scores. Spearman correlation was used after it was
determined that the data failed the pretest related to homoscedasticity. This analysis
determined if there was a positive or negative correlation between the two variables and
whether the hypothesis was supported or unsupported.
H
0
1: There is no statistically significant relationship between student attendance and
ninth-grade ACT Aspire Reading scores in the participating Northwest Arkansas junior
high school.

43
Table 2
Variables Analyzed and Statistical Analysis Used for Each Research Question
Research Question Variables Tested Statistical Analysis
RQ1: Is there a statistically
significant relationship
between student attendance
and ninth-grade ACT Aspire
Reading scores?
Student Attendance
ACT Aspire Reading
Scores
Spearman Correlation
RQ2: Is there a statistically
significant relationship
between discipline and ninth-
grade ACT Aspire Reading
scores?
Student Discipline
ACT Aspire Reading
Scores
Spearman Correlation
RQ3: Do attendance,
discipline, gender, and
ethnicity predict ninth-grade
ACT Aspire Reading scores?
Outcome Variable: ACT
Aspire Reading Scores
Predictor Variables:
Student Attendance
Student Discipline
Gender
Ethnicity
Multiple Linear
Regression
RQ2: Is there a statistically significant relationship between student discipline and ninth-
grade ACT Aspire Reading scores in the participating Northwest Arkansas junior high
school? RQ2 was answered using a Spearman Rho correlation with the two variables,
attendance and ACT Aspire Reading scores. Spearman correlation was used after it was
determined that the data failed the pretest related to homoscedasticity. This analysis
determined if there was a positive or negative correlation between the two variables and
whether the hypothesis was supported or unsupported.
H
0
2: There is no statistically significant relationship between student discipline and
ninth-grade ACT Aspire Reading scores in the participating Northwest Arkansas junior
high school.

44
RQ3: Do attendance, discipline, gender, and ethnicity predict ninth-grade ACT Aspire
Reading scores in the participating Northwest Arkansas junior high school? RQ3 was
answered by using multiple linear regression to determine if student attendance,
discipline, gender, and ethnicity predict ninth-grade ACT Aspire Reading scores.
H
0
3: Attendance, discipline, gender, and ethnicity do not predict ninth-grade ACT Aspire
Reading scores in the participating Northwest Arkansas junior high school.
Assumptions
The following assumptions were present in the study:
1. All students attended the school for the entirety of the school year. Transfers kept
the same attendance record before starting at the school to be studied.
2. Discipline data concerning in-school suspensions, out-of-school suspensions, and
expulsions does not overlap.
3. All students actively participate in ACT Aspire Reading testing and have scores
on file.
4. All students registered for school listing the correct ethnicity and have not
changed it.
5. All students registered for school listing the correct gender and have not changed
it.
Ethical Assurances
After receiving approval from the researcher’s dissertation committee, an
application for research approval was submitted to the ATU Institutional Review Board
(IRB) before beginning to collect data for the study. The data to be gathered consisted of
archived data maintained by the participating school, and the ATU IRB granted expedited

45
approval (Appendix A). The student data were provided in an Excel file with all
identifying information masked to maintain the anonymity of the participants.
Chapter Summary
The purpose of the study was to examine the relationship between student
attendance and student discipline on ACT Aspire Reading scores by ethnicity and gender.
This study examined whether sound student attendance and discipline yield higher
academic achievement. ACT Aspire Reading scores measured academic achievement.
These student data were further examined using ethnicity and gender. The academic
achievement data will be measured from the ninth graders of the 2021-2022 school year.
46
CHAPTER IV
DATA ANALYSIS AND RESULTS
The purpose of this chapter is to present the results from analyzing the data
collected and addressing the research questions and hypotheses presented in previous
chapters. This will be accomplished in this chapter by restating the problem statement,
methodology, and research questions and then demonstrating how the analysis answers
the research questions and hypotheses.
Student engagement is the passion or interest level that students have toward their
own education and can be reflected in the quality of a student’s relationship with family,
school staff, and peers (Li & Xue, 2023; Montero-Sieburth, 2022). It can also be reflected
in the effort a student puts forth, such as double-checking school work after it is
completed, seeking tutoring, and extending learning beyond the classroom (Shin &
Bolkan, 2021).
Student engagement is reflective of the student’s perception of the relevance of
the curriculum and school to the student’s life outside of school and life after high school
and can be seen in the effort to achieve academic success (Rose & Bowen, 2021). If
student engagement is low or non-existent, it is to be assumed that student academic
success will suffer. Therefore, the problem addressed by this study was to determine the
relationship between student engagement and academic success as measured by scores on
the ACT Aspire Reading Assessment in one northwest Arkansas middle school.
For this study, student engagement was operationally defined by the level of
attendance and disciplinary referrals by ninth-grade students in the participating junior
47
high school and served as the independent variables. Academic success was measured by
scores on the ACT Aspire Reading Assessment and served as the dependent variable.
This quantitative study examined data from the school’s student information
system (SIS) and ACT Aspire testing portal. These databases provided student
demographic data, ethnicity, and gender without identifying individual students by name.
The data were collected from the most recent testing window during the 2021-2022
school year, with the goal of identifying possible relationships between student
attendance, student discipline, and ACT Aspire reading scores by ethnicity and gender
using the latest data available to the researcher.
Descriptive Results
The target population for this research study included all ninth-grade students in
Arkansas public schools. The convenience sample included all ninth-grade students in
one participating Northwest Arkansas junior high school who received a score on the
ACT Aspire assessment during the 2021-22 school year.
The participating school housed two grade levels (eighth and ninth grades) with
an enrollment of 740 (358 eighth graders and 382 ninth graders). The ethnic makeup of
the school consisted of 483 (65.3%) Hispanic; 139 (18.8%) Pacific Islander; 72 (9.7%)
White; 16 (2.2%) African American; 16 (2.2%) Asian; and 14 (1.9%) Other. In addition,
619 (83.6%) of the students in this school were listed as English Language Learners
(ELL). By gender, the makeup of the school consisted of 372 (50.3%) males and 368
(49.7%) females.
There were 382 students enrolled at a Northwest Arkansas junior high school.
Table 1 presents the enrollment numbers of ninth-grade students enrolled in the school

48
and the percentages of ethnic groups in comparison with the total school population. Of
the three predominant groups, Hispanic, Pacific Islander, and White students are the
largest, second largest, and third largest ethnic groups, respectively.
Table 3 presents the number of chronically absent students by ethnicity and
gender. Hispanic students have the highest number of chronically absent students, at 21
males and 34 females. Pacific Islanders have the next highest number of chronically
absent students, at eight males and 16 females. White students have the lowest number of
chronically absent students, with three males and eight females. Including all ethnicities
and genders, there are a total of 95 students categorically defined as chronically absent,
with 33 of those being males and 62 of those being females.
Table 3
Number of Chronic Absentees by Ethnicity and Gender
Ethnicity Male Female Total
Hispanic 21 (38.2%)
(63.6%)
34 (61.8%)
(54.8%)
55 (100%)
(57.9%))
Pacific Islander 8 (33.3%)
(24.2%)
16 (66.7%)
(25.8%)
24 (100%)
(25.3%)
White 3 (27.3%)
(9.1%)
8 (72.7%)
(12.9%)
11 (100%)
(11.6%)
African American 0 (0.0%)
(0.0%)
1 (100%)
(1.6%)
1 (100%)
(1.6%)
Asian 0 (0.0%)
(0.0%)
2 (100%)
(3.2%)
2 (100%)
(3.2%)
Other 1 (50%)*
(1.6%)**
1 (50%
(1.6%)
2 (100%)
(3.2%)
Total 33 (34.7%)
(100%)
62 (65.3%)
(100%)
95 (100%)
Note: *Percentages by Row; **Percentages by Columns.

49
Table 4
Number of Suspensions by Ethnicity and Gender
Ethnicity Students
Susp.
2021-22
Male Female Total Total Ninth
Grade Pop.
By
Ethnicity
Hispanic 0
1
2
3
100
16
4
0
115
11
3
1
215
27
7
1
251
Pacific
Islander
0
1
2
3
27
4
0
0
34
4
1
0
61
8
1
0
70
White 0
1
2
3
16
1
0
0
18
1
1
1
34
2
1
1
38
African
America
n
0
1
2
3
4
0
1
0
4
1
0
0
8
1
1
0
10
Asian 0
1
2
3
3
1
0
0
3
0
0
0
6
1
0
0
7
Other 0
1
2
3
2
1
0
0
2
0
2
4
1
2
6
Total 382
Note: *Percentages by Row; **Percentages by Columns.

50
Table 4 presents the number of out-of-school suspensions by ethnicity and gender.
There were 35 Hispanic students with at least one suspension, nine Pacific Islander
students with at least one suspension, and four White students with at least one
suspension. Inclusive of all ethnicities and genders, there were 54 total students with at
least one suspension.
Data Collection
The data collection will be archived data that is maintained in eSchool, which is
the school’s student information system (SIS). Student data can be pulled from eSchool
and the school ACT Aspire portal with individual student names redacted, or the report
can be designed in such a way as to only draw statistics without drawing student names.
This data will be pulled by one of the current administrators. eSchool and the ACT
Aspire portal both have the functionality to run reports and redact any particular student
identifiers. For the purpose of this study, the administrator pulling the data report will
redact student names. Gender, ethnicity, and scores will be visible in the data report. The
data will be provided in an Excel file, which will be uploaded into SPSS software.
Data Analysis
Data analysis in this study was carried out in an attempt to answer the three
research questions presented in Table 2. For the first two research questions, a
correlational analysis was used to determine if there was a statistically significant
relationship between two continuous variables. In RQ1, the variables were ninth-grade
student attendance during the 2021-22 school year and the scores on the ACT Aspire
Reading assessment in 2021-22. RQ2 was similarly analyzed, in this case, using the

51
ninth-grade student discipline data during the 2021-22 school year and the scores on the
ACT Aspire Reading assessment in 2021-22.
The correlational analyses that answered RQ1 and RQ2 were then analyzed to
determine if there was a statistically significant relationship between these continuous
variables. Since it was determined that there was a statistically significant relationship
between these variables, further analysis was carried out in an attempt to answer RQ3.
In order to answer RQ3, the researcher used a multiple linear regression analysis
using the ACT Aspire Reading scores as the outcome variable and student attendance,
student discipline, gender, and ethnicity as predictor variables in a multiple linear
regression model. This analysis was carried out to determine what effect each of the
predictor variables has on the student scores on this particular ACT Aspire Reading
assessment. The procedures and results for each of the analyses are presented below.
Results
This section describes the procedures and results from the various statistical
analyses that address the three research questions put forth in this study. The conclusions
and implications for these results are presented in Chapter 5.
Research Question 1 (RQ1):
Is there a statistically significant relationship between student attendance and
ninth-grade ACT Aspire Reading scores?
H
0
1: There is no statistically significant relationship between student attendance
and ninth-grade ACT Aspire Reading scores.
To answer RQ1, the research used a Pearson r correlation between the two
continuous variables, ninth-grade student attendance in the 2021-22 school year and the
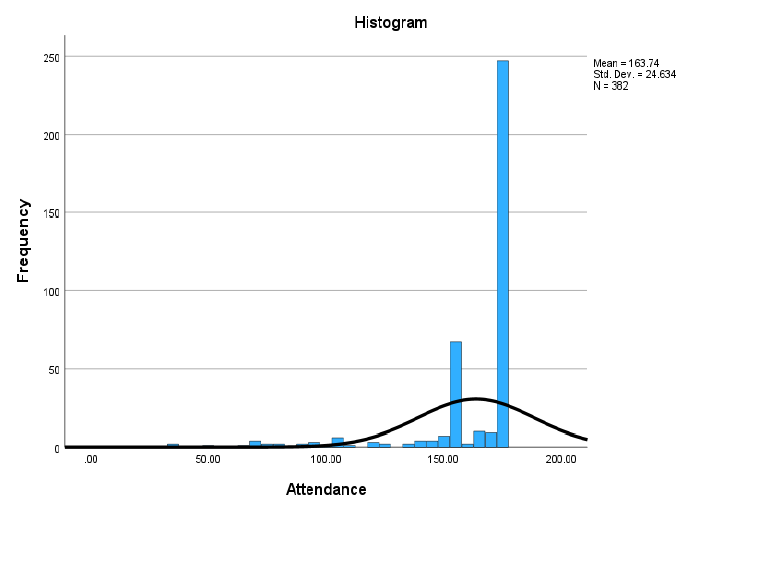
52
ninth-grade ACT Aspire Reading scores for the 2021-22 school year. The Pearson r
correlation is the most widely used statistic to determine the strength of the relationship
between two continuous variables. The statistic is reported based on a range from +1.00
to -1.00. The closer the score to +/- 1.00, the stronger the relationship. The plus or minus
indicates the relationship's direction, not the statistic's value.
The correlational analysis had to meet three pretests in order to be used for this
purpose. Those three pretests are normality, linearity, and homoscedasticity. Normality is
satisfied if the two continuous variables are normally distributed. To determine this, a
histogram was produced for each variable, and a determination was made that the data
were normally distributed, satisfying the first pretest. The histograms are presented in
Figure 1 and Figure 2.
Figure 1
Histogram Showing the Distribution of Attendance Data

53
Figure 2
Histogram Showing the Distribution of ACT Aspire Reading Scores
The second pretest is linearity. Linearity means that in a scatterplot, the data
should form a relatively straight line, with the regression line taking a mid-path through
the data points. If the overall shape of the data appears to form a shape other than a
straight line, then the pretest for linearity is not met. The scatterplot for student
attendance and ACT Aspire Reading scores is presented in Figure 3. While there do
appear to be more data points below the regression line, the general direction of the data
is in a linear direction, and it was determined that the second pretest was met.
The third pretest is homoscedasticity, which refers to the general shape of
the scatterplot. In the scatterplot in Figure 3, it appeared that the data points were lumped
toward one end of the graph. To satisfy homoscedasticity, the majority of the data points
should be clustered in the middle, with fewer on each end. Based on the visual from this
scatterplot, the third pretest was not met.

54
Figure 3
Scatterplot of Attendance and ACT Aspire Reading Scores
The violation of any of the three pretests for Pearson r correlation means that the
statistic is unsuitable for this analysis. Instead, the researcher used a Spearman correlation
instead. The Spearman correlation or Spearman rho is a non-parametric statistic that is
similar to Pearson r and provides similar results. With Spearman correlation, it is not
necessary for the data to be normally distributed. The results of the Spearman correlation
are presented in Table 5.
Spearman correlation was computed to assess the relationship between student
attendance and ACT Aspire Reading scores for the 382 ninth-grade students in the
participating middle school. There was a statistically significant positive correlation
between these two variables, r = .266(p = <.001, α = .05). Therefore, the null hypothesis
that stated there is no relationship between the two variables is not supported.

55
Table 5
Correlation Results for Attendance and ACT Aspire Reading Scores
Test
Scores
Attendanc
e
Spearman's
rho
Test
Scores
Correlation
Coefficient
1.000
.266
**
Sig. (2-tailed)
.
<.001
N
382
382
Attenda
nce
Correlation
Coefficient
.266
**
1.000
Sig. (2-tailed)
<.001
.
N
382
382
**. Correlation is significant at the 0.01 level (2-tailed).
Research Question 2: (RQ2)
Is there a statistically significant relationship between student discipline and
ninth-grade ACT Aspire Reading scores?
Figure 4
Scatterplot of Suspensions and ACT Aspire Reading Scores

56
A similar process was used in analyzing the data to answer RQ2. Although the pretests
for normality and linearity were met (See Figure 4), the data failed the pretest for
homoscedasticity, and the researcher was not able to use Pearson r correlation.
Spearman correlation was used to determine if there was a statistically significant
relationship between student discipline and ACT Aspire Reading scores for the ninth-
grade students in the participating middle school. As presented in Table 6 below, there
was a statistically significant relationship between the two variables, r = -.114( p = .026,
α = .05). The results indicate that if the number of suspensions goes up, the reading
scores go down, and vice versa. Therefore, the null hypothesis that there is no statistically
significant relationship between student discipline and ACT Aspire Reading scores is not
supported.
Table 6
Correlation Results for Suspensions and ACT Aspire Reading Scores
Test
Scores
Suspensions
Spearman's
rho
Test
Scores
Correlation
Coefficient
1.000
-.114
*
Sig. (2-tailed)
.
.026
N
382
382
Suspension
s
Correlation
Coefficient
-.114
*
1.000
Sig. (2-tailed)
.026
.
N
382
382
*. Correlation is significant at the 0.05 level (2-tailed).
Research Question 3 (RQ3)
The results confirmed in answering RQ1 and RQ2 demonstrated that there was a
correlation between student attendance and ACT Aspire Reading scores and between
student discipline and ACT Aspire Reading scores. However, correlation only shows
57
relationship and not cause and effect. Therefore, RQ3 was established to go deeper into
the relationship demonstrated between these variables and attempts to establish whether
the two continuous variables, along with two additional categorical variables, have an
effect on predicting these ninth-grade student ACT Aspire Reading scores.
A multiple linear regression was used to answer RQ3. Do student attendance,
student discipline, gender, and ethnicity predict ninth-grade ACT Aspire Reading scores?
Multiple regression analysis is similar to correlational analysis but allows for a
more complex examination of multiple predictors or independent variables in
determining the relationship to the outcome variable or dependent variable. In this study,
the multiple linear regression analysis sought to determine the relationship between four
predictor variables (student attendance, student discipline, gender, and ethnicity) and one
outcome variable (ACT Aspire Reading scores). This regression model was complicated
by the fact that two of the predictor variables were continuous (attendance and
discipline), and two were categorical (gender and ethnicity). Multiple linear regression
allows the use of both continuous and categorical variables as long as variables with three
or more categories use dummy variables in the analysis. Gender had two categories, so it
was not necessary to use dummy variables for gender. However, ethnicity had seven
categories, and dummy variables were established before running the regression.
Similar to correlation analysis, there are a series of pretests that must be met
before multiple regression can be used. There are five pretests: n quota, linearity,
homoscedasticity, multicollinearity, and normality. The following description depicts the
process for establishing that the data met all five pretests.

58
The first pretest is n quota. There has to be a predetermined minimum n size
before multiple linear regression can used. There is a formula established to determine
the size needed for a particular analysis. Counting the number of continuous predictor
variables (two) plus the number of categories within each categorical variable minus one
in each (seven) for a total of nine. Multiple that number by 10 equals 90. Based on this
formula, the dataset for this study should have a minimum of 90 cases. The n in the study
dataset equals 382. Therefore, the n quota pretest is met.
The second pretest is linearity among the continuous variables. This pretest was
determined previously in the pretests for Spearman correlations. In Figure 3 and Figure 4,
the scatterplots for student attendance and student discipline were determined to be
linear, thereby meeting this second pretest.
Figure 5
Scatterplot of z Prediction and z Residual Scores for ACT Aspire Reading Scores
59
The third pretest is the homoscedasticity of the dependent variable, ACT Aspire
Reading scores. A scatterplot was run using the z residual scores compared to the z
predictor scores to determine their distribution. If most of the data points fall within +/-2
standard deviations, then it is determined that the outcome variable meets the pretest for
homoscedasticity. When viewing Figure 5, it is apparent that the ACT Aspire Reading
scores fall within that range, and the third pretest is met.
The fourth pretest is multicollinearity. If two continuous variables are highly
correlated and included in a regression model, it would have the effect of double-loading
the process. Therefore, a pretest to make sure that none of the continuous variables are
highly correlated is run. This pretest can be determined by reviewing the last column in
Table 7. The variance inflation factor (VIF) should be below or equal to five for each
variable. In this case, each variable has a VIF of less than two, which means that the
pretest for multicollinearity has been met. None of the variables are highly correlated
with each other.
The fifth and final test is normality. If the distribution of the unstandardized
residuals found from the outcome variable is normally distributed, this pretest would be
met. By reviewing Figure 6, the distribution of the unstandardized residuals for ACT
Aspire Reading scores appears to be normally distributed, and the fifth pretest is met.
60
Table 7
Coefficients
for Regression Models
Model
Unstandardized
Coefficients
Standardized
Coefficients
t
Sig.
Collinearity
Statistics
B
Std.
Error
Beta
Tolerance
VIF
1
(Constant)
407.97
2.22
183.63
<.001
Attendance
.06
.01
.23
4.56
<.001
1.00
1.00
2
(Constant)
405.43
2.485
163.17
<.001
Attendance
.06
.013
.24
4.71
<.001
.996
1.00
Gender
1.47
.659
.11
2.23
.03
.996
1.00
3
(Constant)
405.80
2.48
163.34
<.001
Attendance
.06
.01
.22
4.54
<.001
.981
1.02
Gender
1.50
.65
.11
2.30
.02
.992
1.01
ethnicity=
White
3.50
1.10
.16
3.19
.00
.963
1.04
ethnicity=
African
American
.12
2.04
.00
.06
.96
.983
1.02
ethnicity=
Asian
1.50
2.42
.03
.62
.54
.990
1.01
ethnicity=
Pacific
Islander
-1.93
.86
-.11
-2.26
.03
.946
1.06
ethnicity=
American
Indian
2.64
6.32
.02
.42
.68
.996
1.00
ethnicity=
Multi-Race
3.28
2.85
.06
1.15
.25
.993
1.01
a. Dependent Variable: Test Scores
Since all five pretests were met, it was determined that multiple linear regression
was appropriate to answer RQ3. The data were entered into SPSS29 by using the
regression function. The ACT Aspire Reading scores were entered as the outcome
variable, with student attendance, student discipline, and gender entered as the predictor
variables in Block 1. Dummy variables were created for ethnicity since it was a
categorical variable with three or more categories. The dummy variables for ethnicity
were all entered as the predictor variable in Block 2. At this point, the multiple linear
regression was run with the results reported below.

61
Figure 6
Histogram for the Distribution of Unstandardized Residuals for ACT Aspire Reading
Scores
A multiple linear regression was run to answer RQ3, which sought to determine
what variables predict the ninth-grade scores on the ACT Aspire Reading assessment in
the participating middle school. The predictor variables entered were student attendance,
student discipline, gender, and dummy variables for ethnicity. The model results are
presented in Table 8 and Table 9. During the analysis, student discipline was removed
from the analysis as a non-factor, so three models were established.

62
Table 8
ANOVA
Results for Regression Models
Model
Sum of
Squares
df
Mean
Square
F
Sig.
1
Regression
867.01
1
867.01
20.83
<.001
b
Residual
15818.00
380
41.63
Total
16685.00
381
2
Regression
1072.52
2
536.26
13.02
<.001
c
Residual
15612.54
379
41.19
Total
16685.00
381
3
Regression
1872.68
8
234.09
5.90
<.001
d
Residual
14812.30
373
39.71
Total
16685.00
381
a. Dependent Variable: Test Scores
b. Predictors: (Constant), Attendance
c. Predictors: (Constant), Attendance, Gender
d. Predictors: (Constant), Attendance, Gender, ethnicity=White, ethnicity=Multi-
Race, ethnicity=Asian, ethnicity=American Indian, ethnicity=African American,
ethnicity=Pacific Islander
Model 1 uses student attendance regressed onto ACT Aspire Reading scores. The
results for Model 1 indicate that student attendance significantly predicts these reading
scores, R
2
= .052, R
2
Adj
= .049, F(1, 380) = 20.828, p <.001. This model accounts for
5.2% of the variance in the ACT Aspire Reading scores for this student sample.
Model 2 uses student attendance and gender regressed onto ACT Aspire Reading
scores. The results for Model 2 indicate that student attendance and gender significantly
predict these reading scores, R
2
= .064, R
2
Adj
= .059, F(2, 379) = 13.018, p < .001. This
model accounts for 6.4% of the variance in the ACT Aspire Reading scores for this
student sample.

63
Table 9
Model Summary
Model
R
R
2
Adj.
R
2
Std.
Error of
the
Estimate
Change Statistics
R
2
Change
F
Change
df1
df2
Sig. F
Change
1
.228
a
.052
.049
6.452
.052
20.828
1
380
<.001
2
.254
b
.064
.059
6.418
.012
4.989
1
379
.026
3
.335
c
.112
.093
6.302
.048
3.358
6
373
.003
a. Predictors: (Constant), Attendance
b. Predictors: (Constant), Attendance, Gender
c. Predictors: (Constant), Attendance, Gender, Dummy Ethnicity
d. Dependent Variable: Test Scores
Model 3 uses student attendance, gender, and ethnicity regressed onto ACT
Aspire Reading scores. The results for Model 3 indicate that student attendance, gender,
and ethnicity significantly predict these reading scores, R
2
= .112, R
2
Adj
= .093, F(8, 373)
= 5.895, p <.001. This model accounts for 11.2% of the variance in the ACT Aspire
Reading scores for this student sample.
Based upon the results of the multiple linear regression, the answer to RQ3 is that
while student attendance, gender, and ethnicity all significantly predict the ACT Aspire
Reading scores for the ninth-grade students in the participating middle school, student
discipline did not. Therefore, the null hypothesis is partially unsupported. Three of the
four predictor variables used in the study did statistically predict the outcome variable.
Chapter Summary
This chapter describes the findings of the quantitative study in detail. The
researcher was responsible for reviewing the research questions and communicating the
information gathered from the outcome of the data analysis. The study results were
gained by the application of 2 statistical analyses, Spearman Rho correlation, and
multiple regression.
64
The descriptive statistics from RQ1 and RQ2 showed a significant positive
correlation between student attendance and reading scores. The descriptive statistics from
RQ2 showed there was not a significant positive correlation between student discipline
alone and reading test scores.
Multiple linear regression was used to test the hypothesis in the remaining
research question. The focus would be to determine if there was a significant correlation
between attendance, student discipline, gender, and ethnicity, to reading scores.
Attendance, gender, and ethnicity predicted reading scores, but student discipline alone
did not predict reading scores.
65
CHAPTER V:
CONCLUSIONS, IMPLICATIONS, AND RECOMMENDATIONS
The problem addressed in this study was whether attendance, including
disciplinary consequences that affect attendance, affects reading proficiency when
considered by gender and ethnicity. Considering attendance data, discipline data, and
ACT Aspire reading scores, the study aimed to show the correlation between student
engagement and reading proficiency in junior high school students across genders and
ethnicities. This was important because reading comprehension is indicative of overall
academic achievement. With that, if students are struggling to read on grade level, it is
essential for schools to find solutions to the causes of low reading proficiency. Therefore,
if disciplinary consequences like out-of-school suspension contribute to chronic
absenteeism, administrators can focus on effective disciplinary alternatives to out-of-
school suspension.
This chapter presents the results of the data analysis in relation to the research
questions and hypotheses presented in Chapter 4. Along with these results, this chapter
seeks to provide conclusions and implications for educational practice and
recommendations for future research.
Summary of Results
The research questions and hypotheses for this study are:
● RQ1: Is there a relationship between attendance and ninth-grade ACT Aspire
Reading scores?
○ H1: There is no relationship between attendance and ninth-grade ACT
Aspire Reading scores.
66
● RQ2: Is there a relationship between discipline and ninth-grade ACT Aspire
Reading scores?
○ H2: There is no relationship between discipline and ninth-grade ACT
Aspire Reading scores.
● RQ3: Do student attendance, student discipline, gender, and ethnicity predict
ninth-grade ACT Aspire Reading scores?
○ H3: Student attendance, student discipline, gender, and ethnicity do not
predict ninth-grade ACT Aspire Reading scores.
RQ1 was answered using Spearman correlation to determine if there was a
statistically significant relationship between student attendance and ACT Aspire Reading
scores for the 382 ninth-grade students in the participating middle school. The result was
a statistically significant positive correlation between these two variables, r = .266(p =
<.001, α = .05). Therefore, the null hypothesis that there is no relationship between the
two variables was rejected. In other words, there was a statistically significant
relationship between student attendance and scores on the ACT Aspire Reading
Assessment.
RQ2 was answered using Spearman correlation to determine if there was a
statistically significant relationship between student discipline and ACT Aspire Reading
scores for the ninth-grade students in the participating middle school. The result showed
that there was a statistically significant correlation between student discipline and ACT
Aspire Reading scores, r = -.114( p = .026, α = .05). Therefore, the null hypothesis that
there is no statistically significant relationship between student discipline and ACT
Aspire Reading scores was rejected. In other words, to answer RQ2, there was a
67
statistically significant relationship between student discipline and ACT Aspire Reading
scores for the ninth-grade students in the participating Northwest Arkansas junior high
school.
RQ3 was answered using multiple linear regression with student attendance,
discipline, gender, and ethnicity as predictor variables for the outcome variable ACT
Aspire Reading scores for ninth-grade students in one Northwest Arkansas junior high
school. The results of the regression analysis were:
Model 1 used student attendance regressed onto ACT Aspire Reading scores. The
results for Model 1 indicate that student attendance significantly predicts these reading
scores, R
2
= .052, R
2
Adj
= .049, F(1, 380) = 20.828, p <.001. This model accounts for
5.2% of the variance in this student sample's ACT Aspire Reading scores.
Model 2 used student attendance and gender regressed onto ACT Aspire Reading
scores. The results for Model 2 indicate that student attendance and gender significantly
predict these reading scores, R
2
= .064, R
2
Adj
= .059, F(2, 379) = 13.018, p < .001. This
model accounts for 6.4% of the variance in this student sample's ACT Aspire Reading
scores.
Model 3 used student attendance, gender, and ethnicity regressed onto ACT
Aspire Reading scores. The results for Model 3 indicate that student attendance, gender,
and ethnicity significantly predict these reading scores, R
2
= .112, R
2
Adj
= .093, F(8, 373)
= 5.895, p <.001. This model accounts for 11.2% of the variance in this student sample's
ACT Aspire Reading scores.
Based upon the results of the multiple regression, the answer to RQ3 was that
while student attendance, gender, and ethnicity all significantly predict the ACT Aspire
68
Reading scores for the ninth-grade students in the participating middle school, student
discipline did not. Therefore, the null hypothesis is partially rejected. Three of the four
predictor variables used in the study did statistically predict the outcome variable.
Implications for Educational Practice
The results of this study show that academic achievement decreases as attendance
decreases. Being present at school is necessary for all students to experience academic
achievement. Out-of-school suspension is commonly given to students who have
committed a serious disciplinary offense. The out-of-school suspension removes the
student from the classroom, causing the student to miss instruction. The out-of-school
suspension is meant to deter negative behavior. However, some students, especially
minorities, who are assigned an out-of-school suspension become repeat offenders. This
shows that the out-of-school suspension is not a deterrent to negative behavior, nor does
it address the root causes of the behavior.
In the researcher’s experience, the out-of-school suspension enables or
encourages negative behavior because students who struggle with behavioral issues view
the out-of-school suspension as a vacation. It is an opportunity for them to leave school
without guidance or accountability. The parents or guardians are usually working, and
any siblings are away at school. The student has the luxury of doing whatever they want
with no accountability, which is generally counterproductive to their education. Upon
return to school, the student who has served an out-of-school suspension is behind in
every class and not in good standing with extracurricular activity sponsors. Additionally,
there is usually no re-entry plan to get the student caught up or address the causes of the
69
behavior that landed the student with the out-of-school suspension in the first place. The
lost instructional time leads to lower academic achievement.
The relationship between lost instructional time due to suspension and academic
achievement has been discussed in the education community for some time. Allensworth
and Evans (2016) state that absenteeism is a direct cause of poor academic achievement
in school, and every instructional day counts. Basford (2021) points out that chronic
absenteeism is an indicator of the school-to-prison pipeline, making absenteeism an issue
that will affect the rest of the student’s life. Absenteeism is a negative indicator of
students' academic achievement and overall success after school.
The results of the present study support the research in this area. In addition to
low attendance being correlated with ACT Aspire Reading scores for the ninth-grade in
this Northwest Arkansas junior high school, the results also indicate that gender and
ethnicity combined with low attendance may predict these scores. Since the
demographics for the students in this study skewed toward non-English speaking students
more than the general population of Arkansas, ethnicity may also correlate to reading
scores.
Recommendations for Educational Practice
1) Since attendance significantly affects reading scores, school leaders need to
find methods to increase attendance.
2) Since discipline and attendance are colinear, that is, the more discipline
referrals and suspensions, the lower the attendance rates of students, school leaders
should review school discipline policies and determine if discipline referrals are being
70
equitably distributed across gender and ethnicity and if not, develop policies that will
make it more equitable.
3) School leaders need to analyze whether at-risk students are chronically absent
and involved in disciplinary actions more than other students. Programs and policies
should be undertaken to help support these students to increase attendance. For instance,
rather than adding to lost instructional time, students exhibiting chronic tardiness and
absenteeism could benefit from support in the form of wraparound services (Kezar et al.,
2020).
Wraparound services are any resources or support outside the curriculum that
schools can provide (Kezar et al., 2020). Schools may be able to provide wraparound
services to remedy underlying student issues such as tardiness or absenteeism (Kezar et
al., 2020). For example, a student struggling with social issues at school may be late or
avoid school altogether. This shows up as tardiness and absenteeism. Rather than only
issuing consequences, such as detention or suspension, this student might benefit from
working with a school counselor or social worker. Social services provided by a school
counselor or social worker may rectify student social issues, thereby improving student
attendance and eliminating lost instructional time (Kezar et al., 2020).
The out-of-school suspension as a consequence of disciplinary infractions is an
area of concern for individuals aware of the short and long-term effects of out-of-school
suspensions on students and missed instructional days in general (Bowers & Schwarz,
2018). Dickinson (2021) states that students are better positioned to experience academic
success if they are present at school. One strategy administrators can use to achieve
higher student attendance is to emphasize extracurricular activity participation.
71
Recommendations for Future Research
This quantitative, correlational study was very narrowly focused regarding
sampling and analysis. It examined only one grade level in one junior high school in one
geographic region of Arkansas. Many streams of research can be expanded from this one
study. Some of the recommendations for future research are provided below.
1) There are over 200 variables that affect a student’s ability to succeed
academically. In the present study, a limited number of variables were examined. A more
detailed and expanded number of variables included in the statistical analysis would
provide more rigorous results.
2) Extracurricular activity participation may strongly correlate to high student
attendance. A study examining the effects of extracurricular activities on attendance and
academic success would help establish methods to increase attendance.
3) Another direction would be to examine schools that use alternatives to out-of-
school suspensions in response to disciplinary infractions and to research programs to
address underlying behavior issues. The data may show that this strategy by school
administrators may be an effective tool to combat chronic absenteeism.
4) Another recommendation is to examine the impact of social and emotional
health support on students with chronic behavior problems that typically result in out-of-
school suspension. Students may suffer from some underlying individual issues that
result in absenteeism. There are many ways to further this study in the future.
5) The present study could be replicated in other districts with a more in-depth
look at alternate responses to behavior infractions other than out-of-school suspension.
72
6) Studies using other methods and designs, such as qualitative or mixed methods
designs, may reveal a deeper understanding of the issues by investigating the perceptions
of teachers and principals to these issues, as well as students who are engaged in
disciplinary actions and low attendance.
Study Summary
I had a few expectations coming into this research. Chronic absenteeism was an
issue that needed to be resolved to facilitate school improvement. In reviewing
suspension data, the out-of-school suspension as a response to negative behavior is one
factor of school improvement that school leadership can fix immediately simply by
practicing other responses to negative student behavior. Coming into this research, I
believe school suspension dramatically affects overall school performance more than
many school leaders realize. The out-of-school suspension is not viewed as a punishment
by the student but as a reward. It does not address, much less solve, the underlying reason
for the negative behavior. It is a direct cause of lost instructional time, leading to more
negative behavior. It also affects school ratings because the school information system
counts out-of-school suspensions as absent. Coming into this research, I believed that the
out-of-school suspension would have the same effect regardless of gender or ethnicity.
The most significant learning experience through this research was studying the data and
implementing changes in my school while completing this research. I found that
responses to negative student behavior other than out-of-school suspension have proven
to be much more effective as a school leader. Rather than out-of-school suspension as a
response to negative student behavior, we have support sessions with the student
involving our school counselor, behavior specialist, a loved one, which may not always
73
be a parent, an administrator, a teacher, and sometimes other individuals, to identify the
reason for the negative behavior and identify what we can do as a team to help remedy
the underlying cause of the negative behavior. This has had a tremendous impact on our
attendance. Last school year, we were at about twenty-three percent chronic absenteeism.
This school year, we are at zero percent chronic absenteeism. Only some students
in the school are anywhere near on pace to be in the chronic absenteeism category. If
there is one thing that I could have done better, it would be to extend the research to
study alternatives to out-of-school suspension and the success rates of specific data points
at other schools according to those alternatives. However, I do believe I accomplished my
goal with this research: to study the effects of attendance on academic achievement.
74
REFERENCES
Abacioglu, C. S., Volman, M., & Fischer, A. H. (2020). Teachers’ multicultural attitudes
and perspective taking abilities as factors in culturally responsive teaching. British
Journal of Educational Psychology, 90(3), 736–752.
https://libcatalog.atu.edu:2217/10.1111/bjep.12328
Abro, A. M., Shah, A. A., & Shah, S. S. (2018). The nexus between co-curricular
activities and academic performance: A case study of higher secondary schools of
Kamber, Shahdadkot. New Horizons (1992-4399), 12(2), 33–43.
https://libcatalog.atu.edu:2217/10.2.9270/NH.12.2(18).03
Allensworth, E., & Evans, S. (2016). Tackling absenteeism in Chicago. Phi Delta
Kappan, 98(2), 16–21.
https://libcatalog.atu.edu:2217/10.1177/0031721716671900
Arcia, E. (2006). Achievement and enrollment status of suspended students. Outcomes in
a large, multicultural school district. Education & Urban Society, 38(3), 359–369.
https://libcatalog.atu.edu:2217/10.1177/0013124506286947
Basford, L., Lewis, J., & Trout, M. (2021). It can be done: How one charter school
combats the school-to-prison pipeline. Urban Review, 53(3), 540–562.
https://libcatalog.atu.edu:2217/10.1007/s11256-020-00583-x
Baysu, G., Agirdag, O., & De Leersnyder, J. (2023). The association between perceived
discriminatory climate in school and student performance in math and reading: A
cross-national analysis using PISA 2018. Journal of Youth & Adolescence, 52(3),
619–636. https://libcatalog.atu.edu:2217/10.1007/s10964-022-01712-3
75
Beluce, A. C., Inácio, A. L. M., de Oliveira, K. L., & Pires Franco, S. A. (2018). Reading
comprehension and self-perceived school performance in elementary school.
Psico-USF, 23(4), 597–607. https://libcatalog.atu.edu:2217/10.1590/1413-
82712018230401
Bowers, L. M., & Schwarz, I. (2018). Preventing summer learning loss: Results of a
summer literacy program for students from low-SES homes. Reading & Writing
Quarterly, 34(2), 99–116.
https://libcatalog.atu.edu:2217/10.1080/10573569.2017.1344943
Burney, V., & Beilke, J. (2008). The constraints of poverty on high achievement. Journal
for the Education of the Gifted, 31, 295–321.
D’Agostino, E. M., Day, S. E., Konty, K. J., Larkin, M., Saha, S., & Wyka, K. (2018).
The association of fitness and school absenteeism across gender and poverty: A
prospective multilevel analysis in New York City middle schools. Annals of
Epidemiology, 28(3), 189–196.
https://libcatalog.atu.edu:2217/10.1016/j.annepidem.2017.12.010
Daniels, E. (2017). Curricular factors in middle school teachers’ motivation to become
and remain effective. Research in Middle Level Education Online, 40(5), 1–14.
https://libcatalog.atu.edu:2217/10.1080/19404476.2017.1300854
Danzig, A., & Aljarrah, A. (1999). Computer use among secondary school students in a
Colorado school-to-career project. NASSP Bulletin, 83(607), 96–104.
https://libcatalog.atu.edu:2217/10.1177/019263659908361112
Dickinson, J., Griffiths, T. L., & Bredice, A. (2021). “It’s just another thing to think
about”: Encouraging students’ engagement in extracurricular activities. Journal of
76
Further & Higher Education, 45(6), 744–757.
https://libcatalog.atu.edu:2217/10.1080/0309877X.2020.1813263
Essex, M. (1962). How can parents and special educators best cooperate for the education
of exceptional children? Exceptional Children, 28(9), 478–482.
https://libcatalog.atu.edu:2217/10.1177/001440296202800908
Fallis, R. K., & Opotow, S. (2003). Are students failing school or are schools failing
students? Class cutting in high school. Journal of Social Issues, 59(1), 103–119.
https://libcatalog.atu.edu:2217/10.1111/1540-4560.00007
Fisher, D., & Frey, N. (2021). New thinking about student engagement: Research models
show what engagement really looks like. Educational Leadership, 79(4), 76–77.
Grasley-Boy, N. M., Gage, N. A., Lombardo, M., & Anderson, L. (2022). The additive
effects of implementing advanced tiers of SWPBIS with fidelity on disciplinary
exclusions. Journal of Positive Behavior Interventions, 24(3), 183–195.
https://libcatalog.atu.edu:2217/10.1177/10983007211011767
Gottfried, M. A. (2019). Chronic absenteeism in the classroom context: Effects on
achievement. Urban Education, 54(1), 3–34.
https://libcatalog.atu.edu:2217/10.1177/0042085915618709
Herman, R. (2012). Scaling school turnaround, Journal of Education for Students Placed
at Risk (JESPAR), 17(1-2), 25–33. DOI: 10.1080/10824669.2012.637166
Hughes, A. F., & Adera, B. (2006). Education and day treatment opportunities in schools:
Strategies that work. Preventing School Failure, 51(1), 26–30.
https://libcatalog.atu.edu:2217/10.3200/PSFL.51.1.26-30
77
Kennedy-Lewis, B. L., & Murphy, A. S. (2016). Listening to “frequent flyers”: What
persistently disciplined students have to say about being labeled as “bad.”
Teachers College Record, 118(1), 1–40.
https://libcatalog.atu.edu:2217/10.1177/016146811611800106
Kezar, A., Kitchen, J. A., Cole, D., Newman, C. B., & Hypolite, L. I. (2020). Sense of
belonging and mattering among two cohorts of first-year students participating in
a comprehensive college transition program. American Behavioral Scientist,
64(3), 276–297. https://libcatalog.atu.edu:2217/10.1177/0002764219869417
Lapasau, M., Virgana, V., Kasyadi, S., Mayasari, I., & Riyanti, A. (2022). Enhancing
students’ achievement in math word problems through reading comprehension
and learning motivation. AIP Conference Proceedings, 2577(1), 1–5.
https://libcatalog.atu.edu:2217/10.1063/5.0096103
Lasater, K., Bengtson, E., & Albiladi, W. S. (2021). Data use for equity?: How data
practices incite deficit thinking in schools. Studies in Educational Evaluation, 69,
N.PAG. https://libcatalog.atu.edu:2217/10.1016/j.stueduc.2020.100845
Learning Services. ADE Division of Elementary and Secondary Education. (n.d.).
Retrieved 2022-2023 from https://dese.ade.arkansas.gov/Offices/learning-
services/assessment/act-aspire
Li, J., & Xue, E. (2023). Dynamic interaction between student learning behaviour and
learning environment: Meta-analysis of student engagement and its influencing
factors. Behavioral Sciences (2076-328X), 13(1), 59.
https://libcatalog.atu.edu:2217/10.3390/bs13010059
78
Li, X., Bergin, C., & Olsen, A. A. (2022). Positive teacher-student relationships may lead
to better teaching. Learning & Instruction, 80, N.PAG.
https://libcatalog.atu.edu:2217/10.1016/j.learninstruc.2022.101581
Maag, J. W., & Katsiyannis, A. (2010). School-based mental health services: Funding
options and issues. Journal of Disability Policy Studies, 21(3), 173–180.
https://libcatalog.atu.edu:2217/10.1177/1044207310385551
Montero-Sieburth, M., & Turcatti, D. (2022). Preventing disengagement leading to early
school leaving: Pro-active practices for schools, teachers and families.
Intercultural Education, 33(2), 139–155.
https://libcatalog.atu.edu:2217/10.1080/14675986.2021.2018404
Neth, E. L., Caldarella, P., Richardson, M. J., & Heath, M. A. (2020). Social-emotional
learning in the middle grades: A mixed-methods evaluation of the strong kids
program. Research in Middle Level Education Online, 43(1), 1–13.
https://libcatalog.atu.edu:2217/10.1080/19404476.2019.1701868
New Act Assessment System to be named ACT ASPIRE™ - Newsroom. ACT. (n.d.).
Retrieved April 12, 2023, from
https://www.act.org/content/act/en/newsroom/new-act-assessment-system-to-be-
named-act-aspire.html
Palmer, A. N., Elliott, W., & Cheatham, G. A. (2017). Effects of extracurricular activities
on postsecondary completion for students with disabilities. Journal of
Educational Research, 110(2), 151–158.
https://libcatalog.atu.edu:2217/10.1080/00220671.2015.1058221
79
Peck, C., & Reitzug, U. C. (2014). School turnaround fever: The paradoxes of a historical
practice promoted as a new reform. Urban Education, 49(1), 8-38.
Power, S., Taylor, C., Rees, G., & Jones, K. (2009). Out-of-school learning: Variations in
provision and participation in secondary schools. Research Papers in Education,
24(4), 439–460. https://libcatalog.atu.edu:2217/10.1080/02671520802584095
Public School Accountability. ADE Division of Elementary and Secondary Education.
(n.d.). Retrieved February 27, 2022, from
https://dese.ade.arkansas.gov/Offices/public-school-accountability/school-
performance/report-card
Ray, A. B., & Graham, S. (2021). A college entrance essay exam Intervention for
students with high-incidence disabilities and struggling writers. Learning
Disability Quarterly, 44(4), 275-287.
https://libcatalog.atu.edu:2217/10.1177/0731948720917761
Rieg, S. A. (2007). Classroom assessment strategies: What do students at-risk and
teachers perceive as effective and useful? Journal of Instructional Psychology,
34(4), 214–225.
Roby, D. E. (2004). Research on school attendance and student achievement: A study of
Ohio schools. Educational Research Quarterly, 28(1), 3–14.
Rose, R. A., & Bowen, N. K. (2021). The effect on high school drop-out of a middle
school relevance intervention. Journal of Educational Research, 114(6), 526–536.
https://libcatalog.atu.edu:2217/10.1080/00220671.2021.1993123
Rury, J. L., Belew, R., & Hurst, J. (2022). The origins of American test-based educational
accountability and controversies about its impact, 1970–1983. Teachers College
80
Record, 124(1), 143–163.
https://libcatalog.atu.edu:2217/10.1177/01614681221086094
Shaffer, M. L. (2019). Impacting student motivation: Reasons for not eliminating
extracurricular activities. JOPERD: The Journal of Physical Education,
Recreation & Dance, 90(7), 8–14.
https://libcatalog.atu.edu:2217/10.1080/07303084.2019.1637308
Shane, H. G. (1991). Improving education for the twenty-first century. Education Digest,
56(8), 12–14.
Shin, M., & Bolkan, S. (2021). Intellectually stimulating students’ intrinsic motivation:
The mediating influence of student engagement, self-efficacy, and student
academic support. Communication Education, 70(2), 146–164.
https://libcatalog.atu.edu:2217/10.1080/03634523.2020.1828959
Tyre, A., Feuerborn, L., & Pierce, J. (2011). Schoolwide intervention to reduce chronic
tardiness at the middle and high school levels. Preventing School Failure, 55(3),
132–139. https://libcatalog.atu.edu:2217/10.1080/10459880903472918
U.S. Department of Education, Office of Elementary and Secondary Education. (2018). A
state’s guide to the U.S. Department of Education’s assessment peer review
process. Washington, DC: U.S. Department of Education. Retrieved from
https://www2.ed.gov/admins/lead/account/saa/assessmentpeerreview.pdf.
Varjas, K., Henrich, C., & Meyers, J. (2009). Urban middle school students’ perceptions
of bullying, cyberbullying, and school safety. Journal of School Violence, 8(2),
159–176. https://libcatalog.atu.edu:2217/10.1080/15388220802074165
81
Welsh, R. O. (2022). Schooling levels and school discipline: Examining the variation in
disciplinary infractions and consequences across elementary, middle, and high
schools. Journal of Education for Students Placed at Risk, 27(3), 270–295.
https://libcatalog.atu.edu:2217/10.1080/10824669.2022.2041998
Williams, K. J., Martinez, L. R., Fall, A. M., Miciak, J., & Vaughn, S. (2023). Student
engagement among high school English learners with reading comprehension
difficulties. School Psychology Review, 52(1), 38–56.
https://libcatalog.atu.edu:2217/10.1080/2372966X.2020.1868948
82
Appendices

83
Appendix A: ATU IRB Approval Letter

84
Appendix B: District Approval to Conduct Study
---------- Forwarded message ---------
From: MARCIA SMITH <msmith1@sdale.org>
Date: Wed, Jun 28, 2023, 9:38 AM
Subject: Re: Reserach
To: DR. JEFF FLANIGAN <jflanigan@sdale.org>, Shannon Tisher
<stisher@sdale.org>, Kelli Langan <klangan@sdale.org>
Dr. Flanigan,
This is a little unusual. The documents were not sent to Dr. Langan so we had to proceed
differently.
The Research Committee read over everything last night and approved the
research. Please use this email as approval.
Dr. Langan is reaching out to Albert to see about pulling the needed research data.
All our best,
MS
