
! ! !
Prepared by:
Mark Willingham, MS
Sophie Gralapp, MA
John P. Barile, PhD
Department of Psychology
University of Hawaiʻi at Mānoa
2530 Dole Street, Sakamaki Hall C404
Honolulu, Hawaiʻi 96822
Law Enforcement Assisted
Diversion Honolulu
2-Year Program Evaluation Report
October 1, 2020

LEAD Honolulu 2-Year Evaluation
! ! !
i!
This report presents the status of the Hawaiʻi Health and Harm
Reduction Center (HHHRC) Law Enforcement Assisted Diversion
Honolulu (LEAD HNL) program on the island of O‘ahu for the State
of Hawaiʻi, including the neighbor islands of Kaua’i, Maui, and the
Island of Hawaiʻi. This report includes background information on
the program, the evaluation approach, program implementation, and
presents outcomes and impacts for years 1 (July 1, 2018-July 31,
2019) and 2 (August 1, 2019-July 31, 2020) project period beginning
July 1, 2018 to July 31, 2020. It concludes with recommendations
based on these findings.
This report was prepared by the University of Hawaiʻi at Mānoa LEAD Program Evaluation
Team with important contributions from the LEAD Honolulu Hui, as well as State of Hawaiʻi
neighbor island LEAD partners and staff.
Author Contact for questions regarding this report:
John P. Barile, PhD
Interim Director, Social Science Research Institute
Associate Professor of Psychology
College of Social Sciences
University of Hawaiʻi at Mānoa
2530 Dole Street
Saunders 704D
Honolulu, HI 96822-2294
Phone: (808) 956-7469
Email: [email protected]
Website: jackbarile.com | uhecolab.com

LEAD Honolulu 2-Year Evaluation
! ! !
ii!
Table of Contents
I. Executive Summary …………………………………………………………….
1
II. LEAD Program Background……………………………………………...........
5
III. LEAD on the Neighbor Islands…….…………………………………………..
8
Expansion of LEAD…………………………………………...…..
9
Kaua’i…………………………………………………………………….…..
10
Maui……………………………………………………………………..…....
11
Island of Hawai’i……………………………………………………….….…
13
LEAD on the Neighbor Islands Summary…………………………….……...
15
IV. LEAD Honolulu Program Implementation…………………………………...
16
Triaged Only………………………………………………………….……...
17
Referrals…………………………………………………………..…………..
20
Enrollments………………………………………………………..…….…....
22
Service Engagement….………………………………….………..………….
28
Services Needed & Used……………...…………….….………….................
28
HHHRC Clinic Collaboration and LEAD Clients………...……….................
32
V. LEAD Honolulu Outcomes & Impacts………………………………………...
33
Short-Term Goals………………………………………………………...…..
35
Housing Stability…………………………………………………..…......
35
Substance Use….………………………………….…………….………..
37
Stress………………………….….………….............................................
39
Long-Term Goals……………………………………………………….…...
40
Emergency & Hospital Use………………………………….…………...
40
Crime & Recidivism….……………………………….…………….…….
41
Quality of Life………………………….….…………...............................
45
Client Testimonials……………………………………………….…............
48
Conclusions……………………………………………………….….............
50
VI. Recommendations……………………………………………………………….
51
Recommendations for the Program………………………………………….
52
Recommendations for Funders & Other Stakeholders……………...……….
53
VII. Next Steps………………………………………………………….….…………
54
For Evaluators………………………………………………………..……...
55
VIII. Appendices………………………………………….…………………………...
56
Appendix A: Logic Model…………………………………...……..………...
57
Appendix B: Evaluation Methodology..……………….….…………….........
58
Appendix C: Evaluation Timeline………………………………......………..
62

LEAD Honolulu 2-Year Evaluation
! ! !
iii!
List of Figures
Fig. 1 Triage Age…………..………………………………………………………...….
19
Fig. 2 Triage Gender……………….………………………………...…………...........
19
Fig.!3!!Triage!Ethnicity…….…………………………..………………………..…………………………..
19
Fig. 4 Mode of Referrals for LEAD HNL Participants……..………………………..
21
Fig. 5 Referral Locations……………………………..………………………………...
22
Fig. 6 Enrolled Client Age……………………………...…….……......…………...…..
24
Fig. 7 Enrolled Client Gender……………….……………………………...…….……
24
Fig. 8 Enrolled Client Highest Level of Education.……………………………..…....
24
Fig. 9 Enrolled Client Family Status...…….…………………………………….….…
24
Fig. 10 Enrolled Client Ethnicity………………….....………………………….……...
25
Fig. 11 Enrolled Client Drug Use in the Past 6 Months.……………………………...
26
Fig. 12 Triage Drug Use in the Past 6 Months.……..………………………….……...
26
Fig. 13 Enrolled Client Experienced Homelessness in the Past 3 Years .......………..
27
Fig. 14 Triage Currently Experiencing Homelessness……………………...………...
27
Fig. 15 Triage & Referred Individuals Services Interested in Receiving…………….
29
Fig. 16 Triage & Referred Individuals Services Currently Receiving……………….
29
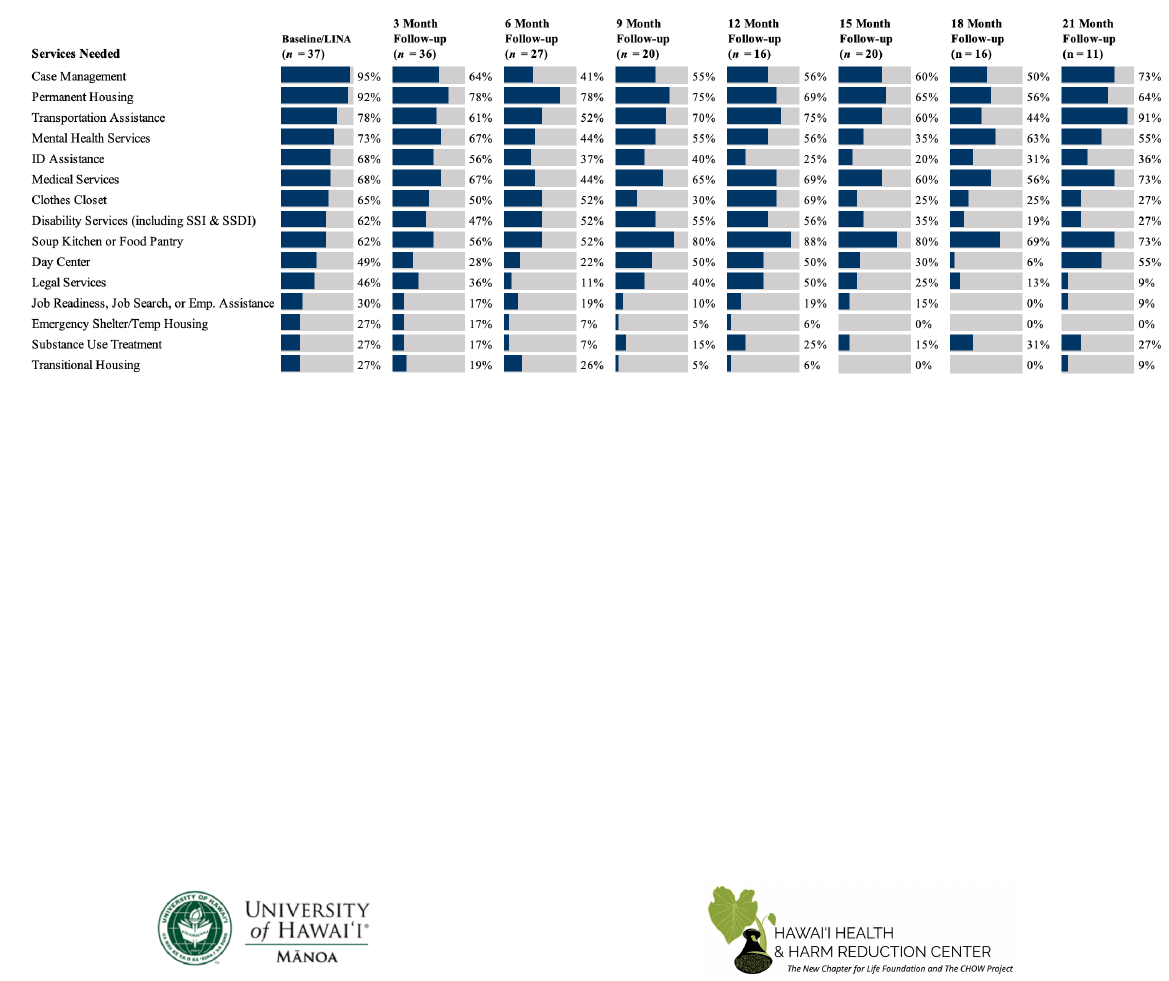
Fig. 17 Percent of Enrolled LEAD Clients Indicating Services Needed over Time in the
Program……………………………………………………………………….
30
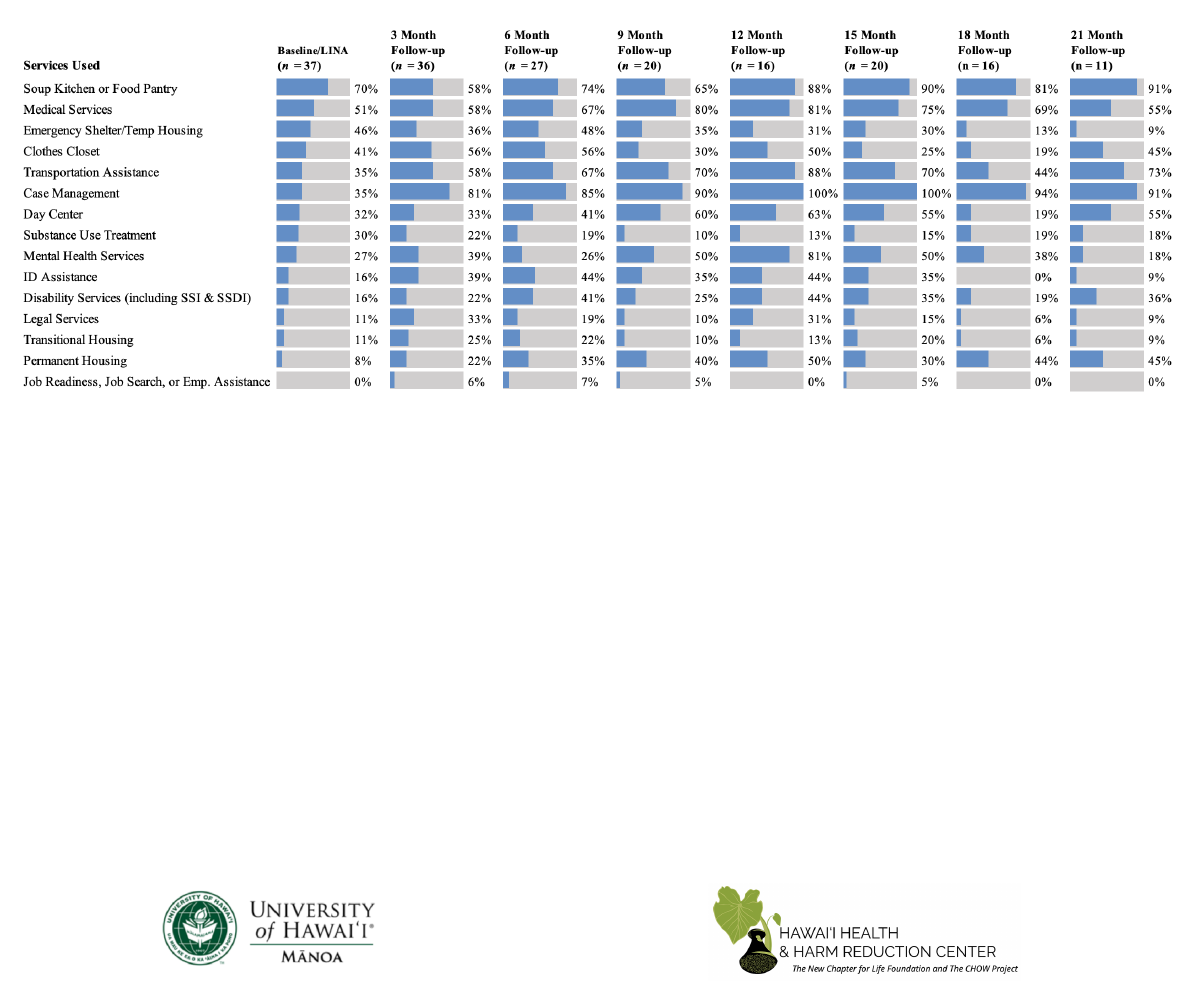
Fig. 18 Percent of Clients Indicating Using Services over Time in the Program……...
31
Fig. 19 HHHRC Clinic Collaboration and Services Provided to Clients…….…..…….
32
Fig. 20 LEAD Theory of Change………………………………………………..…….
34

LEAD Honolulu 2-Year Evaluation
! ! !
iv!
Fig. 21 Average Number of Days Used Each Substance in the Past Month at First &
Last Assessment Since the Start of the Program…………….…..……………
37
Fig. 22 Percent Change in Substance Use from First to Last Assessment…………...
38
Fig. 23 Change in Client Perceived Stress from First to Last Assessment in the Past
Month………………………………………………………………...……..
39
Fig. 24 Change in Client Usage of Emergency Rooms & Hospitals in the Past Month
from First to Last Assessment…....…………………………….………...
40
Fig. 25 Number of Citations Issued to LEAD Clients Prior to Referral Beginning July
1, 2015 – Most Frequently Issued……………………….………………..
42
Fig. 26 Number of Citations Issued to Triage Clients Prior to July 1, 2018, Beginning
July 1, 2015 – Most Frequently Issued……………………………….……
42
Fig. 27 LEAD Client Cited Encounter Frequency Per Client over the Course of the
Program……………………………………………………….......................
43
Fig. 28 Triaged only Clients Cited Encounter Frequency Per Client over the Course of
the Program….……………………………………………………………...
44
Fig. 29 Change in Community Support from First to Last Assessment……..………
45
Fig. 30 Change in Social Support from First to Last Assessment……………………
45
Fig. 31 Change in Client Health and Wellbeing from First to Last Assessment…….
46
Fig. 32 Frequency of Experiences with Trauma………………………………………
47
Fig. 33 LEAD Clients Compared to General HI Population in Number of Unhealthy
Days………………………………………………………………………….
47

LEAD Honolulu 2-Year Evaluation
! ! !
1!
I. LEAD Honolulu 2-Year Program Evaluation Report
Executive Summary

LEAD Honolulu 2-Year Evaluation
! ! !
2!
LEAD Honolulu 2-Year Program Evaluation Report
Executive Summary
Program Background
• The goal of LEAD HNL is to reduce client recidivism for minor offenses by diverting
individuals who have committed minor offenses away from the criminal justice system
and into the social services sector. The program seeks to achieve this by engaging clients
in social services aimed at addressing housing, substance use, behavioral health, and
physical health issues.
• As of September 2020, LEAD HNL diversion referrals have not begun. Therefore, all
referrals described in this report came through “social contact.” Social contact referrals
have been conducted in collaboration with Honolulu Police Department (HPD) Health
Efficiency Long-term Partnership (H.E.L.P.) initiative and the Sheriff’s Division of the
Hawai’i Department of Public Safety in collaboration with the Office of the Governor's
Coordinator on Homelessness.
• Between July 1, 2018 and July 31, 2020, 101 individuals who were referred to LEAD
through different outlets were provided services or triaged out to services through the
LEAD HNL program. Of those 101 individuals, 57 individuals were referred to LEAD
HNL through social contact referral and 44 were triaged out to other service providers.
Of those 57 referred clients, 50 were enrolled in and received services through LEAD
HNL.
Client Background
• Enrolled clients’ gender were comprised of 48% identifying as female, 40% identifying
as male, and 12% identifying as transgender or gender fluid 12%.
• Half of enrolled clients were Native Hawaiian/Pacific Islander (50%) and over half of
enrolled clients were multiracial (54%).
• Half of enrolled clients were single (50%) and nearly a quarter (22%) were divorced.
• The highest reported education achieved by clients was graduated from high school or
received a GED (36%). However, few enrolled clients graduated from college (4%).
• The majority of enrolled clients reported they were currently experiencing homelessness
(76%), and nearly a quarter (22%) had experienced homelessness within the past three
years but were not experiencing homelessness at the time of enrollment.
• At the time of enrollment, 78% reported using methamphetamine, 36% reported using
alcohol, and 36% reported using opioids and/or heroin within the six months prior.!

LEAD Honolulu 2-Year Evaluation
! ! !
3!
Findings
• Over the two-year study period, the vast majority of clients consistently cited permanent
housing as a service they needed.
• LEAD HNL client service use generally increased over time, particularly the use of case
management, medical services, transportation assistance, and permanent housing
services.
• On average, clients had 7% more cited encounters with law enforcement after referral to
the LEAD HNL program. But, this was substantially lower than the number increase in
citations of clients who were triaged into services, but not enrolled into the LEAD
program due to various reasons ranging from the program being at capacity to the
individual not fitting the program criteria (93%). This suggests that the number of
citations by HPD to people experiencing homelessness likely increased at a similar or
greater rate during this period.
• On average, LEAD HNL clients reported a decrease in use of emergency shelters (53%
decrease) and an increase in use of transitional shelters (46% increase).
• Despite increases in clients who lived in an independent apartment for the entire previous
month at first assessment (4%) to 33% at the last assessment, clients were still unlikely to
be living in a shared apartment (on average 3.21 days per month) or an independent
apartment (10.29 days a month) at last assessment.
• Eighteen out of the 49 LEAD HNL clients (37%) are currently housed with a housing
voucher.
a
• LEAD HNL clients indicated using methamphetamines 18.33 days in the previous month
when first assessed. Opioids/heroin was the second most frequently used substance at
11.67 days, followed closely by marijuana (11.56 days) and alcohol (6.3 days). No other
drugs surpassed an average of 6 days a month at first assessment.
• The average number of days a month LEAD HNL clients (who self-reported use) used
methamphetamines decreased by 23% (from and average of 18.33 days a month to 14.06
days a month, with 17% reporting no use at last assessment), while alcohol use increased
by 11% (an increase from just over 6 days a month to 7 days a month).
!
• Reports of client hospital admissions decreased from 10% of clients reporting being
admitted to a hospital during the previous month at first assessment to 7% at last
assessment. A small decrease in hospital admissions is not unexpected given that many of
the clients suffered from untreated medical conditions prior to obtaining services.
a
!Due to 1 LEAD client passing away, counts may reflect 49 clients versus 50 to show comparison. !
!

LEAD Honolulu 2-Year Evaluation
! ! !
4!
• Emergency room visits decreased from 32% of clients reporting visiting them in the
previous month to 14% at last assessment.
• While number of days in pain decreased slightly (2.88%), the number of physically
unhealthy days increased by 20% by July 2020. Conversely, last assessment before the
COVID-19 emergency orders indicated a 24% decrease in the number of days in
pain and the number of physically unhealthy days increased by 5% from first to last
assessment in the prior 30 days, indicating clients reported notably better physical
health before the COVID-19 emergency order date.
b
• It should be noted that despite some improvements in clients’ general health and quality
of life, they continue to fare much worse than the average adult living in Hawai’i.
Conclusions
• While the number of cited encounters with law enforcement for enrolled LEAD clients
slightly increased after referral to the program, the increase was substantially lower than
the number of cited encounters with law enforcement after the start of the LEAD program
for those who were triaged for the program but not enrolled, suggesting that the number
of citations by HPD to people experiencing homelessness may increase at a similar or
greater rate during this period, affecting the primary goal of reducing recidivism rates of
program clients. At the time of this report, changes in cited encounters was accomplished
solely through social referral, which lacks the potential threat of legal action if clients do
not engage with the program following referral.
• Our evaluation found notable improvements in the stability of housing experienced by
clients since enrollment in the program as well as their overall quality of life.
Specifically, participants increased the amount of social support they received, reported
decreased stress, and improved mental health. They still reported considerable substance
use; however, there were decreases in self-reported drug use for 6 out of 7 types of
substances used in the past month. Furthermore, operating under a harm reduction model,
these are the considerations that might be best addressed after a period of stabilization in
other aspects of clients’ lives.
• We recommend the continued expansion of the program across the entirety of the City,
County, and State, including continuing the LEAD neighbor island pilot programs that
lost funding for various reasons over the 2020 summer. We also strongly recommend the
introduction of the diversion arm of the program by establishing partnerships with local
law enforcement, the prosecutor’s office, and other criminal justice agencies. With the
potential costs savings associated with reduced hospital admissions and emergency room
use and the decreased burden on the criminal justice system, this program will likely
result in net savings as well as improving the lives of those to participate.!
b
!Outcomes and impacts related to the COVID-19 pandemic will be highlighted throughout the report.
These highlighted points are indicated by being in light blue and bold type face.

LEAD Honolulu 2-Year Evaluation
! ! !
5!
II. LEAD Program Background

LEAD Honolulu 2-Year Evaluation
! ! !
6!
The LEAD Model
Law Enforcement Assisted Diversion (LEAD) is a diversion program that aims to improve
public safety and to reduce criminal behavior.
1
Under the LEAD program model, law
enforcement officers connect low-level, non-violent offenders or individuals at high risk of arrest
with social service providers in lieu of arrest. The LEAD program is unique from other diversion
programs in that:
• diversion occurs pre-booking instead of after arrest;
• LEAD provides participants with immediate case management;
• LEAD is a collaborative effort, involving law enforcement, community organizations,
and public officials
1
; and
• LEAD was funded and supported by the Hawaiʻi State Department of Health, Alcohol
and Drug Abuse Division (ADAD), which is also an active LEAD Hui participant.
The original LEAD program in Seattle, Washington showed successful outcomes. After three
years of operation, a 2015 study found that LEAD participants were 58% less likely to be
arrested after enrollment in the program compared to a control group that went through “system
as usual” criminal justice processing.
2
Additionally, preliminary program data collected by case
managers indicated that LEAD improved the health and wellbeing of people struggling with
poverty, drug use, and mental health problems. Furthermore, the collaboration between
stakeholders, who were often otherwise at odds with one another, proved an invaluable process-
oriented outcome.
3
LEAD Honolulu
In collaboration with Hawai’i Department of Health and the
Office of the Governor's Coordinator on Homelessness, the
Hawai’i state legislature funded the current program through
the Alcohol and Drug Abuse Division (ADAD) in 2017. The
“LEAD HNL” pilot launched July 1, 2018 and aimed to
follow the original LEAD model by focusing specifically on
people whose criminal activity is due to behavioral health
issues (the 2019 LEAD HNL 1-Year Program Evaluation
Report can be found at: https://www.hhhrc.org/lead).
4
LEAD HNL’s intensive case management further aims to
help individuals, many of whom have cycled in and out of
jails and prisons, receive the assistance they need to face
complex issues (e.g., homelessness, substance use, and
mental illness).
4
In addition to aiming to improve individual wellbeing,
LEAD HNL aims to help Hawai’i decrease recidivism
rates, address overcrowded correctional facilities, and
LEAD Hui: A major
component of LEAD HNL is the
engagement and coordination of
services with key stakeholders.
The “LEAD Hui” is a group of
over 30 organizations who meet
one time per month to
coordinate the implementation
of LEAD. Members include
homeless service providers,
substance use treatment
facilities, and representatives
from the Department of Health,
the Honolulu Police Department
(HPD), the Office of the
Governor's Coordinator on
Homelessness, and the Alcohol
and Drug Abuse Division
(ADAD).

LEAD Honolulu 2-Year Evaluation
! ! !
7!
transform Hawai’i’s criminal justice system from punitive to rehabilitative. Given that nearly
three fourths of Hawai’i’s jail and prison population are incarcerated for misdemeanors, petty
misdemeanors, technical offenses, or violations
5
—the kinds of offenses targeted by LEAD—the
program is well-positioned to help address these systemic issues.
LEAD Evaluation Goals
This evaluation report will focus on the implementation of the LEAD program for the City and
county of Honolulu between July 1, 2018 and July 1, 2020 (Years 1 and 2), briefly introduce
LEAD pilot programs for the neighboring islands of Kaua’i, Maui, and the Island of Hawai’i,
(Year 1), and outline the evaluation methods used. In particular, this evaluation aims to:
• highlight key demographics of the LEAD clients;
• understand clients’ services needed and received while engaged with LEAD;
• changes in client progress between Years 1 and 2;
• assess fidelity to the LEAD model and any necessary modifications;
• detect and report outcomes and impacts (COVID-19 related where essential)
c
; and
• examine achievements and goals of LEAD HNL.
This report outlines progress achieved thus far and explains the evaluation plan and
implementation in more detail.
c
!Honolulu Mayor Kirk Caldwell issued a stay-at-home, work-from-home order for Honolulu that went
into effect on March 23, 2020 because of the COVID-19 pandemic. This order was originally meant to
be in effect until April 30, 2020; however, because of increased cases and community spread, the stay-
at-home, work-from-home order along with the March 26, 2020 Governor David Ige self-quarantine
14-day order were both continuously pushed back. These orders caused disruption of daily life for all of
the Hawai’i islands. LEAD staff felt the effects of the pandemic and political orders and case
management had to be restructured.!!
!

LEAD Honolulu 2-Year Evaluation
! ! !
8!
III. LEAD on the Neighbor Islands

LEAD Honolulu 2-Year Evaluation
! ! !
9!
Expansion of LEAD
At the conclusion of Year 1 of LEAD HNL on Oʻahu, LEAD
expanded to the neighbor islands of Kaua’i, Maui, and the Island of
Hawaiʻi through funding provided by Act 209, Session Laws of
Hawaii 2018. Based on lessons learned from LEAD HNL, the Kaua’i,
Maui, and Island of Hawaiʻi pilots included a shelter and housing
component to provide short-term stabilization beds for LEAD clients.
The following organizations administered LEAD in partnership with
County Prosecuting Attorney’s offices and Police Departments:
• Kaua’i: Women in Need
d
• Maui: Mental Health Kokua
e
• Island of Hawaiʻi: Big Island Substance Abuse Council
f
Each individual LEAD pilot program is implemented differently than LEAD HNL in order to
allow for neighbor islands to make changes within each jurisdiction as deemed necessary to
maximize implementation in combination with adhering to the overall LEAD model and its key
principles as much as possible. Local adaptation of the overall LEAD model is integral to the
success of the program in that it helps to: gain buy-in from local partners and stakeholders and
give each individual program the flexibility to adjust to the needs of each individual community.
d
https://www.winhi.org
e
https://mhkhawaii.weebly.com
f
http://www.bisac.org !

LEAD Honolulu 2-Year Evaluation
! ! !
10!
Kaua’i
According to local news, LEAD on the island of Kaua’i (LEAD Kaua’i) launched in December
of 2019 in Lihue, Kaua’i.
g
LEAD Kaua’i has screened 11 potential LEAD clients, but only 2
have had subsequent contact as of April 14, 2020. So far, recruiting LEAD Kaua’i clients has
been a difficult process for the program. To begin, potential clients are screened using the LEAD
Kaua’i screening form to determine if they are eligible for the program. A few potential clients
have completed the initial screening intake forms. However, staff followed-up with these
potential clients to build rapport and establish trust, but were unable to locate the potential
clients. LEAD Kaua’i staff are currently utilizing social referrals and outreach through the public
defender’s office and the prosecutor’s office. In addition, staff are working with a local judge to
try to establish some form of a jail diversion in the future. The public defender’s office,
prosecutor’s office, and local judge are providing potential clients for three different charges,
including theft and possession of 3 grams or less of marijuana.
It is of note that the recent COVID-19 pandemic has slowed these referrals down. So far, the
biggest challenge the LEAD Kaua’i staff are facing is locating potential clients through follow-
ups, such as incorrect contact information, telephones being out of service, and clients not being
at the locations where they were referred or are known to frequent. The majority of the potential
clients screened were homeless, suffered from substance use, a few had traffic citations, and
some have been engaged in mental health services.
LEAD Kaua’i collaborators include the Kaua’i Police Department (KPD), the prosecutor’s
office, the Department of Land and National Resources (DLNR), Mental Health Kokua, the park
rangers, the Housing Agency, the Chief of KPD, and Captain Green of KPD who all refer
potential clients to LEAD Kaua’i. LEAD Kaua’i has a good relationship with the public
defender’s office, but is working on improving their relationship with KPD and getting their buy-
in in order to collaborate with them to refer potential clients. LEAD Kaua’i staff is working with
the child welfare office to expand social referrals. Clients referred through the prosecutor’s office
receive a citation, and then the police officer sends LEAD Kaua’i staff a notice that the person
fits the description of a LEAD Kaua’i client. LEAD Kaua’i staff then follow-up with the client to
complete an initial screening with them. In regards to reissuing citations initially received by
clients, this decision depends upon what services the client might qualify for and if they
complete the services as well as if they agree to attend and complete treatment. Depending upon
how successfully the client completes the services in the program, the citation may be dropped
and if not, the citation will not be dropped. However, this criterion has not been fully established
because LEAD Kaua’i has not had a client complete the program yet.
LEAD Kaua’i does not have established team meetings at this time, but are working on
implementing regular team meetings for check-ins, establishing the groundwork for the program,
creating a better relationship with KPD and other key stakeholders, as well as client tracking.
LEAD Kaua’i has established an initial goal of recruiting 15 clients to start due to the high
g
https://www.khon2.com/local-news/kauai-launches-lead-program-to-help-people-at-risk/
!

LEAD Honolulu 2-Year Evaluation
! ! !
11!
intensity of case management services and the time involved serving clients. LEAD Kaua’i staff
are continuing to maintain their focus on getting LEAD Kaua’i up and running.
Maui
LEAD on the island of Maui (LEAD Maui) launched on May 1, 2019. LEAD Maui operates
through key partnerships with other agencies and programs, which include: Maui Police
Department (MPD), Mental Health Kokua (MHK), Ka Hale A Ke Ola Homeless Shelter
(KHAKO), and Aloha House (substance use treatment). LEAD Maui enrolls clients by
coordinating outreach twice a week with the Maui Police Department. This process involves an
early morning ride-along with sergeants, other police officers and MHK’s Homeless Outreach
Worker to engage in warm handoff referrals. The LEAD Maui MHK Outreach Worker with their
police partner listens to the police radio for individuals who may fit their client descriptions
(often houseless individuals engaging in interactions with police officers) so that they are able to
respond instead during their police ride-along. The intended response for these individuals
involves locating the individual and building rapport during their initial encounter with the
police. The LEAD Maui MHK Outreach Worker begins the process of determining if the
individual may be an eligible candidate for the program and then begins the case manager and
service provider processes if the individual fits the client criteria. The main goal of these
outreach social referrals with the Maui Police Department is to make initial contact with the
potential client for services such as entrance into a shelter or other services instead of arrest. This
process is a coordinated response in which everyone involved with LEAD Maui comes together
to reach out and do what it takes to get individuals into the program.
Utilizing these outreach efforts with weekly Maui Police Department ride-alongs minimizes the
amount of time it would take to do a partnering agency or social contact warm handoff, allowing
the Outreach Worker to meet the individual during their police encounter rather than trying to
follow-up with them at a later time. During this encounter, the Outreach Worker is able to get to
know the individual and build trust, which is a difficult process with marginalized populations.
The Outreach Worker is able to screen the individual, determine their needs, and begin the case
management process through providing and referring services, as well as intensive case
management going forward.
The goals of LEAD Maui and these outreach efforts with the Maui Police Department are to
enroll individuals into the program and get them into LEAD Maui beds when the client needs
immediate housing through KHAKO and MHK or referral to Aloha House. Because these
encounters are initially when the individual has encounters with the police, timing is often
limited and dependent upon a number of factors so the client may not fill out their initial LINA
for a few days after the encounter. LEAD Maui staff will then follow-up with the client to
complete their LINA, as well as the intake into the LEAD Maui program involving their own
initial screening form, a Maui Mental Health Kokua form. This form is completed with the client
a week after the Outreach Worker gets to know the client to allow for rapport and trust to be
built, which allows for more and improved client engagement to determine the best services to fit
their needs.

LEAD Honolulu 2-Year Evaluation
! ! !
12!
Along with the ride-alongs, there are Maui judges referring potential clients into LEAD Maui
through a court mandate; however, the majority of clients are enrolled through outreach efforts.
These court mandates may replace probation as a punishment if the client is able to successfully
engage with the LEAD Maui program and utilize case management. This may involve LEAD
Maui Outreach Worker and MPD navigating the court process with the client, providing them
with services, and reporting their successes or challenges with completing services to their
probation officer, which may negatively affect their completion of the program and possibly
enhanced criminal justice reaction.
LEAD Maui estimates that they have made successful contact with more than 800 individuals
through program efforts since May of 2019. These contacts may just include providing
information about services or programs, providing masks, and other lower level service
providing. The majority of clients were trying to find services for improved living conditions and
transitional housing. LEAD Maui places an emphasis on client mental health, and harm
reduction, which may be supported through finding housing, taking the client out of their current
situations, and supporting them through different avenues and services to ensure they are set up
for success. Every individual has different needs and goals such as psychiatry, transportation to
probation appointments, bus passes, housing, and the need for mental health professionals. Once
the client’s LINA assessment is completed, LEAD Maui staff has a better idea of the needs and
goals the client has and wants to focus on going forward.
LEAD Maui places a focus on getting their clients stabilized and set-up for a better life. Other
areas of focus include getting the client document-ready, family reunification, and any substance
treatment that may benefit the client. LEAD Maui staff places an emphasis on face-to-face
check-ins with clients. The amount of time clients are enrolled in LEAD varies depending upon
their needs. LEAD Maui MHK and KHAKO staff members conduct an initial assessment with
the client, a follow-up sometime in the middle of their care, and a follow-up before they are
discharged. Some clients are followed for a few months and some may need as long as a year
with the program. The client is able to make the choice on how long they are enrolled in the
program since LEAD Maui is a volunteer program, unless mandated by a judge.
Sample Maui Police Department LEAD Program Activities Report for the
months of November 1, 2019 to March 31, 2020:
Our CORE Sergeant, in addition to daily contacts with the Outreach Worker and
LEAD participants, made 372 field contacts through outreach and documented 87
cases with 127 charges related to response to calls for service and officer requests.
…Client A- Housed Private after LEAD program and LEAD/CORE
will follow due to court. No police involvements during & following
the LEAD program.
…Client B- Housed in Permanente Supportive Housing (Mental Health
Program) and will be followed by LEAD/CORE due to court. No police
involvements during & following the LEAD program.

LEAD Honolulu 2-Year Evaluation
! ! !
13!
…Client C- Housed in Permanente Supportive Housing. No police
involvements during & following the LEAD program.
Due to the COVID-19 pandemic, traditional client interactions and recruitment efforts had to be
adjusted. LEAD Maui staff still met clients face-to-face when appropriate and necessary.
However, staff were not transporting clients to court and other criminal justice meetings or
hearings. All LEAD Maui staff were required to wear masks when interacting with clients for
their as well as the clients’ safety and health. LEAD Maui ceased accepting new clients on June
6
th
, 2020. LEAD Maui consistently conducted weekly meetings with Maui Police Dept., Mental
Health Kokua, Ka Hale A Ke Ola Homeless and Aloha House. Meetings involved checking-in
on clients and their status, housing status, number of clients in LEAD Maui beds, and other
probation or drug court officers’ check-ins and information sharing when necessary for specific
clients.
LEAD Maui has found that the program finds success through partnerships with Maui Police
Dept., Mental Health Kokua, Ka Hale A Ke Ola Homeless and Aloha House and other programs
and organizations, as well as a supportive relationship with the chief of the Maui Police
Department. There are agencies, organizations, and individuals on Maui who share the vision of
LEAD Maui of providing services for clients and improving their living conditions, which
creates an environment for partnership and program success.
Island of Hawai’i
LEAD on the Island of Hawaiʻi (LEAD IOH) began looking for clients in January of 2020. As of
April, 23, 2020, LEAD IOH has commenced providing case management services to 5 clients.
For the majority of these clients, case managers are focusing on clients receiving temporary
shelter; however, since the program is young, clients have yet to receive a full range of
programs. LEAD IOH staff do not have a set structure as far as data collection and assessment
tools yet, but staff are filling out the screening and a long intake and needs assessment (LINA)
form for each client. LEAD IOH staff are using these assessments as instruments and making
them their own based on the unique needs of LEAD IOH; however, since there are also partner
organizations completing these assessment tools, it is unknown if all partner organizations are
completing the screening and LINA forms. The data collected so far is spread out between the
different LEAD IOH partners currently working to find and serve clients.
LEAD IOH is currently utilizing a collaborative approach for finding clients. This is achieved
through a community partnership and network, including Going Home
h
, Bridge House
i
, and
HOPE services
j
. These organizations work collaboratively with LEAD IOH, which includes
these providers alternating partnering with the local Hawaiʻi Police Department officers on
Thursdays at 4 a.m. (i.e., meeting with Hawaiʻi Police Department officers to determine who will
h
https://www.goinghomehawaii.org
i
http://www.bridgehousehawaii.org
j
https://hopeserviceshawaii.org

LEAD Honolulu 2-Year Evaluation
! ! !
14!
accompany them) in Kona to join forces to locate potential LEAD IOH clients through social
contact referrals
k
. Partner organizations coordinate with LEAD IOH to schedule Hawaiʻi Police
Department accompaniment for the month.
In doing so, case managers accompany Hawaiʻi Police Department officers to hotspots where
LEAD IOH-type citations and law breaking is often found, and Hawaiʻi Police Department will
hand off any potential LEAD IOH clients that have just been cited to start the process of LEAD
IOH engaging with the potential clients, beginning the screening process, and conducting
assessments. Hawaiʻi Police Department assigns a case number to these individuals, which is
later presented to Prosecuting Attorney’s office. However, there is not a set criteria yet for if and
how Hawaiʻi Police Department will make decisions to reissue citations. To date, no citations
have been reissued to any LEAD IOH clients. LEAD IOH service providers have communicated
that the Chief of the Hawaiʻi Police Department is willing to utilize LEAD IOH in order to
reduce citations and arrests, but Hawaiʻi Police Department officers expressed feeling that
LEAD IOH is yet another task for them to complete and a burden. Therefore, it may take
additional time to obtain buy-in from the officers of the Hawaiʻi Police Department.
Buy-in from the officers of the Hawaiʻi Police Department is paramount because the foundation
of the LEAD IOH program workflow involves Hawaiʻi Police Department officers making initial
contact with potential LEAD IOH clients that they encounter who might fit the program
requirements and then handoff the potential clients to LEAD IOH CMs to screen and later
follow-up with and begin providing case management and services. CMs use a weekly tracking
report that includes the deliverables rendered (e.g., screening form, assessments, etc.). These
tracking reports currently serve as a data collection and client tracking tool; they are not a direct
reflection of Honolulu LEAD evaluation and data collection.
LEAD IOH partners conduct monthly team meetings on the first Tuesday of each month. Topics
regarding clients, placement of clients, and their cases are discussed amongst these partner
organizations This allows the Prosecuting Attorney’s office to stay updated with each client and
their progress through the programs. Key stakeholders are provided the opportunity at this time
to check-in on the program and ask questions. Although the LEAD IOH team has set no specific
target number of clients, decisions surrounding this will occur as the program progresses.
It should be noted that COVID-19 has exacerbated start-up challenges for LEAD IOH
community partners and stakeholders. Other program challenges include lack of communication;
information was not disseminated to the individuals who were providing the service (e.g.,
Hawaiʻi Police Department and other service providers). This lack of communication issue was
not on the part of LEAD IOH; it was an internal issue for Hawaiʻi Police Department and other
service providers. LEAD IOH staff was forced to cease operations because the Hawaiʻi Police
Department was focusing primarily on the safety of community and the Prosecuting Attorney’s
office was working remotely due to courts being closed.
k
Social contact referrals are made for individuals who are perceived as high risk of arrest for low-level,
non-violent criminal offenses in the future, but do not necessarily involve a police citation.
!

LEAD Honolulu 2-Year Evaluation
! ! !
15!
LEAD on the Neighbor Islands Summary
• LEAD Kaua’i, LEAD Maui, and LEAD IOH all completed a pilot year for each of their
respective programs.
• All three programs were successful in establishing partnerships with other programs,
services, and departments to provide case management to clients and perspective clients.
• Each program was unable to establish a timeline to truly capture client changes-over-
time; however, each island was able to create and establish police buy-in that is crucial
for the LEAD model.
• There is a need to focus on the sustainability of the LEAD program on the neighbor
islands.

LEAD Honolulu 2-Year Evaluation
! ! !
16!
IV. LEAD Honolulu Program Implementation

LEAD Honolulu 2-Year Evaluation
! ! !
17!
The evaluation team monitored LEAD HNL program implementation as well as client and
community-level outcomes for the first two years of the program. This section focuses on
program implementation, the triage, referral, and enrollment processes as well as service
provision. Data sources included archival data, field notes from case management and other
LEAD-related meetings, staff and client interviews, and client surveys.
Out of 101 individuals encountered and assessed through LEAD HNL, 44 were triaged out to
other service providers and 57 were referred into LEAD HNL as clients.
“Triaged Only” refers to individuals who were referred to LEAD but for various reasons were
not enrolled into the LEAD program but still screened for potential enrollment. LEAD program
screening provided the opportunity to be placed into the program (referred) or directed to
services but no case management (triaged only).
Triaged Only
In some cases, LEAD HNL staff and/or community partners encounter individuals that they
“triage” or refer out to other service providers. If the LEAD HNL program does not have
capacity, or the individual does not meet the requirements for either diversion or social contact
referral, community “triaged only” may be appropriate for the individual within the guidelines
set by the LEAD HNL triage protocol. The requirements for either diversion or social contract
referral requires verification by law enforcement, judiciary, or a community provider that the
individual’s “chaotic substance use” has resulted in a history of negative interactions with the
legal system as well as proof of such verification (e.g., police reports, direct observation by law
enforcement, information provided to law enforcement by credible source). Highlighting triage
clients provides a comparison group to enrolled LEAD clients to better assess outcomes.
Triaged Only Protocol
If a potential LEAD HNL client is screened and found to be ineligible for diversion or social
contact referral into LEAD HNL case management services, and LEAD HNL has capacity to
provide basic triage services to an individual, LEAD HNL staff may provide services to address
urgent subsistence matters. Basic triage services include, but are not limited, to:
• transportation to shelter;
• application to SNAP/financial assistance;
101 program screened and assessed
57 referred 44 triaged only

LEAD Honolulu 2-Year Evaluation
! ! !
18!
• referral to healthcare, application to health insurance;
• connection to wound care, or wound care clinic; and
• reconnection to established social service provider.
LEAD HNL staff provide LEAD HNL triage services at the initial contact, and LEAD HNL
triage services are limited to 30 days to maintain program fidelity. If the triaged individuals’
needs extend beyond this timeframe, an exception to eligibility criteria may be considered. If an
exception to the eligibility criteria is granted, the client will be enrolled into LEAD HNL via
social contact referral on the date they were initially referred.
Triage Referral Process
Any law enforcement, judiciary, or community provider may make a triage referral through the
LEAD Triage Referral Process. To make a triage referral, the law enforcement, judiciary, or
community provider will email the LEAD HNL Program Manager the following information on
the individual in need of services:
• requested triage service;
• client’s last known location; and
• client’s contact information (if applicable).
If the requested triage service cannot be addressed within 30 days, the law enforcement,
judiciary, or community provider requesting services will be referred to the social contact
referral process.
Triaged Only: Demographics
The following section presents client demographics for the 44 individuals that were only triaged
at the time of their encounter with LEAD HNL and not referred to the program due to capacity
limits or the individual does not meet the program requirements for either diversion or social
contact referral:
• The largest percentage of triaged individuals were between 50 and 59 years of age (41%;
n=18) (See Fig. 1) and were men (43%; n=24) (See Fig. 2). About half of triaged
individuals identified as multiracial (49%; n=21), and about half identified as Native
Hawaiian/Pacific Islander (NHPI) (47%; n=20) (See Fig. 3).
• The most common self-reported drugs used over the past 6 months were
methamphetamine (49%; n=21), marijuana/hashish (40%; n=17), and alcohol (38%;
n=16) (See Fig. 12).
• The vast majority of triaged individuals (98%; n=43) were currently experiencing
homelessness (See Fig. 14).

LEAD Honolulu 2-Year Evaluation
! ! !
19!
• The largest percentage of triaged individuals were in their fifties (41%), and triaged
individual age ranged from 18 to 68, with an average age of 43 years (See Fig. 1).
• The majority of triaged individuals were male (55%), with the minority of triaged
individuals being transgender (2%) and female (43%; See Fig. 2).!!
• Triaged individuals were able to select more than one ethnicity. About half of triaged
individuals identified as multiracial (49%) and about half identified as NHPI (47%), with
just over half identifying as Caucasian/White (53%) (See Fig. 3).
2%
2%
2%
5%
5%
5%
5%
5%
16%
16%
47%
49%
53%
Micronesian (n=1)
Puerto Rican (n=1)
Japanese (n=1)
Korean (n=2)
Portuguese (n=2)
Hispanic (n=2)
African American (n=2)
Samoan (n=2)
Chinese (n=7)
Filipino (n=7)
Hawaiian/Pacific Islander (n=20)
Multiracial (n=21)
Caucasian/White (n=23)
Fig. 3 Triage Ethnicity
7%
27%
11%
41%
14%
Fig. 1 Triage Age (N = 44)
18-29 years (n=3) 30-39 years (n=12)
40-49 years (n=5) 50-59 years (n=18)
60-69 years (n=6)
43%
55%
2%
Fig. 2 Triage Gender (N = 44)
Female (n=19)
Male (n=24)
Transgender (n=1)

LEAD Honolulu 2-Year Evaluation
! ! !
20!
Referrals
LEAD HNL clients were identified through referrals from community partners. These referrals
included both diversion referrals and social contact referrals. Individuals who have committed
low-level, non-violent offenses were eligible through diversion referrals from different criminal
justice agencies. Individuals who were perceived to be high risk for arrest were eligible for
LEAD HNL through social contact referrals from different community partners and not a result
law enforcement diversion. The following clients are LEAD HNL clients and do not reflect those
triaged only clients who only received triage services but were not admitted into LEAD HNL.
Mode of Referral
Diversion referrals. Provided there is an active diversion arm within LEAD HNL, diversion
requests take precedent over social contact referral. In place of an arrest or citation, LEAD HNL-
trained law enforcement officers refer individuals directly and immediately to LEAD HNL staff.
Eligible offenses include, but are not limited to trespassing, littering, park closure violations,
sit/lie offenses, and open container violations. Individuals who have committed violent offenses
within the last 10 years (e.g., drug traffickers, promoters of prostitution, sex offenders, and those
exploiting minors) are ineligible for LEAD HNL. As of the date of this report, diversion referrals
have not begun due to LEAD HNL still being in the process of facilitating a partnership with
HPD and the Prosecutor’s Office. Therefore, all referrals described in this report came through
social contact, as described below.
Social contact referrals. LEAD HNL will also accept social contact referrals from law
enforcement, that is, individuals perceived by officers as at high risk of arrest in the future for
low level drug activity. Since diversion has not yet begun, the primary avenue for social contact
referrals in the LEAD HNL program has been in collaboration with HPD’s Health Efficiency
Long-term Partnership (H.E.L.P.) initiative and the Sheriff’s Division of the Hawaiʻi Department
of Public Safety in collaboration with the Office of the Governor's Coordinator on
Homelessness. H.E.L.P. is a collaboration of police officers, social service workers, and
advocates who jointly conduct outreach aimed at providing connections for individuals to shelter
and/or detox services.
Social contact criteria. All social contact referrals to LEAD HNL must meet the following pre-
requisites:
• Verification by law enforcement, judiciary, or community provider that the individual’s
“chaotic substance use” has resulted in a history of negative interactions with the legal
system.
o Chaotic substance use:
§ any diagnosed history of Substance Use Disorder (SUD) from the DSM-V
criteria; or
§ any use of narcotic, stimulant, alcohol, or other illicit substance in a public
area resulting in a public safety concern.

LEAD Honolulu 2-Year Evaluation
! ! !
21!
• Verification by law enforcement, judiciary, or community provider of chaotic substance
use:
o police reports, arrests, jail bookings, criminal charges, or convictions indicating
that the individual was engaged in chaotic substance use; or
o law enforcement has directly observed the individual's chaotic substance use; or
o law enforcement has a reliable basis of information to believe that the individual
is struggling with chaotic substance use, such as information provided by another
first responder, a professional, or credible community members.
Other social contact referral methods
include direct recommendations
from officers or Sheriff deputies. In
addition to accompanying HPD on
H.E.L.P Honolulu operations, LEAD
staff regularly accompany the
Sheriff’s Capitol Patrol unit on
patrols in the Iwilei area and to
Community Outreach Court (See
Fig. 4).
Since July 1, 2018, 57 individuals have been referred to LEAD HNL through “social contact
referral.”
• Of these 57 referrals, the majority (54%) were through the H.E.L.P program.
• Over a third (35%) were referred from the Sheriff’s Division.!
54%
35%
5%
2%
4%
Fig. 4 Mode of Referrals for LEAD HNL
Participants (N=57)
HELP HNL (n=31)
Sheriff's Division (n=20)
Community Outreach
Court (n=3)
Point-in-Time (n=1)
HHHRC Walk-in (n=2)

LEAD Honolulu 2-Year Evaluation
! ! !
22!
Fig. 5 Referral Locations
The majority of referrals were from
the 96817 zip code area (68%,
n=39), which includes Iwilei (n=14),
Chinatown (n=11), Aʻala Park (n=8),
River Street (n=5), and Pauahi Street
(n=1) (See Fig. 5).
Of the eleven people who were
referred from zip code 96813, five
were referred from Kakaʻako Park,
three were referred from Community
Outreach Court, two were referred
from Iolani Palace, and one was
referred from HHHRC walk-in (See
Fig. 5).
Of the four people referred from 96814, two were referred from Thomas Square Park, one was
referred from Ala Moana, and one was referred from Makiki. Another 2 people were referred
from Kapiʻolani Park (96815) (See Fig. 5).
Furthermore, the area assocaited with the 96817 zip code provided the most LEAD referrals and
according to the 2020 Oahu Point in Time Count is the location with the largest number of
unsheltered individuals. Indicating LEAD HNL is serving the hardest hit area of homelessness.
l
Intake Procedures
Once the referred individual has accepted the referral, LEAD HNL staff arrive on-site to conduct
an initial intake and to schedule a follow-up appointment to complete a full needs assessment
and begin to link the client with services. These clients are not diversion referrals and enrollment
in to LEAD does not influence any law enforcement charges or offenses.
Enrollments
Out of 57 individuals referred to LEAD HNL, 50 are enrolled in LEAD HNL.
l
The reasons for 7
out of 57 individuals referred to LEAD HNL not being enrolled vary, with the most common
reason being that the individual did not follow up with LEAD HNL staff to complete a long
intake and needs assessment (LINA). Clients who have completed a LINA with a LEAD HNL
case manager are considered enrolled in the program. LEAD HNL case managers provided
intensive follow-ups, calls, client scheduling and meetings, and other intensive avenues to aid in
l
Social contact referrals are made for individuals who are perceived as high risk of arrest for low-level,
non-violent criminal offenses in the future, but do not necessarily involve a police citation.
l
!Due to 1 LEAD client passing away, counts may reflect 49 clients versus 50 to show comparison. !

LEAD Honolulu 2-Year Evaluation
! ! !
23!
turning referrals into enrolled clients. Currently, completing the LINA is the only requirement
for participation in the LEAD HNL program.
Enrolled Client Demographics & Background
The following section presents client demographics for clients at the time of enrollment into
LEAD HNL:
• At the time of enrollment, the largest
percentage of the 50 enrolled clients
were between 50 and 59 years of age
(36%; n=18) (See Fig. 6). The
majority of clients are women (48%;
n=24) (See Fig. 7) and have
graduated high school or obtained
their GED (36%; n=18) (See Fig. 8).
Just over a quarter of clients have
completed 9
th
to 11
th
grade (28%;
n=14) or some college (28%; n=14)
(See Fig. 8). However, only a few
clients graduated from college (4%;
n=2) (See Fig. 8). Half of the
enrolled clients have never been
married (50%; n=25) and nearly a
quarter are divorced (22%; n=11)
(See Fig. 9).
• The largest percentage of triaged
individuals were between 50 and 59
years of age (41%; n=18) (See Fig.
1) and were men (43%; n=24) (See
Fig. 2). About half of triaged
individuals identified as multiracial
(49%; n=21), and about half
identified as Native Hawaiian/Pacific
Islander (NHPI) (47%; n=20) (See
Fig. 3).
• The majority of enrolled clients
identified as multiracial (54%;
n=27), and half identified as Native
Hawaiian/Pacific Islander (NHPI)
(50%; n=25) (See Fig. 10).
• At the time of enrollment, 78%
reported using methamphetamine,
36% reported using alcohol, and
36% reported using opioids and/or
heroin within the six months prior
(See Fig. 11).
• The vast majority of enrolled clients
reported currently experiencing
homelessness (76%; n=38), and
nearly a quarter had experienced
homelessness within the past three
years but were not currently
experiencing homelessness (22%;
n=11) (See Fig. 13).
57 referred
7 referred but not enrolled 50 referred and enrolled

LEAD Honolulu 2-Year Evaluation
! ! !
24!
• The majority of enrolled clients were aged fifty or older (60%) and client age ranged
from 21 to 71, with the average age of 49.1 years (See Fig. 6).
• The largest percentage of enrolled clients were female (48%), and 6 clients identified as
either transgender or gender fluid (12%) (See Fig. 7). !
• The majority of clients finished high
school or obtained their GED (36%), with
an equal amount reporting having
completed 9
th
to 11
th
grade only (28%) or
some college (28%). Only 2 clients
graduated from college (4%) (See Fig. 8).
!
2%
22%
4%
18%
50%
4%
Married (n=1)
Divorced (n=11)
Widowed (n=2)
Separated (n=9)
Never Married/Single (n=25)
Unmarried Couple (n=2)
Fig. 9 Enrolled Client Family Status (N=50)
10%
16%
14%
36%
22%
2%
Fig. 6 Enrolled Client Age (N =50)
18-29 years (n=5) 30-39 years (n=8)
40-49 years (n=7) 50-59 years (n=18)
60-69 years (n=11) 70-79 years (n=1)
48%
40%
12%
Fig. 7 Enrolled Client Gender (N =50)
Female (n=24)
Male (n=20)
Transgender or Gender Fluid (n=6)
28%
36%
28%
4%
2%
Fig. 8 Enrolled Client Highest Level
of Education (N =50)
8th grade or less (n=1)
9th - 11th Grade (n=14)
Graduated or GED (n=18)
Some College (n=14)

LEAD Honolulu 2-Year Evaluation
! ! !
25!
• At the time of enrollment, half (50%) of enrolled clients had never been married. Eleven
clients (22%) are divorced, and 9 clients (18%) are separated from a partner (See Fig. 9).
• Enrolled clients were able to select more than one ethnicity. The majority of enrolled
clients identified as multiracial (54%), and half (50%) identified as NHPI (See Fig. 10).
Compared to the overall population on Oʻahu, NHPIs and
multiracial individuals are overrepresented in referred and
enrolled LEAD HNL clients. NHPI and multiracial
individuals made up 9.6% and 22.8% of Honolulu County’s
population and 10.1% and 24.2% of Hawaiʻi’s population
in 2019, respectively,
6
compared to 50% and 54% of LEAD
HNL referrals. However, the program’s referred and
enrolled client racial breakdown reflects recent data
showing that NHPIs and multiracial individuals are
disproportionately represented in the homelessness population on Oʻahu, comprising 31% and
25% of the homeless population.
7
Additionally, data shows that Native Hawaiians are over-represented in the prison population,
both as seen in the LEAD Year 1 report and other reports.
4,5
Thus, the enrolled clients’ racial
composition roughly reflects those most likely to experience homelessness and/or incarceration
on Oʻahu, as seen in both years of LEAD HNL program implementation.
2%
4%
2%
6%
6%
10%
10%
12%
14%
14%
14%
42%
50%
54%
Micronesian (n=1)
Samoan (n=2)
Korean (n=1)
Portuguese (n=3)
American Indian (n=3)
Puerto Rican (n=5)
Hispanic (n=5)
Japanese (n=6)
African American (n=7)
Chinese (n=7)
Filipino (n=7)
Caucasian/White (n=21)
Hawaiian/Pacific Islander (n=25)
Multiracial (n=27)
Fig. 10 Enrolled Client Ethnicity
According to the 2020
Point-in-Time Count,
NHPIs comprised the
largest percentage of the
homeless population (31%),
followed by multiracial
(25%).
7

LEAD Honolulu 2-Year Evaluation
! ! !
26!
• The vast majority of enrolled clients self-reported using methamphetamine (78%) over
the past 6 months (See Fig. 11).
• Enrolled clients self-reported that the drugs most commonly utilized over the past 6
months (other than methamphetamine) were alcohol (36%), opiods/heroin (36%), and
marijuana (30%) (See Fig. 11).
• Triaged only individuals self-reported that the drugs most commonly utilized over the
past 6 months were methamphetamine (49%), marijuana/hashish (40%), and alcohol
(38%) (See Fig. 12).
• Triaged individuals self-reported that the drugs least commonly utilized over the past 6
months were cocaine (7%), benzodiazepines (5%), and opiods/heroin (5%).
• LEAD clients (78%) reported more methamphetamine use than triaged only clients
(49%) during the 6 months prior to their first assessment.
36%
10%
36%
10%
30%
78%
4%
Fig. 11 Enrolled Client Drug Use in
the Past 6 Months (N =50)
Alcohol (n=18) Benzodiazepines (n=5)
Opiods/heroin (n=18) Cocaine (n=5)
Marijuana (n=15) Methamphetamine (n=39)
Other (n=2)
38%
5%
5%
7%
40%
49%
Fig. 12 Triage Drug Use
in the Past 6 Months (N =44)
Alcohol (n=16) Benzodiazapines (n=2)
Opioids/Heroin (n=2) Cocaine (n=3)
Marijuana/Hashish (n=17) Methamphetamine (n=21)

LEAD Honolulu 2-Year Evaluation
! ! !
27!
!
• At the time of enrollment, the majority of clients were currently experiencing
homelessness (76%) (See Fig. 13).
• Less than a quarter of clients had experienced homelessness within the past three years
(22%); however, were not homeless at the time of enrollment (See Fig. 13).
• At the time of triage, the vast majority of triaged only individuals (98%) were currently
experiencing homelessness, with only a small minority being housed (2%) (See Fig. 14).
Triage clients (98%) were more likely to be currently homeless than LEAD clients (76%) during
first assessment.
m
Due to 1 LEAD client passing away, counts may reflect 49 clients versus 50 to show comparison. !
22%
76%
2%
Fig. 13 Enrolled Client Experienced
Homelessness in the Past 3 Years
(N =50)
Yes (but not currently homeless) (n=11)
Yes (currently homeless) (n=38)
Missing (n=1)
98%
2%
Fig. 14 Triage Currently
Experiencing Homelessness (N =44)
Yes (n=43) No (n=1)
At the time of this report, 18 out of the 49 LEAD HNL clients (37%) were currently
housed through different agencies, as well as through a collaboration with Partners
in Care (PIC) Oahu’s Continuum of Care Coordinated Entry System (CES).
m
Four
were housed through the Institute for Human Services, 4 through Catholic Charities
Hawaii, 2 through Honolulu Community Action Project, and 1 each through
HHHRC, Section 8, Kalihi Palama Health Center, Villages of Maili: Bridge Housing
provided by CCH, Gregory House, and self-housed.

LEAD Honolulu 2-Year Evaluation
! ! !
28!
Service Engagement
After enrollment and completing the Long Intake and Needs Assessment (LINA), LEAD HNL
case managers provide intensive case management services to help connect clients to other
services. About 78% (n=39) of the 50 enrolled clients are actively engaging in LEAD case
management services. Of the 50 enrolled clients, 10 individuals are not actively working with
their case managers for reasons ranging from the client has received the services they require
from the program and do not need hands-on assistance at the moment, as well as the case
manager has not been able to locate the client for an extended period of time, but are still
considered LEAD clients, and 1 individual is deceased.
Services Needed & Used
The following section presents triaged only individuals and
LEAD HNL clients’ self-reported services interested in
receiving/needed and services currently receiving/used.
Triaged individuals self-reported the types of services they
would like to utilize (See Fig. 15) as well as the types of
services utilized within the past 30 days (See Fig. 16).
LEAD HNL clients’ self-reported the types of services they
would like to utilize (See Fig. 17) as well as services
utilized within the past 30 days (See Fig. 18) at the time of
referral, baseline, and at subsequent follow-up time periods.
57 referred
7 referred, but not
enrolled
50 referred and enrolled
10 enrolled, but not
engaged
39 enrolled and engaged
("active")
1 deceased
50'Clients'with'
LINAs'(Baseline)
42'Clients'with''
FLINAs'(Last'
Assessment)
Operational Work Group:
LEAD HNL utilizes weekly
meetings to discuss and
coordinate care with community
partners, such as representatives
from HPD, the Office of the
Governor's Coordinator on
Homelessness, and the funding
agency ADAD.

LEAD Honolulu 2-Year Evaluation
! ! !
29!
Fig. 15 Triage & Referred Individuals Services Interested
in Receiving
• Triaged individuals were less interested in receiving
services than referred individuals except for emergency
shelter/temporary housing – triaged individuals were more
interested (64%) than referred individuals (40%).
• The majority of triaged individuals were interested in
receiving permanent housing (66%), food/clothing (64%),
and emergency shelter/temporary housing (64%).!
!
• The majority of referred individuals were also interested in
receiving permanent housing (82%) and food/clothing
(73%). In addition, the majority indicated needing case
management (89%), ID assistance (73%). Transportation
assistance (62%), mental health services (60%), disability
services (including SSI & SSDI) (56%), and legal services
(55%).!
Fig. 16 Triage & Referred Individuals Services Currently
Receiving
• The majority of triaged and referred individuals were not
currently receiving services.
• The services most utilized by triaged individuals were
food/clothing (30%) and medical services (27%).
• The services most utilized by referred individuals were
medical services (47%) and disability services (including
SSI & SSDI) (20%).
• Generally speaking, both triaged and referred individuals
reported minimal or no use of services, suggesting this
population is in grave need of support.!
LEAD Honolulu 2-Year Evaluation
! ! !
30!
Fig. 17 Percent of Enrolled LEAD Clients Indicating Services Needed over Time in the Program
• At baseline, the majority of clients indicated needing 9 of the 15 services listed, with the vast majority indicating needing case
management services (95%) and permanent housing (92%).
• At baseline, about three quarters of clients indicated needing transportation assistance (78%) and mental health services (73%).!
• At baseline, over half of clients indicated needing ID assistance (68%), medical services (68%), clothes closet (65%), disability
services (including SSI & SSDI) (62%), and soup kitchen or food pantry (62%).
• The need for ID assistance dropped dramatically from 68% at baseline to 20% at 15-month follow-up.
• The need for clothes closet dropped dramatically from 65% at baseline to 25% at 15-month follow-up.
• At baseline and at all follow-up assessments, permanent housing continues to be a persistent need of the majority of clients.
LEAD Honolulu 2-Year Evaluation
! ! !
31!
Fig. 18 Percent of Clients Indicating Using Services over Time in the Program
• At baseline, the majority of clients indicated using only two services – soup kitchen or food pantry (70%) and medical services
(51%). This is in stark contrast to findings that the majority of clients indicating needing nine services at baseline.
• Use of transportation assistance increased substantially from 35% at baseline to 67% at 24-month follow-up.
• Use of case management increased from 35% at baseline to 100% at 15-month follow-up as well as use of mental health
services, which increased from 27% at baseline to 50% at 15-month follow-up, which suggests that clients are receiving
services that were indicated by the majority of clients as services they needed at baseline.
• Use of permanent housing increased from 8% at baseline to 50% at 15-month follow-up, suggesting that LEAD is helping
clients obtain permanent housing, while also indicating the need for permanent housing remains a persistent need for clients.
• At baseline and all follow-up assessments, soup kitchen or food pantry and medical services continues to be utilized by the
majority of clients, suggesting that clients still need to utilize services for meeting basic needs, such as food and medical care
after being enrolled into the program.

LEAD Honolulu 2-Year Evaluation
! ! !
32!
HHHRC Clinic Collaboration and LEAD Clients
• HHHRC provides clinical services to LEAD clients and other program-based clients and
communities. Clinical services include rapid testing for Hepatitis C Virus (HCV), HIV
testing, wound care, and Buprenorphine for opioid treatment, housing voucher programs,
and other clinical services. Some services are handled and distributed within the HHHRC
clinic and others are connected and referred to outside services.
• At the time of this report, 18 clients are currently housed through a HHHRC collaboration
with Partners in Care (PIC) Oahu’s Continuum of Care Coordinated Entry System (CES)
partnerships (36%), 7 clients have received HCV tests (14%), and 4 clients have been
provided buprenorphine for opioid treatment (8%) (See Fig.19). Out of the 7 clients who
have received HCV tests, 3 clients had multiple HCV tests.
36%
16%
14%
12%
8%
Clients housed through HHHRC partner
agencies (n=18)
Clients provided HCV navigation (n=8)
Clients provided HCV tests (n=7)
Clients provided HCV treatment (n=6)
Clients provided Buprenorphine medication-
assisted treatment (MAT) (n=4)
Fig. 19 HHHRC Clinic Collaboration and Services Provided to Clients
(N=50)
LEAD Honolulu 2-Year Evaluation
! ! !
33!
V. LEAD Honolulu Outcomes & Impacts

LEAD Honolulu 2-Year Evaluation
! ! !
34!
In addition to examining program process, the evaluation team assessed program outcomes and
impacts based on goals identified in the LEAD Theory of Change (See Fig. 20). This section of the
report assesses program progress toward short-term and long-term goals for Years 1 and 2 (since
the start of the program) adhering to the harm reduction approach utilized by the LEAD program.
Fig. 20 LEAD Theory of Change
What is a “harm reduction approach?” The harm reduction approach seeks to reduce the adverse
consequences of drug use among persons who continue to use drugs. It developed in response to
the excesses of a “zero tolerance approach”. Harm reduction emphasizes practical rather than
idealized goals. It has been expanded from illicit drugs to legal drugs and is grounded in the
evolving public health and advocacy movements.
[Single, E. (1995). Defining harm reduction. Drug and Alcohol Review, 14(3), 287-290.]

LEAD Honolulu 2-Year Evaluation
! ! !
35!
The following evaluation presents findings from Years 1 and 2 combined (i.e., clients’ first and last
assessment). It should be noted that findings presented in bold faced light blue indicate findings
for the first and last assessment of LEAD HNL clients from before the March 23, 2020
executive/emergency orders due to the COVID-19 pandemic to demonstrate any noticeable
differences in findings after the city-wide shutdown.
Short-Term Goals
Short-term goals include increased housing stability and decreased substance use and stress.
Housing Stability
The evaluation team assessed changes in housing by examining the number of days lived in
different locations for the last 30 days at baseline and follow-up. Of the 50 enrolled clients, 42
clients completed at least the baseline and a follow-up assessment. The time between baseline
and last assessment for these clients ranged 3-23 months, with an average of 13.5 months.
At baseline, the average number of days spent living on the street was 19.76 during the past 30
days. The average was 10.43 days during the past 30 days at the last assessment, showing a 47%
decrease since the start of the program.
!
# Days sleeping on
street/park/beach
47%
Additionally, the average number of days spent in an emergency shelter decreased from 3.12 to
1.55 days, while the average number of days in a transitional shelter increased from 1.37 to 2.00
days.
• Last assessment before the COVID-19 emergency orders indicated an average
increase by 188% from 1.37 days at first assessment to 3.94 days at last assessment for
the average number of days spent in a transitional shelter in the 30 days prior, which
is a larger increase than first (1.37) and last assessment (2.00) after COVID-19
indicating clients were using transitional shelters more before the COVID-19
pandemic.!
The percentage of clients who were housed for the
entire previous month increased from 13% at first
assessment to 48% at the last assessment.

LEAD Honolulu 2-Year Evaluation
! ! !
36!
# Days staying in emergency shelter
50%
# Days living in transitional housing
46%
These findings may reflect the change in the average number of days living in a shared or
independent apartment, which both increased from 1.47 and 1.63 days at first assessment to 3.21
and 10.29 days at last assessment, respectively. These changes may have contributed to the
reduction in emergency shelter use between assessments
# Days living in shared apartment
118%
# Days living in independent apartment
531%
The client average number of days in the past month sleeping on the streets was higher than other
sleeping locations at both first and last assessment; however, there was a 47% decrease from 19.76
days at first assessment to 10.43 days at last assessment.
• Last assessment before the COVID-19 emergency orders indicated an average
decrease by 61% for the average number of days spent sleeping on the streets from
19.76 days at first assessment to 7.69 days at last assessment.
The average number of days spent in independent apartment increased 531%, from 1.63 days at
first assessment to 10.29 days at last assessment.
These findings suggest that LEAD clients are spending less time on the streets
and more time in transitional housing or housed in an apartment since enrolling
in the program; however, there was a larger decrease in the number of days
sleeping on the streets and time in transitional housing before COVID-19.
The percentage of clients who lived in
an independent apartment for the
entire previous month increased from
4% at first assessment to 33% at the
last assessment.

LEAD Honolulu 2-Year Evaluation
! ! !
37!
What has changed in your life since starting LEAD?
“My court case recently got dropped and I’ll soon be off probation,
the (LEAD HNL) team helped me get there.”
– LEAD HNL Client
“I reunited with my family; I get to create memories with my
grandkids.”
– LEAD HNL Client
“I got sober and had a healthy baby girl. I also got married and
have my own place.”
– LEAD HNL Client
Substance Use
Using self-reported substance use data, evaluators assessed changes in LEAD HNL clients’
substance use and engagement in treatment services.
Figure 20 provides the average number of days clients used each substance in past month at first
and last assessment.
2.46
5.00
18.33
11.67
11.56
6.30
6.00
2.32
0.00
14.06
9.29
8.65
7.00
3.85
Cocaine Synthetic
marijuana/K2
Methamphetamine Opiods/heroin Marijuana/hasish Alcohol Benzodiazepines
Fig. 21 Average Number of Days Used Each Substance in Past Month at
First & Last Assessment Since the Start of the Program
First Assessment Last Assessment

LEAD Honolulu 2-Year Evaluation
! ! !
38!
Clients indicated using methamphetamines the most days a month compared to other substances at
both first and last assessment. However, the number of days using methamphetamines decreased
by 23% from 18.33 days at first assessment to 14.06 days at last assessment (See Fig. 21).
• On average, there has been a 23% decrease in methamphetamine use by clients since the
start of the program.
• Last assessment before the COVID-19 emergency orders indicated an average
decrease by 50% for the average number of days of opioids/heroin use 30 days prior
from 11.67 at first assessment to 5.82 at last assessment. (Since the start of the
program there was a 20% decrease when not adjusting for the COVID-19 date.)
The average number of days per month using opioids,
marijuana, and benzodiazepines decreased from 11.67,
11.56, and 6.00 days to 9.29, 8.65, and 3.85, respectively.
Alcohol use increased from 6.30 days a month to 7.00 days
per month (11%) (See Fig. 20 & Fig. 22).
• The percentage of clients who reported no
methamphetamine use in the previous month
decreased from 18% at first assessment to 16.7% at
the last assessment.
o Last assessment before the COVID-19 emergency orders indicated the
percentage of clients who reported no methamphetamine use in the previous
month increased from 18% at first assessment to 20% at last assessment.
!
• This suggests methamphetamine and opioids/heroin use increased after the COVID-
19 emergency orders.
-6%
-23%
-20%
-25%
11%
-36%
# Days used cocaine
# Days used methamphetamine past month
# Days used opiods/heroin past month
# Days used marijuana/hashish past month
# Days used alcohol past month
# Days used benzodiazepines past month
Fig. 22 Percent Change in Substance Use from First to Last Assessment
5 out of 42 of the enrolled LEAD
HNL clients who have a first and
last assessment engaged in some
type of substance use service, such
as substance use counseling in the
last 3 months of their last
assessment period, compared to 12
out of 37 enrolled LEAD HNL
clients from Year 1.
LEAD Honolulu 2-Year Evaluation
! ! !
39!
…LEAD HNL Client
“The successes I’ve had with LEAD was getting proper professional psychiatric
help, getting mediations that I, that work for me and my mental, my mental
condition. Also, [my case manager] got me into an alcohol rehab center that
specialized in dual diagnosis you know, with your mental diagnosis and also your addiction. And
I’ve had pretty good success afterwards.” [Biggest success so far] “overcoming my alcohol
addiction”
Stress
Clients showed overall improvement in perceived stress from their first assessment to their last.
Clients saw the most gains in the number of days they felt hopeful about the future, increasing
from an average of 10.34 days to 17.62 days a month, a 70% increase (See Fig. 23).
• Last assessment before the COVID-19 emergency orders indicated an increase of 83%
in the number of days clients felt hopeful about the future from 10.34 days at first
assessment to 18.91 days a month at last assessment.
There were increases in clients’ feelings that things were going their way (19%) and how often the
client felt confident about their ability to handle personal problems (18%) from first to last
assessment, both within the past 30 days (See Fig. 23). There were decreases in clients’ feelings
that they were unable to control the important things in their life (-12%) and how often the clients
felt difficulties could not be overcome (-9%) from first to last assessment, both within the past 30
days. All indicate an improvement between assessments (See Fig. 23).
Fig. 23 Change in Client Perceived Stress from First to Last Assessment in the Past Month
Range: 1= Never, 5= Very often
First
Assessment
Last
Assessment
Percent
Change
How often felt unable to control the important things in life.
3.76
3.31
-12%
How often felt difficulties could not be overcome.
3.56
3.24
-9%
How often felt that things were going their way.
2.46
2.93
19%
How often felt confident about the ability to handle personal problems.
3.04
3.60
18%
In the last 30 days:
Days felt hopeful about future.
10.34
17.62
70%

LEAD Honolulu 2-Year Evaluation
! ! !
40!
“[Case manager] is one in a million for me, (s)he helps me out so much…this
place [LEAD] is a godsend; I think this place is a godsend for people who really
need it.” – LEAD HNL Client
Long-Term Goals
The long-term goals of the LEAD program include decreased reliance on emergency and hospital
usages, decreased recidivism, and increased client quality of life.
Emergency & Hospital Use
Hospital admissions decreased from 10% of clients at first assessment to 7% at last assessment.
Additionally, emergency room visits decreased in the past month from 32% of clients to 14% at
last assessment (See Fig. 24).
• Last assessment before the COVID-19 emergency orders indicated a decrease in
hospital admissions from 10% of clients at first assessment to 5.7% at last assessment,
as well as emergency room visits in the past month with a decrease from 32% of
clients to 11.4% at last assessment.
Hospital admissions decreased from baseline to clients’ last assessment since the start of the
program; however, hospital admissions increased from 10% of clients at first assessment to 13% at
last assessment in the Year 1 report. The increase in Year 1 was expected because among people
who have otherwise ignored persistent medical issues prior to receiving services, hospital
admissions are likely to increase as clients engage more with health and services as a result of case
management. Year 1 reported that over time, it was believed that hospital admission rates will
likely decline, and findings from Year 2 support this prediction.
These findings suggest progress toward reducing strain on healthcare services.
Fig. 24 Change in Client Usage of Emergency Rooms & Hospitals in Past Month from First
to Last Assessment
First
Assessment
Last
Assessment
Percent
Change
% gone to the emergency room in the past month
32%
14%
-56%
% admitted to a hospital in the past month
10%
7%
-30%

LEAD Honolulu 2-Year Evaluation
! ! !
41!
Crime & Recidivism
The evaluation team examined recidivism for LEAD HNL clients using criminal citations recorded
in eCourt Kokua, which provides “access to public information from traffic cases, District Court
criminal, Circuit Court criminal, Family (Adult) Court criminal and appellate cases.”
8
Evaluators
examined records from July 1, 2015 to their LEAD referral and the period after referral through
July 1, 2020.
For a point of reference to LEAD client citations, triaged only client citations were assessed and
broken up into the same beginning date as LEAD clients (July 1, 2015) and then by the LEAD
program start date of July 1, 2018. This provides two different timelines to compare citations with
LEAD clients before referral into LEAD and after entrance into LEAD.
From July 1, 2015 to the start of the LEAD program, the most commonly cited offenses among
enrolled LEAD clients were entering a closed public park, followed by jaywalking, drinking in
public areas, and violating park rules and regulations, including a variety of separate citations that
were variations of sit/lie on a public sidewalk (See Fig. 25).

LEAD Honolulu 2-Year Evaluation
! ! !
42!
After being adjusted for the number of months clients participated in the LEAD program, on
average, LEAD clients received 304% more total citations per month after referral into LEAD and
had 7% more cited encounters with an enforcement officer since the start of the program (See Fig.
27).
60
31
27
24
21
20
16
14
12
12
9
9
9
Enter closed public park
Jaywalking (non-crosswalk)
No current safety check (car)
Delinquent vehicle tax (car)
No motor vehicle insurance
Driving without a valid driver's license
Park rules and regulations
Prohibition in public areas
Prohibition of smoking
Registration not in vehicle (MC, car)
Tent in public park prohibited
Sit/lie Chinatown
Possess driver's license/insurance card
Fig. 26 Number of Citations Issued to Triage Clients Prior to July 1,
2018, Beginning July 1, 2015 - Most Frequently Issued
142
41
33
32
27
23
23
22
19
18
13
12
10
Enter closed public park
Jaywalking (non-crosswalk)
Prohibition in public areas
Park rules and regulations
Driving without a valid driver's license
Violated a don't cross pedestrian signal
Simple trespass
Tent in public park
No motor vehicle insurance
Prohibition of smoking
Sit/Lie public sidewalk
No current safety check (car)
Public intoxication
Fig. 25 Number of Citations Issued to LEAD Clients Prior to
Referral Beginning July 1, 2015 - Most Frequently Issued

LEAD Honolulu 2-Year Evaluation
! ! !
43!
The average number of cited encounters per client per month before LEAD was 0.23 and 0.25 after
starting LEAD. The average number of cited encounters per client per year was 2.82 before LEAD
and 3.03 after starting LEAD since the start of the program (See Fig. 27).
From July 1, 2015 to the start of the LEAD program (July 1, 2018), the most commonly cited
offenses among triage clients was entering a closed public park, followed by jaywalking, citations
regarding vehicles including no current safety check for vehicles, delinquent vehicle tax for
vehicles, no motor vehicle insurance, and driving without a valid driver’s license (See Fig. 26).
• Furthermore, several of the most common citations included violating park rules and
regulations, including a variety of separate citations that were essentially different versions
of sit/lie on a public sidewalk. Triage clients had more reported citations regarding vehicles
in comparison to LEAD clients who received more citations regarding sit/lie laws and laws
related to homelessness (See Figs. 25 & 26).
After being adjusted for 24 months (July 1, 2015 to July 1, 2018) for the LEAD program start date
to provide comparison to the LEAD clients’ time before referral, triaged only clients on average
received 82% more total citations per month after the LEAD program start date and had 93% more
cited encounters with an enforcement officer (See Fig. 28).
• After being adjusted for the number of months clients participated in the LEAD program,
on average, LEAD clients received 304% more total citations per month after referral into
LEAD and had 7% more cited encounters with an enforcement officer to provide a
comparison (See Fig. 27).
7%
Frequency of Cited
Encounters
*
3.05
1.36
0
1
2
3
4
Prior to LEAD After Referral to LEAD
Number of Citations
Fig. 26 Year 1 Cited Ecounter
Frequency Per Client, Per Year
2.82
3.03
0
1
2
3
4
Prior to LEAD After Referral to LEAD
Number'of'Citations
Fig. 27 LEAD Client Cited
Encounter Frequency Per Client
over the Course of the Program

LEAD Honolulu 2-Year Evaluation
! ! !
44!
93%
Frequency of Cited
Encounters
*
* Citations were calculated by averaging the number of encounters that resulted in receiving at least
one citation prior to (starting July 1, 2015 before being referred to LEAD) and after starting the
LEAD program. Data were adjusted for the number of months each client was in the program.
The average number of cited encounters per triaged only client per month before the LEAD start
date (July 1, 2018) was 0.20 and 0.38 after the LEAD program start date. The average number of
cited encounters per triage client per year was 2.38 before the LEAD program start date and 4.59
after LEAD start date. The average number of cited encounters per client per month before LEAD
was 0.23 and 0.25 after starting LEAD for the LEAD clients; the average number of cited
encounters per client per year was 2.82 before LEAD and 3.03 after starting LEAD to provide a
comparison.
• LEAD clients received more citations (304% increase from before referral to LEAD) per
month after referral to LEAD compared to the triage clients after the LEAD program start
date (82%).
• However, while LEAD clients had 7% more cited encounters with an enforcement
officer after referral to LEAD, triaged only clients had 93% more cited encounters
with an enforcement officer after the LEAD start date.
o Triaged only clients had a bigger percentage increase in police encounters after
the LEAD start date compared to LEAD clients after referral to the program.
• The average number of cited encounters per triaged only client per year after the LEAD
start date was 4.59, in comparison to 3.03 for LEAD clients after LEAD referral.
2.38
4.59
0
1
2
3
4
5
Prior to LEAD program
start date
After LEAD prgram
start date
Number'of'Citations
Fig. 28 Triaged only Clients Cited
Encounter Frequency Per Client
Over the Course of the Program

LEAD Honolulu 2-Year Evaluation
! ! !
45!
Quality of Life
Clients’ quality of life was assessed through self-reported physical and mental health, social
support, and frequency of trauma within the past 30 days of both first and client last assessment.
Clients saw improvements on several indicators of quality of life, including increases in all of the
changes in social support such as having someone who could help them if they were confined to
bed and someone to love them and make them feel wanted. Clients increased in the number of
times they participated in recreational activities (67%) from first to last assessment (See Fig. 29).
However, clients reported decreases in several indicators of quality of life such as times attended a
community group (-92%), times participated in a support group (-88%), and times visited a
spiritual group (-78%) in the last 30 days from first to last assessment (See Fig. 29).
• Last assessment before the COVID-19 emergency orders indicated a 385% increase in
the number of times attended a community group in the prior 30 days, and decreases
in indicators of quality of life such as times participated in a support group (-50%)
and times visited a spiritual group (-34%) in the last 30 days from first to last
assessment.
o There were larger decreases in indicators of quality of life after the COVID-19
emergency orders, which is to be expected as many organizations and groups
were forced to close their doors temporarily.
Fig. 29 Change in Community Support from First to Last Assessment
First
Assessment
Last
Assessment
Percent
Change
Times visited a spiritual group in the last 30 days
2.22
.48
-78.38%
Times attended a community group in the last 30 days
.26
.02
-92.31%
Times engaged in recreational activities in the last 30 days
7.92
13.19
66.54%
Times participated in a support group in the last 30 days
1.20
.14
-88.33%
Fig. 30 Change in Social Support from First to Last Assessment
First
Assessment
Last
Assessment
Percent
Change
Someone to help you if you were confined to bed
2.46
3.26
32.52%
Someone to take you to the doctor if you need it
2.64
3.31
25.38%
Someone to share your most private worries and fears with
2.66
3.31
24.44%
Someone to turn to for suggestions about how to deal with a personal
problem
2.92
3.43
17.47%
Someone to do something enjoyable with
2.70
3.36
24.44%
Someone to love and make you feel wanted
2.62
3.31
26.34%
Range: 1= None of the time, 5= All of the time

LEAD Honolulu 2-Year Evaluation
! ! !
46!
Clients saw gains in mental health, sleep, and energy. The number of mentally unhealthy days
decreased by 24%; the number of days anxious decreased by 22%; the number of days depressed
decreased by 18%; the number of days not getting enough sleep decreased 19%; the number days
of activity limitation decreased by 26%; and the number of days full of energy increased by 43%
since the start of the program (See Fig. 31). All of these findings are with 7% of findings from
Year 1 and within 10% of the last assessment when adjusted for the COVID-19 emergency
order date.
However, physical health did not see the same gains. While number of days in pain decreased
slightly (2.88%), the number of physically unhealthy days increased by 20% (See Fig. 31).
• Last assessment before the COVID-19 emergency orders indicated a 24% decrease in
the number of days in pain and the number of physically unhealthy days increased by
5% from first to last assessment in the prior 30 days (See Fig. 31).
o Indicating clients reported better physical health before the COVID-19
emergency order date.
These findings suggest the physically vulnerable state of LEAD clients and reflect previous
findings that perceptions of physical health decline after gaining stability.
9
Fig. 31 Change in Client Health and Wellbeing from First to Last Assessment
First
Assessment
Last
Assessment
Percent
Change
COVID-19 Last
Assessment
(Percent Change)
General health (excellent {1} – poor {5})
3.48
3.50
0.58%
3.57 (2.59%)
# Physically unhealthy days past month
13.39
16.10
20.24%
14.06 (5.00%)
# Mentally unhealthy days past month
23.14
17.67
-23.64%
15.71 (-32.11%)
# Actively limitation days past month
17.96
13.21
-26.45%
13.26 (-26.17%)
# Days in pain past month
14.24
13.83
-2.88%
10.77 (-24.37%)
# Days depressed past month
21.24
17.52
-17.51%
15.14 (-28.72%)
# Days anxious past month
23.98
18.60
-22.44%
14.83 (-38.16%)
# Days not enough sleep past month
20.58
16.67
-19%
14.00 (-31.97%)
# Days full of energy past month
6.51
9.29
42.70%
9.57 (47.01%)
Clients saw reductions in frequencies of traumatic experiences from first to last assessment over
the 2 years of the LEAD program. Experiences with trauma decreased by 23%, and witnessing
trauma decreased by 5% (See Fig. 32). These decreases were similar to Year 1 findings of
experiences with trauma decreased by 30%, and witnessing trauma decreased by 6%.
10
Overall,
experiences with trauma were infrequent.

LEAD Honolulu 2-Year Evaluation
! ! !
47!
• Last assessment before the COVID-19 emergency orders regarding experiences with
trauma decreased by 36% (2.86 first assessment to 1.83 last assessment), and
witnessing trauma decreased by 24% (2.18 first assessment to 1.66 last assessment) in
the prior 30 days.!
o Clients reported larger decreases in experiences with trauma and witnessing
trauma from first to last assessment before the COVID-19 emergency orders,
indicating clients may be experiencing more encounters with trauma during
the pandemic. !
Fig. 32 Frequency of Experiences with Trauma—Never (1) to Very Often (5)—from First to
Last Assessment
First
Assessment
Last
Assessment
Percent
Change
Experienced violence, trauma, or sexual maltreatment/assault within or
outside of the family in past month
2.86
2.20
-23.08%
Witnessed someone close to you being hit, kicked, slapped, or otherwise
physically or emotionally hurt in past month
2.18
2.07
-5.05%
While the LEAD HNL clients have made some progress in their overall quality of life, particularly
in their mental health, they still experience difficulties much greater than the average adult living in
Hawaiʻi. (See Fig. 33).
• According to data from the CDC BRFSS,
11
in 2018, the average adult living in Hawaiʻi
experienced 3.42 physically unhealthy days per month, compared to 16.10 per month
experienced by the LEAD HNL sample at their last assessment (See Fig. 33).
• The average adult living in Hawaiʻi experienced 3.26 mentally unhealthy days per month,
while LEAD HNL clients experienced 17.67 at their last assessment (See Fig. 33).
• LEAD Year 1 findings found similar above state and national averages for clients in
regards to 16.55 physically unhealthy days per month and 17.71 mentally unhealthy days
per month.
10
Fig. 33 LEAD Clients Compared to General HI Population in Number of Unhealthy Days
3.42
3.26
16.10
17.67
14.06
15.71
0
10
20
30
# Physically Unhealthy Days # Mentally Unhealhty Days
HI Adult LEAD Client Pre-COVID-19 Last Assessment

LEAD Honolulu 2-Year Evaluation
! ! !
48!
Client Testimonials
During the months of March 2019 through July 2020, evaluators conducted 13 interviews with
LEAD clients through face-to-face and over-the-phone format after adjusting to COVID-19 social
distancing requirements. Interview questions were designed to evaluate the LEAD HNL program
from the perspective of LEAD clients receiving services. Participation in the interview was
voluntary and approved by the University of Hawaiʻi Human Studies Program IRB. The interviews
were transcribed and de-identified to protect the confidentiality of clients.
LEAD clients consistently credited the program and their case workers for their improved self-
efficacy, agency, and self-worth. There was an overall agreeance that the LEAD program was
unique from other case management programs clients have been a part of in the past. Reasoning
behind this included case managers’ commitment to their clients’ success through follow-ups and
check-ins, and strong determination to help fulfil their clients’ needs and goals through the services
provided by the LEAD program. The LEAD program provided a safe and judgment free program
according to clients, which was not the case with other programs. Clients also discussed how
LEAD staff were always up-front and honest with them, indicating a relationship like family and
friends and providing an avenue for trust to be built. The topic of finding housing was brought up
with all clients. The majority of clients who were housed through LEAD services credited this as
their greatest success, and those who have not yet been housed indicated this as their greatest wish
and goal for the program.
…LEAD Client 1
LEAD client 1 has been a part of LEAD for two years. Before entering
the program, she was houseless and had negative experiences with
shelters on O‘ahu. The client now has a loft apartment which she credits to her
LEAD case manager and other program staff for their connections and guidance to
help her secure. She also credited the program for allowing her to better understand
herself and what she needs to do in life to succeed. She has spent most of her life
alone and taking care of herself, the client discussed how her case manager provides
her guidance and friendly encouragement that keeps her from resuming bad habits.
The client conveyed that her case manager and LEAD staff continue to listen to her
and her needs without overlooking her opinions, she feels she has a say in her case
management and success. This provided the foundation for her trust in her case
manager and why she continues with the program and working on her success.
LEAD Honolulu 2-Year Evaluation
! ! !
49!
…LEAD Client 2
LEAD client 2 has been a part of LEAD for under two years. Before
entering the program, he was houseless and had problems with
alcohol abuse and mental troubles. The client indicated that his case
manager never judged him for his past and problems, LEAD staff do everything they
can to help out their clients and get them all of the services they can to fit their
needs. Client 2 discussed how his case manager connected him with professional
counseling, a doctor for medications, and alcohol treatment services. The client
also credited his case manager for his success with the program because they made
sure he always had transportation to his doctor’s appointments, psychiatric
appointments, as well as transportation and reminders for AA meetings. Client 2
disclosed that his greatest success of the LEAD program has been overcoming his
alcohol addiction, which was a result of his case manager helping him find
treatment through rehab and AA meetings, as well as continued support.
…LEAD Client 3
LEAD client 3 has been a part of LEAD for a little over a year and a
half. Before entering the program, he was houseless and had
numerous encounters with the Honolulu Police Department because of sweeps of
houseless individuals in the Kaka’ako area. The client discussed how LEAD staff
and his case manager helped provide him with the path to obtain food stamps and
other assistance for his daily life. The client disclosed that his case manager
provided support and continued care for him, which was unique from other
programs and case management he had received in the past. The client stated that
his case manager cares about their clients and took the time to build trust between
the two, something the client was hesitant about at first. The client disclosed that
things take time when it comes to receiving services, but his case manager kept him
informed and provided support. The client credited his case manager for helping him
secure an apartment as well as reconnect with his family.

LEAD Honolulu 2-Year Evaluation
! ! !
50!
Conclusions
• While LEAD HNL has not begun diversion, the program is currently operating at capacity,
relying on social referrals from the HPD H.E.L.P. initiative, the Sheriff’s Division, and
other community partners.!
!
• Sixty-eight percent of the 57 referred clients are actively engaged with LEAD case
management services, while 10 are enrolled but not engaged and 7 were referred but not
enrolled, and 1 client was deceased.
• Client service use of case management, medical services, transportation assistance, soup
kitchen or food pantry, day center, legal services, and permanent housing has increased
substantially, suggesting that clients are receiving more comprehensive, wrap-around
services.
• Permanent housing continues to be one of the most pressing needs for LEAD clients. While
the percentage of clients who lived in an independent apartment for the entire previous
month increased from 4% at first assessment to 33% at the last assessment, 67% of the
participants still need to be permanently housed. 37% of clients (18) were currently housed
at the time of this report.
• While the number of cited encounters with law enforcement for enrolled LEAD clients
slightly increased 7% after referral to the LEAD HNL program, this was substantially lower
than the 93% increase in cited encounters for clients who were triaged only for the program
but were not enrolled.!
o Suggesting that there may have been an increase in the overall number of citations
by HPD to people experiencing homelessness during this period.
• Clients have improved significantly on indicators of quality of life from first to last
assessment. They have reported increased hope for the future, decreased stress, decreased
trauma, and increased mental wellbeing.!
!
o Despite these notable improvements, clients still score well below the average adult
living in Hawaiʻi on indicators of physical and mental health.!
!
o Additionally, the number of physically unhealthy days increased 20%. This uptick
in physically unhealthy days mirrors other findings that after 3-6 months of housing
or stability, clients often experience a dip in wellbeing.
9
• Overall, results from the start of the program suggest that socially referred LEAD clients
are improving on indicators established in the LEAD Theory of Change and that the
program is on track to achieve projected community impacts. !

LEAD Honolulu 2-Year Evaluation
! ! !
51!
VI. Recommendations

LEAD Honolulu 2-Year Evaluation
! ! !
52!
Based on findings related to program implementation and outcomes, we make the following
recommendations for the program, funders, and community stakeholders.
Recommendations for the Program
• Continue to work on establishing partnerships with local law enforcement, the prosecutor’s
office and other criminal justice agencies to seek reconciliation over a working relationship
in order for diversion to begin. Currently, all referrals are social referrals, indicating a
further need for partnerships for diversion efforts to begin.
• Continue to seek permanent housing opportunities and options for clients.
• Continue developing culturally appropriate and community-based approaches to harm
reduction initiatives because of the high percentage of Native Hawaiian and Pacific Islander
clients.
• Consider addressing increases in alcohol use, perhaps encouraging engagement in treatment
services or creating new community support groups for LEAD clients.
• Consider expanding additional resources and time spent per month to outreach to enrolled
but not engaged clients.
• Provide renewed focus on attending to client physical health, often associated chronic
health conditions. !
• Develop a triage protocol for individuals referred to or encountered by LEAD HNL through
social contact referral or interested triage participants who are not suitable for the
program/unable to join the program due to saturation, but need assistance nonetheless in
order to triage (link and sync) those individuals out to other local service providers.
• Incorporate COVID-19 measures to determine changes in outcomes as a result of the
worldwide pandemic.

LEAD Honolulu 2-Year Evaluation
! ! !
53!
Recommendations for Funders & Other Stakeholders
• We strongly encourage the state prosecutor’s office to seek reconciliation over a
Memorandum of Agreement (MOA) in order for diversion to begin. While the program has
been successful within the first 2 years of implementation, we anticipate greater success
when the program can operate with full fidelity to the program model, which stressed
diversion as a form of recruitment.
• We strongly encourage operational work group training of law enforcement to create a
better link-and-sync between partners; this may require virtual trainings and utilizing
community partnerships to create culturally appropriate and Hawai’i-specific trainings.
• Once law enforcement partnerships are better established, development and implementation
of training for law enforcement on how they can participate in the implementation of
LEAD is highly encouraged.
• Accurate measures and statistics regarding the LEAD neighbor island programs are not
available because of external factors; however, each program lost funding after a short pilot
timeframe. Increased time and funding is required to determine the effectiveness of the
LEAD neighbor island programs, neighbor islands had better success with law enforcement
partnerships for possible diversion recruitment.
• While we did not assess the cost-effectiveness of this program, in the first 2 years of
implementation, only taking into account the large drop in emergency room use (56%) and
hospital admittance in the past month (30%), it is very likely that the financial benefits
outweigh the financial costs of the program. This, paired with clear improvements in the
wellbeing of clients, inclines us to recommend the expansion of the program across the
entire County of Honolulu.

LEAD Honolulu 2-Year Evaluation
! ! !
54!
VII. Next Steps

LEAD Honolulu 2-Year Evaluation
! ! !
55!
For Evaluators
• Continue collecting survey, archival, and any other case management client data.
• Conduct interviews with case managers to determine the effects of the COVID-19
pandemic on client interactions, client success, and service barriers.
• Examine key differences in service utilization and history of clients with different
program status (i.e., enrolled but not engaged, referred but not enrolled, triage clients, and
active).
• Follow-up with triage clients to determine reasons for not enrolling in LEAD HNL, as
well as measure short and long term outcomes for comparison with LEAD HNL enrolled
clients.
• Pursue available data resources to estimate the financial costs vs. benefits of
administering the program.
• Pursue Honolulu-specific or state-level data regarding law enforcement citations by year
to uncover trends in citations by neighborhood tracks.
• Ensure LEAD HNL meets regularly with outer island LEAD stakeholders to provide
technical assistance, and continue pursuing data obtainment from neighbor islands for
reporting.

LEAD Honolulu 2-Year Evaluation
! ! !
56!
VIII. Appendices

LEAD Honolulu 2-Year Evaluation
!
57!
A. The Law Enforcement Assisted Diversion (LEAD) Program Logic Model
B.

LEAD Honolulu 2-Year Evaluation
! ! !
!
58!
B. Evaluation Methodology
This program evaluation report will focus on the implementation of LEAD in urban Honolulu
between August 1, 2019 and July 31, 2020. In particular, the evaluation strives to:
• Understand aspects of LEAD HNL process and implementation;
• Assess adherence to LEAD fidelity and extent of necessary program modifications;
• Detect outcomes and impacts; and
• Examine achievement of goals and objectives.
This program evaluation report outlines progress achieved thus far and explains the program
evaluation plan in more detail.
Process and Implementation
In an effort to document the intended program process, the program evaluation team, in
collaboration with HHHRC, developed a logic model that details program activities (e.g.,
identification of vulnerable people, case management services, etc.) and expected outputs (e.g.,
number of people identified, number of services needed, number of services received).
Additionally, the logic model lists anticipated short-term goals, long-term goals, and overall
program impacts and delineates the process that leads to the attainment of these goals and
objectives.
Program Fidelity
Fidelity refers to the degree to which a program is implemented as intended
.
!
Sometimes
programs must be adapted to better fit the communities in which they are implemented.
However, it is important to measure fidelity by tracking what components are changed and what
components are implemented as intended in order to assess which components can be changed
and still achieve program effects. LEAD advances 6 primary goals:
1. Reorient government’s response to safety, disorder, and health-related problems.
2. Improve public safety and public health through research based, health-oriented and
harm reduction interventions.
3. Reduce the number of people entering the criminal justice system for low level offenses
related to drug use, mental health, sex work, and extreme poverty.
4. Undo racial disparities at the front end of the criminal justice system.
5. Sustain funding for alternative interventions by capturing and reinvesting justice systems
savings.
6. Strengthen the relationship between law enforcement and the community
.
"

LEAD Honolulu 2-Year Evaluation
! ! !
!
59!
Many components of LEAD can be adapted to fit local needs and circumstances. However, there
are certain core principles that are essential in order to achieve the transformative outcomes seen
in Seattle. Those include: (i) LEAD’s harm reduction/Housing First framework, which requires a
focus on individual and community wellness rather than an exclusive focus on sobriety, and (ii)
the need for rank and file police officers and sergeants to be meaningful partners in program
design and operations
.
"
In order to be considered a LEAD model, programs should contain most
of the components outlined above.
Outcomes and Impacts
The overall outcomes and impacts of the LEAD model include decreasing Hawai’i recidivism
rates, addressing overcrowded correctional facilities, and transforming Hawai’i’s criminal justice
system from punitive to rehabilitative. With the successful implementation of the LEAD model,
outcomes will include engagement in services, a reduction in criminal activity, and
improvements in health and wellbeing.
Specific Goals and Objectives
There are several goals that LEAD services attempt to achieve. Short-term goals are focused on
physical aspects of clients’ daily lives. These include improved housing stability, increase in
social support, reduction in substance use, decrease in stress, as well as increasing engagement in
services and connection to community resources. Long-term goals focus on stability and include
reduction in emergency room use, reduction in inpatient hospital stays, reduction in arrests and
incarceration, and improved quality of life.
The anticipated progression of these outcomes and potential impact of the program is outlined in
Figure 1 LEAD Theory of Change on page 34. In addition, the overall program logic model is
outlined in Figure 2 The Law Enforcement Assisted Diversion (LEAD) Program Framework on
page 58.
The following research questions – as stated in the Logic Model (Appendix B) – address four
main areas of concern:
1. Do individuals who agree to participate in LEAD programming make contact with and
obtain social services?
2. Is participating in LEAD programming associated with a lower likelihood of being cited
or arrested compared to before participating in the LEAD program?!
!
3. Is!participating!in!LEAD!programming!associated!with!changes!in!housing!stability?!
!
4. Is!participating!in!LEAD!programming!associated!with!improvements!in!health!and!
wellbeing?!

LEAD Honolulu 2-Year Evaluation
! ! !
!
60!
LEAD HNL Measures
Informed by best practices the program evaluation team works closely with frontline staff at
HHHRC to capture data that helps understand how the LEAD program works in urban Honolulu.
LEAD HNL case managers work with clients to address their specific needs and challenges by
offering services directly at HHHRC and also serving as a liaison between other community
service providers. Data is collected throughout this process in the following way:
Honolulu LEAD Client Screening Form: Collects demographic and contact information for
data follow-up as well as provides an initial introduction of the client to the case manager
including:
● social services clients currently
receive
● social services clients are interested in
receiving
● recent substance use history
● housing situation
Honolulu LEAD Intake and Needs Assessment (LINA) – LEAD HNL staff follow-up with
clients to collect more in-depth information about them:
● housing
● history of houselessness
● substance use
● social support
● community engagement
● stress levels
● risky behavior
● general health
● history of chronic conditions and
treatment
● social services clients currently
receive
● social services clients are interested in
receiving
● recent arrest information
● recent hospitalization information

LEAD Honolulu 2-Year Evaluation
! ! !
61!
Honolulu Follow-up LEAD Intake and Needs Assessments (F-LINA): Case workers use a
shortened version of the LINA called the F-LINA to follow-up with clients regarding the in-
depth information collected during the LINA. Our measurement timeline is listed below.
eCourt Kokua: Used to calculate client recidivism.
Data collection frequency
Administration of Measure by Month
Measure
Intake
1
month
3
months
6
months
9
months
12
months
Honolulu LEAD Client
Screening Form
X
X
Honolulu Follow-up
LEAD Intake and Needs
Assessment
(F-LINA)
X
X
X
X
Qualitative Interviews
with LEAD HNL
Service Providers
X
Direct Service
Summaries & Feedback
Ongoing
Interaction with law
enforcement histories
(eCourt Kokua)
Ongoing

LEAD Honolulu 2-Year Evaluation
! ! !
62!
C. Evaluation Timeline
July-August 2018:
Develop assessment tools and protocols.
Begin recruiting program clients through social contact referral.
Initiate surveying of program clients using the Honolulu LEAD
Client Screening Form and the Honolulu Long Intake and
Needs Assessment (LINA) form.
September-October 2018:
Continue recruiting program clients.
Established and continued widespread surveying of each
program participant.
November-December 2018:
Continue recruiting program clients.
Continued surveying of program clients.
Initiate surveying of program clients using the
Honolulu Follow-up LEAD Intake and Needs Assessment (F-
LINA).
Released Honolulu’s Law Enforcement Assisted Diversion
(LEAD) Progress Status Report.
January-February 2019:
Stopped recruiting new clients.
Continued surveying of program clients.
March-April 2019:
Continued surveying of program clients.
Conducted Zoom training on intake and assessment tools (i.e.,
LEAD Client Screening Form, LINA, and F-LINA) with LEAD
Maui team.
Released Honolulu’s Law Enforcement Assisted Diversion
(LEAD) Program Evaluation Plan.
May-June 2019:
Continued surveying of program clients.
July-August 2019:
Continued surveying of program clients.
Conducted staff interviews.

LEAD Honolulu 2-Year Evaluation
! ! !
63!
Gathered data on billable hours spent by case managers with
program participants using WITS database
Gathered data on encounters with law enforcement experienced
by program participants before and after being enrolled in the
program using eCourt Kokua database.
Begin to analyze 1-Year evaluation findings.
September-October 2019:
Continue to analyze 1-Year evaluation findings.
Write-up and report 1-Year evaluation findings.
November-December 2019:
Re-commenced recruiting program clients.
Continued surveying of program clients.
Finalized Case Management Acuity Tool Form for use by
LEAD Honolulu staff.
Initiate surveying of program clients using the Case
Management Acuity Tool.
January-February 2020:
Continued surveying of program clients.
Released 4 briefs highlighting findings of the 1-Year evaluation
findings: (1) Honolulu LEAD 1-Year Citations Report; (2)
Honolulu LEAD 1-Year Reasons for Experiencing
Homelessness Report; (3) Honolulu LEAD 1-Year Services
Needed & Used Report; and (4) Honolulu Law Enforcement
Assisted Diversion Qualitative Report: Staff Interviews.
March-April 2020
Continued surveying of program clients.
Conducted client interviews.
Conducted Zoom program evaluation check-in with LEAD
Island of Hawai’i team.
Conducted Zoom program evaluation check-in with LEAD
Kaua’i team.

LEAD Honolulu 2-Year Evaluation
! ! !
64!
May-June 2020
Continued surveying of program clients.
Conducted client interviews.
Conducted Zoom program evaluation check-in with LEAD
Maui team.
July-August 2020
Continued surveying of program clients.
Conducted client interviews.
Gathered data on encounters with law enforcement experienced
by triage and program participants before and after being
enrolled in the program using eCourt Kokua database.
Begin to analyze 2-Year evaluation findings.
September-October 2020
Continue to analyze 2-Year evaluation findings.
Write-up and report 2-Year evaluation findings.
1
About LEAD. (n.d.). LEAD, Law Enforcement Assisted Diversion. Retrieved from
http://leadkingcounty.org/about/
2
Collins, S. E., Lonczak, H. S., and Clifasefi, S. L. (2015). LEAD Program Evaluation: Criminal Justice and Legal
System Utilization and Associated Costs. Harm Reduction Research and Treatment Lab University of Washington –
Harborview Medical Center. Retrieved from
https://docs.wixstatic.com/ugd/6f124f_2f66ef4935c04d37a11b04d1998f61e2.pdf
3
LEAD National Support Bureau (n.d.). Background on LEAD. Retrieved from https://www.leadbureau.org/about-
lead
4
LEAD. (n.d.). Hawaii Health and Harm Reduction Center. Retrieved from https://www.hhhrc.org/lead
5
HCR 85 Task Force. (2017). Interim report of the HCR 85 Task Force (on effective incarceration policies and
improving Hawaii’s correctional system) to the legislature for the regular session 2017. State of Hawaii. Retrieved
from http://www.courts.state.hi.us/wp-content/uploads/2016/07/HCR_85_TASK_FORCE_INTERIM_REPORT.pdf
6
U.S. Census. (2019). Hawaii Population Characteristics 2019. Retrieved from https://census.hawaii.gov/wp-
content/uploads/2020/06/Hawaii-Population-Characteristics-2019.pdf?
7
Partners in Care Oahu’s Continuum of Care. (2020). 2020 Oahu Point in Time Count: Comprehensive Report.
Retrieved from
https://static1.squarespace.com/static/5db76f1aadbeba4fb77280f1/t/5efa984a8ae4f774863509e8/15934
81306526/PIC+2020+PIT+Count+Report+Final.pdf???
8
Hawaiʻi State Judiciary (2020). eCourt Kokua. Retrieved from
https://www.courts.state.hi.us/legal_references/records/jims_system_availability
9
Pruitt,?A.?S.,?&?Barile,?J.?P.?(2017).?Housing?First?program,?year?two?evaluation.?Prepared?for?the?City?and?
County?of?Honolulu?and?the?Institute?for?Human?Services,?Honolulu,?H.I.
10
Gralapp, S., Willingham, M., Pruitt, A. S. & Barile, J. P. (2019). Law Enforcement Assisted Diversion Honolulu
1-Year Program Evaluation. Prepared for Hawai‘i Health & Harm Reduction Center and the Hawai‘i State
Department of Health, Honolulu, H.I.
11
U.S.?Center?for?Disease?Control?(2018).?Behavioral?Risk?Factor?Surveillance?System.?Retrieved?from?
https://www.cdc.gov/brfss/index.html?
