
MARICOPA COUNTY
SCOTTSDALE REALTORS
®
APRIL

Maricopa County, Arizona
Market Trends
Realtors Property Resource
®
, LLC Source: Listings
Median Estimated Property Value
Realtors Property Resource
®
, LLC Source: Public Records and Listings
Property Type: SF + Condo/TH/Apt
April 2024
Market Type
Seller's
Market
Balanced
Market
Buyer's
Market
Key Details
Months of Inventory
3.99
3.1% MoM
List to Sold Price %
98.5%
0.04% MoM
Median Days in RPR
46
4.55% MoM
Median Sold Price
$489,000
1.32% MoM
April 2024 Property Type: SF + Condo/TH/Apt
$479,350
Last Month Change
+0.3%
12 Month Change
+4.3%
Median Estimated Value
Median Estimated Value
$0
$100K
$200K
$300K
$400K
$500K
$600K
Jul '08
Jan '09
Jun '09
Nov '09
Apr '10
Sep '10
Feb '11
Jul '11
Dec '11
May '12
Oct '12
Mar '13
Aug '13
Jan '14
Jun '14
Nov '14
Apr '15
Sep '15
Feb '16
Jul '16
Dec '16
May '17
Oct '17
Mar '18
Aug '18
Jan '19
Jun '19
Nov '19
Apr '20
Sep '20
Feb '21
Jul '21
Dec '21
May '22
Oct '22
Mar '23
Aug '23
Jan '24
Maricopa County Arizona USA

New Listings
Realtors Property Resource
®
, LLC Source: Listings
Active Listings
Realtors Property Resource
®
, LLC Source: Listings
April 2024
Property Type: SF + Condo/TH/Apt
Median List Price
$525,000
1.9% MoM
# of Properties
7,133
6.3% MoM
Median $/Sqft
$285
0.7% MoM
Total $ Volume
$5,311,474,241
7.2% MoM
Median Living Area Sqft
1,902
0.3% MoM
↑ ↓ ↑ ↓ ↑
List Price
$100K
$200K
$300K
$400K
$500K
$600K
Apr '19 Sep '19 Feb '20 Jul '20 Dec '20 May '21 Oct '21 Mar '22 Aug '22 Jan '23 Jun '23 Nov '23 Apr '24
April 2024
Property Type: SF + Condo/TH/Apt
Median List Price
$564,500
2.6%
MoM
# of Properties
15,780
1%
MoM
Median Days in
RPR
46
4.5%
MoM
Median $/Sqft
$290
0.7%
MoM
Total $ Volume
$14,994,885,299
0.5%
MoM
Median Living
Area Sqft
2,035
0.3%
MoM
↑ ↓ ↑ ↑ ↓ ↑
Median Price
$200K
$300K
$400K
$500K
$600K
Apr '19 Sep '19 Feb '20 Jul '20 Dec '20 May '21 Oct '21 Mar '22 Aug '22 Jan '23 Jun '23 Nov '23 Apr '24

New Pending Listings
Realtors Property Resource
®
, LLC Source: Listings
Pending Listings
Realtors Property Resource
®
, LLC Source: Listings
April 2024
Property Type: SF + Condo/TH/Apt
Median List Price
$495,000
# of Properties
4,106
2.3% MoM
Median Days in
RPR
36
2.9% MoM
Median $/Sqft
$276
0.7% MoM
Total $ Volume
$2,847,674,742
4.6% MoM
Median Living Area
Sqft
1,878
0.4% MoM
↑ ↑ ↓ ↑ ↑
Median Price
$100K
$200K
$300K
$400K
$500K
Apr '19 Sep '19 Feb '20 Jul '20 Dec '20 May '21 Oct '21 Mar '22 Aug '22 Jan '23 Jun '23 Nov '23 Apr '24
April 2024
Property Type: SF + Condo/TH/Apt
Median List Price
$510,000
1%
MoM
# of Properties
4,199
14.9%
MoM
Median Days in
RPR
36
16.1%
MoM
Median $/Sqft
$276
1.4%
MoM
Total $ Volume
$3,227,049,889
15.2%
MoM
Median Living Area
Sqft
1,958
0.3%
MoM
↓ ↑ ↑ ↓ ↑ ↑
Median Price
$100K
$200K
$300K
$400K
$500K
$600K
Apr '19 Sep '19 Feb '20 Jul '20 Dec '20 May '21 Oct '21 Mar '22 Aug '22 Jan '23 Jun '23 Nov '23 Apr '24

Sold Listings
Realtors Property Resource
®
, LLC Source: Listings
Months Supply of Inventory
Realtors Property Resource
®
, LLC Source: Listings
April 2024
Property Type: SF + Condo/TH/Apt
Median Sold Price
$489,000
1.3% MoM
# of Properties
5,491
5.9% MoM
Avg. List to Sale
Price %
98.47%
0% MoM
Median Days in
RPR
46
4.5% MoM
Median $/Sqft
$278
1.5% MoM
Total $ Volume
$3,690,640,901
11.3% MoM
↑ ↑ ↑ ↑ ↑ ↑
Median Price
$100K
$200K
$300K
$400K
$500K
$600K
Apr '19 Sep '19 Feb '20 Jul '20 Dec '20 May '21 Oct '21 Mar '22 Aug '22 Jan '23 Jun '23 Nov '23 Apr '24
April 2024 Property Type: SF + Condo/TH/Apt
3.99
Last Month Change
+3.1%
12 Month Change
+79.7%
Months Supply of Inventory
Months Of Inv.
0
1
2
3
4
Apr '19 Sep '19 Feb '20 Jul '20 Dec '20 May '21 Oct '21 Mar '22 Aug '22 Jan '23 Jun '23 Nov '23 Apr '24

Sold Public Records
Realtors Property Resource
®
, LLC Source: Public Records
April 2024
Property Type: SF + Condo/TH/Apt
Median Sold Price
$460,570
2% MoM
# of Properties
2,107
67.9% MoM
Median $/Sqft
$277
1.1% MoM
Median Living Area Sqft
1,729
2% MoM
Total $ Volume
$1,318,601,330
66.9% MoM
↓ ↓ ↑ ↓ ↓
Median Price
$100K
$200K
$300K
$400K
$500K
Apr '19 Sep '19 Feb '20 Jul '20 Dec '20 May '21 Oct '21 Mar '22 Aug '22 Jan '23 Jun '23 Nov '23 Apr '24

Neighborhood Report
Maricopa County, Arizona
Copyright 2024 Realtors Property Resource
®
LLC. All Rights Reserved.
Information is not guaranteed. Equal Housing Opportunity.
5/9/2024
Public Records
Listings
Sales Volume
Public Records
Sales Volume
Listings
Median Sales Price vs. Sales
Volume
This chart compares the listings and
public records sales price trend and
sales volume for homes in an area.
Data Source: Public Record and
Listing data
Update Frequency: Monthly
Neighborhood: Housing Stats and Charts
Maricopa County Arizona USA
Median Estimated Home Value $478K $446K $361K
Estimated Home Value 12-Month Change +3.8% +3.3% +5.7%
Median List Price $565K $499K –
List Price 1-Month Change +2.6% +1.9% –
List Price 12-Month Change +3.6% +4.3% –
Median Home Age 31 31 43
Own 64% 66% 65%
Rent 36% 34% 35%
$ Value of All Buildings for which Permits Were Issued $9.55B $13.8B $307B
% Change in Permits for All Buildings +28% +25% +13%
% Change in $ Value for All Buildings +29% +27% +10%

Neighborhood Report
Maricopa County, Arizona
Copyright 2024 Realtors Property Resource
®
LLC. All Rights Reserved.
Information is not guaranteed. Equal Housing Opportunity.
5/9/2024
Median List Price
Listing Volume
Median Listing Price vs.
Listing Volume
This chart compares the listings and
public records sales price trend and
sales volume for homes in an area.
Data Source: Public Record and
Listing data
Update Frequency: Monthly
Sales Count By Price Range
Price Range of Comps Sold
This chart shows the distribution of
homes reported sold in the past three
months within different price ranges in
the area of your search. The amount
shown for the subject property is sold
data where available, or the property's
estimated value when sales data is
unavailable (such as a non-disclosure
state) or provided in range format.
Data Source: Public records data
Update Frequency: Daily
Sales Count By Price Per Sq Ft
Price per Square Foot of
Comps Sold
This chart shows the distribution of
homes reported sold in the past three
months at different prices per square
foot.
Data Source: Public records data
Update Frequency: Daily

Neighborhood Report
Maricopa County, Arizona
Copyright 2024 Realtors Property Resource
®
LLC. All Rights Reserved.
Information is not guaranteed. Equal Housing Opportunity.
5/9/2024
Sales Count By Living Area
Size of Homes Sold
This chart shows the distribution of
homes reported sold in the past three
months of different sizes in the area of
your search.
Data Source: Public records data
Update Frequency: Daily
Sales Count by Age of House
Age Range of Comps Sold
This chart shows the distribution of
homes reported sold in the past three
months of different age ranges in the
area of your search.
Data Source: Public records data
Update Frequency: Daily
Sales Count by Bedroom
Number of Bedrooms in
Homes Sold
This chart shows the distribution of
homes reported sold in the past three
months, compared by the number of
bedrooms, in the area of your search.
Data Source: Public records data
Update Frequency: Daily

Neighborhood Report
Maricopa County, Arizona
Copyright 2024 Realtors Property Resource
®
LLC. All Rights Reserved.
Information is not guaranteed. Equal Housing Opportunity.
5/9/2024
Neighborhood: People Stats and Charts
Maricopa County Arizona USA
Population 4.43M 7.17M 331M
Population Change since 2020 +4.4% +3.9% +1.8%
Median Age 37 38 39
Male / Female Ratio 50% 50% 50%
Neighborhood Report
Maricopa County, Arizona
Copyright 2024 Realtors Property Resource
®
LLC. All Rights Reserved.
Information is not guaranteed. Equal Housing Opportunity.
5/9/2024
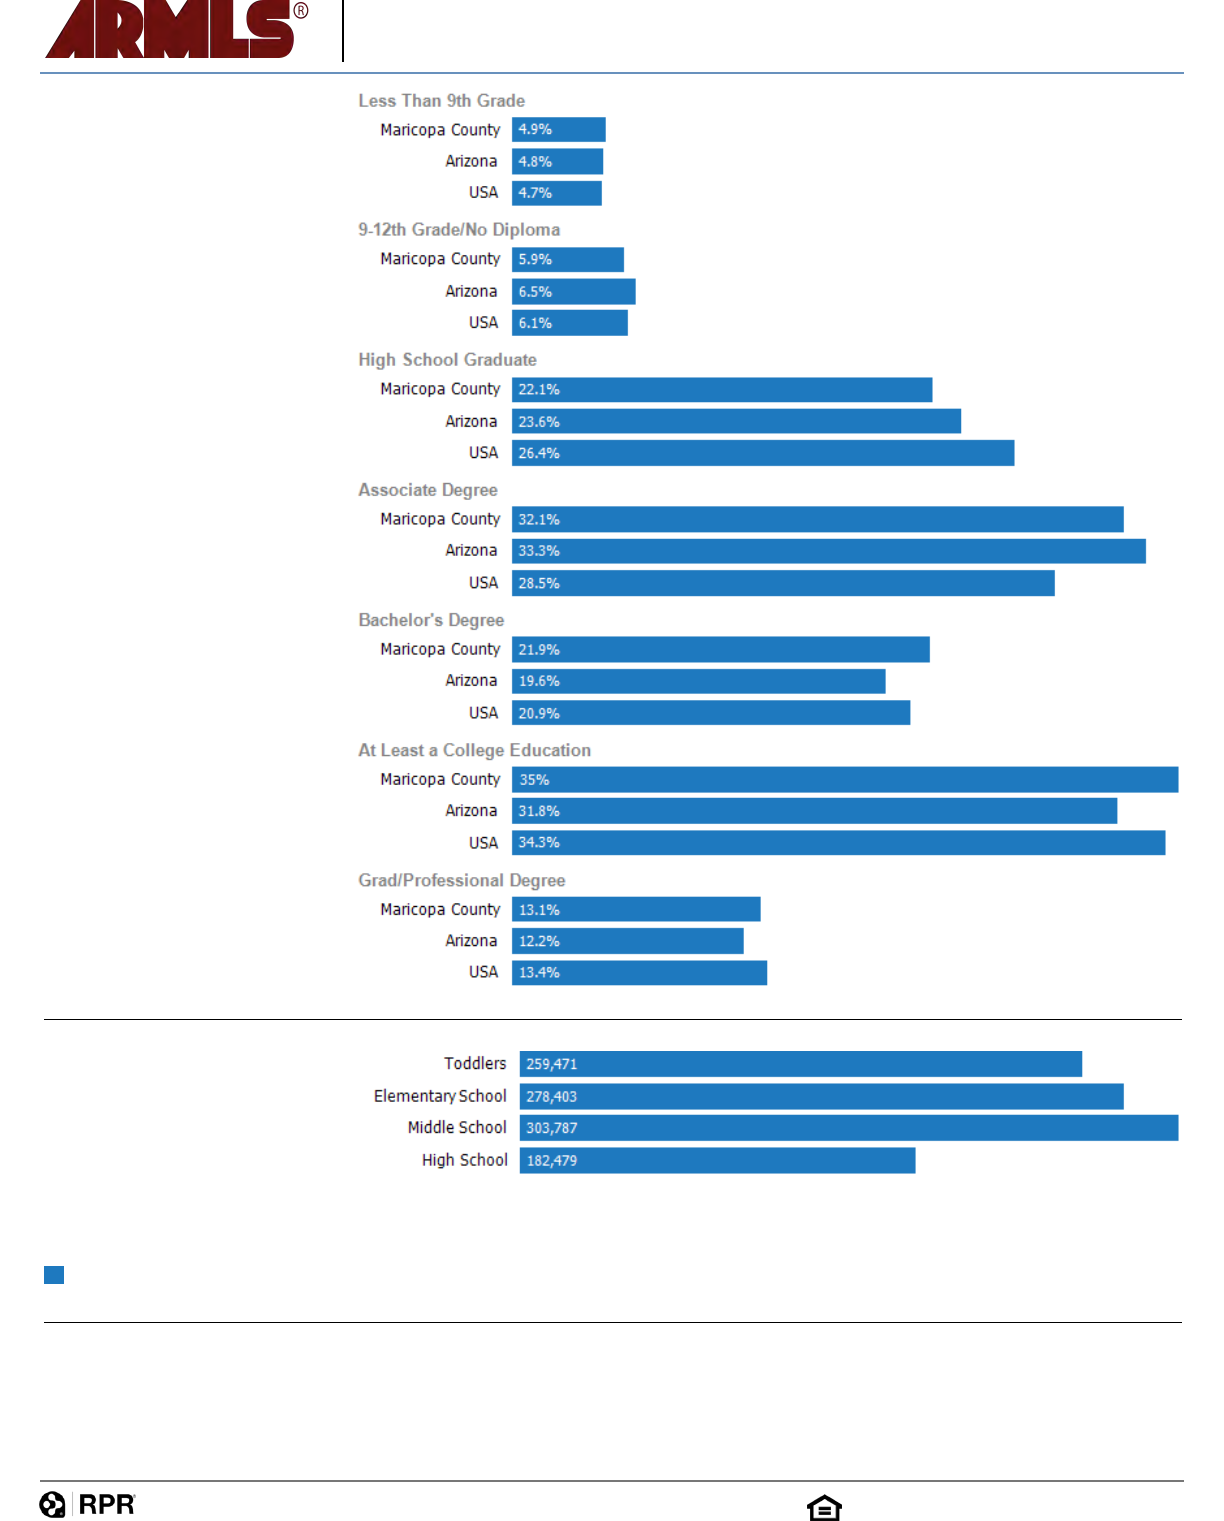
Education Levels of
Population
This chart shows the educational
achievement levels of adults in an
area, compared with other
geographies.
Data Source: U.S. Census American
Community Survey via Esri, 2021
Update Frequency: Annually
Maricopa County
Population of Children by
Age Group
This chart shows the distribution of the
population of children by age range —
from birth to 17 — in the area of your
search.
Data Source: U.S. Census
Update Frequency: Annually

Neighborhood Report
Maricopa County, Arizona
Copyright 2024 Realtors Property Resource
®
LLC. All Rights Reserved.
Information is not guaranteed. Equal Housing Opportunity.
5/9/2024
Maricopa County
Population of Adults by Age
Group
This chart shows the distribution of the
population of adults by age range —
from 18 to 75-plus — in the area of
your search.
Data Source: U.S. Census
Update Frequency: Annually
Maricopa County
Households With Children
This chart shows the distribution of
households with children, categorized
by marital status, in the area of your
search.
Data Source: U.S. Census
Update Frequency: Annually
Maricopa County
Household Income Brackets
This chart shows annual household
income levels within an area.
Data Source: U.S. Census
Update Frequency: Annually
Maricopa County
Presidential Voting Pattern
This chart shows how residents of a
county voted in the 2020 presidential
election.
Data Source: USElectionAtlas.org
Update Frequency: Quadrennially

Neighborhood Report
Maricopa County, Arizona
Copyright 2024 Realtors Property Resource
®
LLC. All Rights Reserved.
Information is not guaranteed. Equal Housing Opportunity.
5/9/2024
Unemployment
Unemployment
This chart shows the relationship
between employment and home prices
in a metro area. Employment is a good
measure of the strength of the local
economy. Generally speaking, the
better the job market, the more likely
home prices are rising.
Data Source: Moody's Analytics:
economy.com
Update Frequency: Monthly
Maricopa County
Arizona
USA
Unemployment Rate
This chart shows the unemployment
trend in the area of your search. The
unemployment rate is an important
driver behind the housing market.
Data Source: Bureau of Labor
Statistics
Update Frequency: Monthly
Neighborhood: Economic Stats and Charts
Maricopa County Arizona USA
Income Per Capita $41,533 $38,334 $41,261
Median Household Income $80,675 $72,581 $75,149
Unemployment Rate 3.3% 3.8% 3.7%
Unemployment Number 81.7K 141K 6.27M
Employment Number 2.38M 3.59M 161M
Labor Force Number 2.46M 3.73M 167M

Neighborhood Report
Maricopa County, Arizona
Copyright 2024 Realtors Property Resource
®
LLC. All Rights Reserved.
Information is not guaranteed. Equal Housing Opportunity.
5/9/2024
Maricopa County
Building Permits
This chart shows the number of
building permits in a county each
quarter.
Data Source: U.S. Census
Update Frequency: Annually
Maricopa County
Occupational Categories
This chart shows categories of
employment within an area.
Data Source: U.S. Census
Update Frequency: Annually

Neighborhood Report
Maricopa County, Arizona
Copyright 2024 Realtors Property Resource
®
LLC. All Rights Reserved.
Information is not guaranteed. Equal Housing Opportunity.
5/9/2024
Neighborhood: Quality of Life Stats and Charts

Neighborhood Report
Maricopa County, Arizona
Copyright 2024 Realtors Property Resource
®
LLC. All Rights Reserved.
Information is not guaranteed. Equal Housing Opportunity.
5/9/2024
Quality of Life in –
Maricopa County Arizona USA
Elevation (in feet) 1,634 4,214 –
Annual Rainfall (in inches) 10.08 13.11 –
Annual Snowfall (in inches) 0.76 13.11 –
Travel Time to Work (in minutes) 26 26 27
Water Quality - Health Violations – – –
Water Quality - Monitoring and Report Violations – – –
Superfund Sites 12 21 2,438

Neighborhood Report
Maricopa County, Arizona
Copyright 2024 Realtors Property Resource
®
LLC. All Rights Reserved.
Information is not guaranteed. Equal Housing Opportunity.
5/9/2024
Maricopa County
Average Commute Time
This chart shows average commute
times to work, in minutes, by
percentage of an area's population.
Data Source: U.S. Census
Update Frequency: Annually
Maricopa County
How People Get to Work
This chart shows the types of
transportation that residents of the
area you searched use for their
commute.
Data Source: U.S. Census
Update Frequency: Annually
Maricopa County
Average Monthly
Temperature
This chart shows average
temperatures in the area you
searched.
Data Source: NOAA
Update Frequency: Annually
This chart rates the overall livability of
a selected ZIP code on a scale from 0
to 100. AARP Livability™ is a
trademark of AARP Inc.
Data Source:
AARP
Update Frequency: Annual
0-19 20-39 40-59 60-79 80-100
Housing
Affordability & Access
52
Neighborhood
Access to Life, Work & Play
53
Transportation
Safe & Convenient Options
52
Environment
Clean Air & Water
5
Health
Prevention, Access & Quality
74
Engagement
Civic & Social Involvement
66
Opportunity
Inclusion & Possibilities
61
Total Score
52 / 100
A score over 50 is above average
Brownfield Sites Yes Yes Yes
AARP Livability™ Index for 85260

Neighborhood Report
Maricopa County, Arizona
Copyright 2024 Realtors Property Resource
®
LLC. All Rights Reserved.
Information is not guaranteed. Equal Housing Opportunity.
5/9/2024
About RPR (Realtors Property Resource)
Realtors Property Resource
®
is a wholly owned subsidiary of the National
Association REALTORS
®
.
RPR offers comprehensive data – including a nationwide database of 164
million properties – as well as powerful analytics and dynamic reports
exclusively for members of the NAR.
RPR's focus is giving residential and commercial real estate practitioners,
brokers, and MLS and Association staff the tools they need to serve their
clients.
This report has been provided to you by a member of the NAR.
About RPR's Data
RPR generates and compiles real estate and other data from a vast array of
sources. The data contained in your report includes some or all of the following:
Listing data from our partner MLSs and CIEs, and related calculations, like
estimated value for a property or median sales price for a local market.
Foreclosure and distressed data from public records.
Census and employment data from the U.S. Census and the U.S. Bureau of
Labor Statistics.
Demographics and trends data from Esri. The data in commercial and
economic reports includes Tapestry Segmentation, which classifies U.S.
residential neighborhoods into unique market segments based on
socioeconomic and demographic characteristics.
Business data including consumer expenditures, commercial market
potential, retail marketplace, SIC and NAICS business information, and
banking potential data from Esri.
School data and reviews from Niche.
Specialty data sets such as walkability scores, traffic counts and flood zones.
Update Frequency
Listings and public records data are updated on a continuous basis.
Charts and statistics calculated from listing and public records data are
refreshed monthly.
Other data sets range from daily to annual updates.
Learn more
For more information about RPR, please visit RPR's
public website: https://blog.narrpr.com
