
SOILS, SEC 2 • GLOBAL CHANGE, ENVIRON RISK ASSESS, SUSTAINABLE LAND USE • RESEARCH
ARTICLE
Influence of vegetation restoration on soil physical properties
in the Loess Plateau, China
Chaojun Gu
1
& Xingmin Mu
1,2
& Peng Gao
1,2
& Guangju Zhao
1,2
& Wenyi Sun
1,2
& John Tatarko
3
& Xuejin Tan
1
Received: 7 December 2017 / Accepted: 4 July 2018 / Published online: 2 August 2018
#
Springer-Verlag GmbH Germany, part of Springer Nature 2018
Abstract
Purpose Extensive vegetation recovery has been implemented to control severe soil erosion on the Loess Plateau, China.
However, no systematic study has been done on the soil improvement benefit and preferable pattern of vegetation rehabilitation.
In this study, the effects of vegetation restoration on soil physical properties at ten sites with different vegetation types and varying
restoration periods were investigated.
Materials and methods The experiment was carried out in the Yanhe river basin in the hilly-gully region of the Loess Plateau.
Ten sites, including two replanted arboreal forests for 25 and 35 years, three replanted scrubland for 15, 30, and 45 years, four
secondary natural grassland for 10, 20, 30, and 40 years, and one farmland, were selected for soil sampling. Sampling was
conducted at 0–20 cm and 20–40 cm layers.
Results and discussion Vegetation restoration significantly decreased bulk density, and increased aggregate stability and
saturated hydraulic conducti vity (Ks), while their effects on porosity was complicated. The soil texture class did not
change with vegetation succession, but minor differences in sand, silt, and clay components were observed. Bulk
density, macroporosity, and > 0.25 mm aggregate stability were the principal physical parameters that affected Ks.
Moreover, bulk density had the most effect on Ks (− 0.84), while > 0.25 m m aggregate stability had the lowest
impact (0.38). Bulk density and Ks were correlated with most of the other soil phys ical properties. Repl anted
scrubland and secondary natural grassland had higher soil physical quality index (S
Dexter
) than replanted arboreal
forests and farmland.
Conclusions It is reasonable to take bulk density and Ks as the indicators to evaluate the effect of vegetation
restoration on soil physical properties. Planting shrubs and grassland is be tter than forest for eco -environment
rehabilitation in the study area. Results of this study provide a reference to regional eco-environmental rehabilitation
and conservation.
Keywords Bulk density
.
Saturated hydraulic conductivity
.
Soil physical properties
.
Soil quality
1 Introduction
China’s Loess Plateau is one of the most severely eroded areas
in the world due to its loose loess soils, steep slopes, high
intensity summer storms, and poor vegetation conditions (Li
et al. 2009). The annual average sediment discharge of the
Yellow River was 16 × 10
8
t between 1919 and 1960, indicat-
ing the seriousness of soil loss in the Loess Plateau (Mu et al.
2012). Soil erosion leads to the removal of soil nutrients and
degradation of soil structure, negatively impacting vegetation
development and impeding soil water transport capabilities
(Berger and Hager 2000). In order to control soil erosion and
restore the regional ecological functions, numerous soil and
Responsible editor: Saskia D. Keesstra
* Xingmin Mu
xmmu@ms.iswc.ac.cn
1
Institute of Soil and Water Conservation, Northwest A&F University,
Yangling 712100, Shaanxi, China
2
Institute of Soil and Water Conservation, Chinese Academy of
Sciences and Ministry of Water Resources,
Yangling 712100, Shaanxi, China
3
Rangeland Resources and Systems Research Unit, USDA–
Agricultural Research Service, Fort Collins, CO, USA
Journal of Soils and Sediments (2019) 19:716–728
https://doi.org/10.1007/s11368-018-2083-3

water conservation practices have been implemented over the
Loess Plateau since the 1950s, especially after the implemen-
tation of Grain-for-Green (GFG) project (Feng et al. 2012).
With the help of large-scale vegetation rehabilitation, veg-
etation coverage of the Loess Plateau increased from 28.8% in
the 1980s to 43.8% in 2012. Meanwhile, soil erosion has been
effectively controlled, and sediment discharge into the Yellow
River decreased significantly after the 1980s (7 × 10
8
t per
year during the 1980s–2000s), particularly after the GFG pro-
ject (4 × 10
8
t per year during 2000–2008) (Mu et al. 2012).
However, the flow of Yellow River declined significantly dur-
ing this period, which exacerbated water shortages in the re-
gion. Numerous researchers have studied the reasons for the
decrease in runoff (Gao et al. 2011). They found that extensive
forestation in this arid region is the primary cause (McVicar et
al. 2007). Large-scale vegetation recovery in the eroded re-
gion increased rainfall interception, surface ground coverage,
and caused changes in soil properties (Fu et al. 2003;Jiaoetal.
2011). Understanding the effects of vegetation restoration on
soil physical properties is important for studying the mecha-
nisms of hydrologic processes. Moreover, a study of vegeta-
tion recovery processes and their impacts on soil properties
would provide critical guide for eco-environmental restoration
or rehabilitation (Li and Shao 2006).
Many efforts have been made to study the effects of vege-
tation recovery on soil properties because of its importance in
eco-restoration and effectiveness (Cerdà 2000; Celik 2005;
Erktan et al. 2016). Previous studies have indicated that re-
vegetation can restore the integrity of disturbed ecosystems by
improving soil physical quality (e.g., decreasing soil bulk den-
sity, incre asing porosity and aggregate stability) (Jia et al.
2011;Lietal.2012). Nevertheless, the impacts of vegetation
restoration on soil properties may vary with the vegetation
type. Li et al. (2012) assessed the effects of vegetation resto-
ration on soil physical properties in the wind–water erosion
region of the Loess Plateau. The results showed that while soil
physical properties (e.g., bulk density, mean weight diameter,
macro-aggregates) have been significantly ameliorated in the
topsoil (0–20 cm layer) under secondary natural grasslands,
they changed adversely for replanted scrubland (e.g.,
Caragana korshinskii, Medicago sativa). Neris et al. (2012)
compared the infiltration rate of green forest and pine forest in
Tenerife with farmland soils. They found that infiltration rate
of the green forest was 11.9 times greater than that of the
farmland soils while pine forest was 2.8 times greater.
Moreover, vegetation effects on soil physical properties varied
with restoration periods (Li et al. 2007; Zhang et al. 2010).
The general conclusion was that the soil bulk d ensity de-
creased significantly with the recovery time (linear relation),
while soil organic matter increased but their relation differ
according to the regions (Zhang et al. 2010).
The Loess Plateau experienced extensive vegetation resto-
ration since the 1950s, and particularly during the recent
20 years (Gao et al. 2011). Their impacts on regional environ-
ment, such as climate, soil properties, and water resource have
been widely studied (Jiao et al. 2011). Soil acts as an indis-
pensable component of the soil–plant–atmosphere continuum
(SPAC). An evaluation of the changes in soil properties as a
consequence of this vegetation restoration efforts is important,
especially for fragile ecological areas. Previous studies have
looked at the influence of vegetation recovery on soil proper-
ties (Fu et al. 2003;Stolteetal.2003). Wilson et al. (2005)
assessed the changes of macropore flow characteristics for
four conditions (i.e., 1 year following tillage, 6 years follow-
ing tillage, 6 years following contour ditching, and greater
than 15 years following tillage) of the Loess Plateau. They
fo
und that total number of macropores (> 1 mm), number of
large (> 5 mm) macropores, and the macroporosity increased
with revegetated time. Moreover, the soil matrix infiltration
rate was highest in the newly established (1 year) and the
oldest (> 15 years) revegetated areas. Xu et al. (2006) identi-
fied soil quality factors and indicators of the Loess Plateau by
32 soil properties. They found that organic matter, hydraulic
conductivity, and anti-scourability were the most important
indicators to characterize soil quality in this loess plateau.
However, changes in soil properties during long-term veg-
etation restoration on the Loess Plateau still require further
thorough studies. For instance, most studies rarely relate
changes i n soil physical properties with different vegeta-
tion types a nd restoration periods, and the choice of pref-
erable pattern of vegetation rehabilitation (e.g., Stolte et al.
2003). Furthermore, majority of published literature fo-
cused on soil physical properties such as bulk density, total
porosity, and aggregate, while less emphasis were on soil
functions such as the hydraulic conductivity and hierarchi-
cal pore (e.g., Jiao et al. 2011). Even though some articles
report hydraulic properties changed with vegetation resto-
ration, their relationships with other physical parameters
were limited (Li et al. 2012). Soil hyd raulic properties
(e.g., saturated hydraulic conductivity, Ks) are important
for soil water movemen t and runoff yield calculations
(Horton 1945), and play important roles in the understand-
ing hydrological response to vegetation restoration.
Following a general conclusion by researchers that the de-
crease in runoff in the yellow river is a consequence of
increased vegetation recover (Gao et al. 2011), it is becom-
ing more important to further investigate the effects of
vegetation restoration on soil physical properties and some
hydraulic functions.
The hilly-gully region of the Loess Plateau is a substantial
soil loss region, which supplies nearly 60% of total sediment
but only approximately 15% of total runoff into the Yellow
River (Wang et al. 2007). It is critical to study the effects of
vegetation restoration on soil physical properties both for the
evaluation of ecological restoration and understanding
of shifts in hydrological regime. For the reasons, we
J Soils Sediments (2019) 19:716–728 717

systematically determined effects of vegetation restoration
on soil physical properties in the hilly-gully region of the
Loess P lateau. Specifically, we evaluated the impacts of
soil physical properties on saturated hydraulic conductivity
and explored the effectiveness of vegetation restoration on
soil physical properties.
2 Materials and methods
2.1 Study area
This study was carried out in the Yanhe River basin in the hilly-
gully region of the Loess Plateau (middle reaches of Yellow
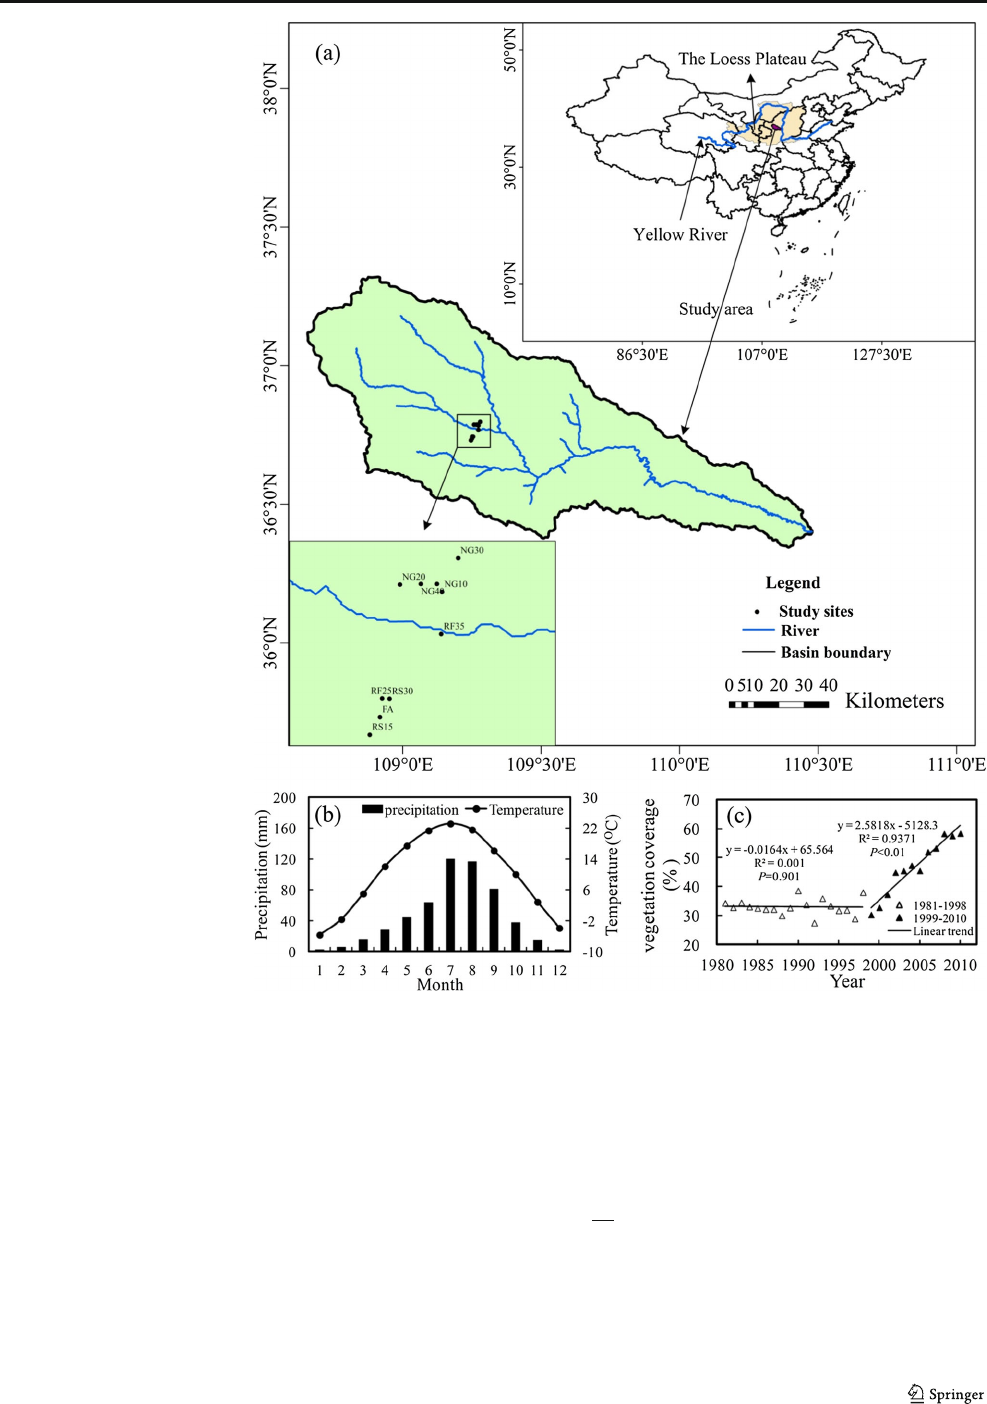
River) of China (Fig. 1a). The study area belongs to a temper-
ate continental semi-arid monsoon climate, with annual aver-
age precipitation and temperature of 538 mm and 9.9 °C, re-
spectively (1952–2015). The precipitation of the area is tem-
porally uneven, with 71.1% of the precipitation falling between
June and September (Fig. 1b). Vegetation restoration of the
basin started in the 1950s, and large-scale revegetation was
further implemented after the GFG project (1999). The vege-
tation cover increased by 2.58% per year after the GFG started
in 1999 and reached 58% in 2010 (Fig. 1c).
2.2 Site selection and sampling design
Ten sites (within 8 km of each other) representing the typical
vegetation restoration in this region were selected within the
basin. T wo sites were replanted to arboreal forests (Robinia
pseudoacacia L.) for 25 and 35 years; three replanted to scrub-
land (Korshinsk pea shrub) for 15, 30, and 45 years; four to
secondary natural grassland for 10, 20, 30, and 40 years; and
one was continuous farmland, used as a control (vegetation
types or treatments are defined in T able 1). The farmland has
been continuously planted to maize for more than 30 years. The
conventional tillage is performed manually by hoeing and resi-
due is removed for use as biofuel. All the vegetation was
replanted on the abandoned croplands. We assumed that local
soil properties are largely a consequence of plant growth and soil
protection during secondary succession, and the initial condi-
tions or management for the sites were similar (Jiao et al.
201 1). The chronosequence of the vegetation was investigated
to examine how soil properties change over time during resto-
ration. This chronological approach has been applied in other
ecosystem research (Fang and Peng 1997) and is considered
retrospective research because existing conditions are compared
with known original conditions and treatments. To reduce the
effects of gradient and elevation on the soil properties, all the
selected sites have the similar gradient (less than 10°) and ele-
vation (less than 200 m) (Table 1). Three plots were established
at each site (20 × 20 m in the forest sites and 10 × 10 m for other
sites) for soil sampling. Three points along the diagonal of the
plot were used for soil sampling and their average represents the
soil parameter value of the plot. The soil sampling was taken in
May, when there is no crop and tillage measure in farmland.
To determine soil physical properties, undisturbed samples
were obtained from the 0–20 cm and 20–40 cm soil layer at
each site. Three intact soil cores (5 cm diameter and 5 cm
height) were obtained using a ring knife in each soil layer,
which was used to measure the bulk density, soil water reten-
tion curve (SWRC), and Ks.
The bulk density was calculated as:
BD ¼ M
d
=V ð1Þ
where BD is the bulk density (g cm
−3
), M
d
is the mass of dry
soil (105–110 °C for 12 h) (g), and V is the volume of soil core
(cm
3
).
Soil water retention curve (SWRC) was measured in the
laboratory by a high-speed centrifuge using undisturbed soil.
Before the measurement, samples were first saturated in water
for 24 h. Then, soil water content (g g
−1
)atpressureheadsof
10, 100, 200, 400, 600, 800, 1000, 2000, 4000, 6000, 8000,
and 10,000 cm H
2
O were measured. To this end, the data was
used for fitting van Genuchten (1980) model (VG). The VG
model was expressed as follows (Van Genuchten 1980):
S
e
¼
θ−θ
r
θ
s
−θ
r
¼
1
1 þ αψðÞ
n
m
ð2Þ
where S
e
is effective saturation, α is a scaling factor (cm
−1
H
2
O), n is pore size distribution parameter, and m =1− 1/n.
Three momentous parameters of SWRC were used to calcu-
late the soil porosity, namely, saturation moisture content
(SMC), field capacity (FC), and permanent wilting point
(PWC) (g g
−1
). FC and WC was the soil water content at
pressure heads of 300 and 1500 cm H
2
O, respectively. Soil
porosity was classified as inactive porosity (IP), microporosity
(MIP), and macroporosity (MAP) in this paper according to
the study of Luxmoore (1981) and Zhang et al. (2016), and
they were expressed as follows:
IP ¼
PWC BD
WD
100% ð3Þ
MIP ¼
FC−PWCðÞBD
WD
100% ð4Þ
MAP ¼
SMC−FCðÞBD
WD
100% ð5Þ
where WD is the water density (g cm
−3
).
A soil physical quality index S
Dexter
(Dexter 2004)canbe
calculated based on the SWRC, and a higher S
Dexter
mean a
better soil physical quality. S
Dexter
was expressed as:
S
Dexter
¼ −n θ
s
−θ
r
ðÞ
1
1 þ m
− 1þmðÞ
ð6Þ
718 J Soils Sediments (2019) 19:716–728
Approximately 1 kg of composite sample was collected
at each plot from each sampling depth for soil texture and
aggregate stability measurement. Air-dried soil sieved
through 2 mm si eve was used for soil particle s iz e mea-
surement by the laser diffraction technique using a
MasterSizer 2000 (Malvern Instruments, Malvern,
England). The soil particle size was classified into sand
(2–0.05 mm), silt (0.05–0.002 mm), and clay (< 0.002 mm)
according to USDA classification system. Aggregate sta-
bility was measured based on air-dried aggregates and
was evaluated according to wet-sieving effects (Li and
Shao 2006).
Ks was measured by the constant water head method using
distilled water at a 5 cm water head (Reynolds et al. 2002).
When a constant flow rate had been established, percolated
water volume per unit time was measured and used to calcu-
late Ks according to Darcy’s Law (Eq. (7)).
v ¼ −Ks
dh
ds
ð7Þ
where v is the percolation velocity (m s
−1
), Ks is the saturated
hydraulic conductivity (m s
−1
), and dh/ds is the hydraulic
gradient (m m
−1
). The percolation velocity can be expressed
Fig. 1 The location of selected
sites (a), mean monthly
precipitation and temperature
during 1952–2015 (b), and
vegetation coverage (1980–2010)
(c) for the study area
J Soils Sediments (2019) 19:716–728 719

as v = Q/Awith Q being the water flux (m
3
s
−1
)andA the cross-
section area that the water flowed through (m
2
). The Ks was
transformed to 10 °C in this study to eliminate the effects of
experiment temperature on Ks (Chi and Wang 2009).
Ks
10
¼
Ks
t
0:7 þ 0:03t
ð8Þ
where Ks
10
was the Ks at 10 °C, Ks
t
is the Ks at t °C, and t is the
temperature of measurement water. Hereafter, Ks denotes the
saturated hydraulic conductivity at 10 °C.
2.3 Data analysis
Analysis of variance (ANOVA) was used to assess the differ-
ences of t he soil properties among the ten sites. When
ANOVA indicated the differences were significant according
to the F values, a Duncan’stestatP < 0.05 was performed to
compare means of soil variables. All the soil variables were
tested whether the data followed a normal distribution and
variance homogeneity by Shapiro test (Shapiro and Wilk
1965) and Bartlett test (Bartlett 1954), respectively. If the data
failed to meet the two conditions, the non-parametric method
(Kruskal–Wallis test) was used for above analysis. Stepwise
regression and path analysis were employed to evaluate the
effects of other soil physical properties on the Ks. Principal
components analysis (PCA) was used to explore the relation
between vegetation restoration and soil properties. All the
statistical tests were performed with R version 3.3.3.
3 Results
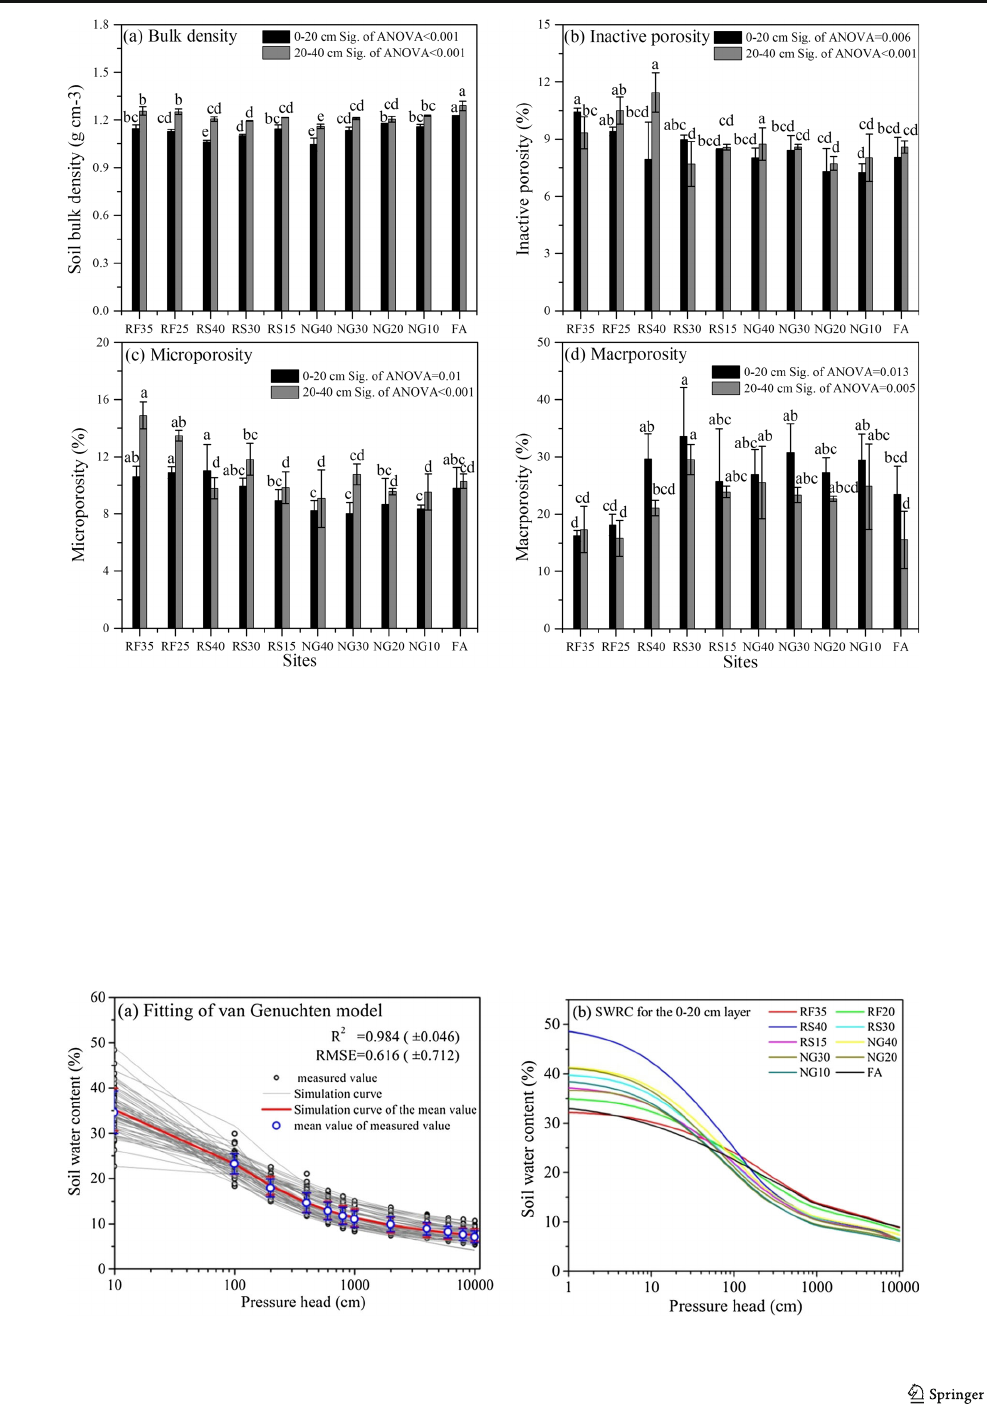
3.1 Bulk density and porosity
Soils in vegetated areas had lower BD at the two different
depths (P < 0.01) (Fig. 2a). In the 0–20 cm layer, BD of the
40-year replanted scrubland (RS40) and natural grass (NG40)
were significantly lower than other treatments. For the RS and
NG treatments, the BD significantly decreased with tim e
while no significant difference was found between replanted
forestland of 35 years (RF35) and 25 years (RF25). In the 20–
40 cm layer, the difference between NG40 and other years
(NG30, NG20, and NG10) was significant, but no significant
differences for the other vegetation types were found for the
different replanted years.
Figure 3a shows the soil water content at each pressure
heads could be well fitted by VG model. The average coeffi-
cient of determination (R
2
) was 0.984, and the mean root-
mean-square error (RMSE) was 0.616 (Fig. 3a). A relative
big difference was found in the soil water characteristic curves
(SWRCs) at the low-pressure heads (< 100 cm) among the
sites compared with high-pressure heads (> 100 cm). The soil
water holding capacity of RS35 was the greatest among the
ten sites at low-pressure heads for 0–20 cm soil layer, while it
dropped sharply at the high-pressure heads (> 100 cm)
(Fig. 3b).
Three categories of soil porosity were calculated based
on SWRC. Inactive porosity (IP) and microporos ity
(MIP) at 0–20 cm soil layer were generally lower than
that of 20–40 cm (Fig. 2b, c). IP of RF35 was signifi-
cantly higher than other sample plots at 0–20 cm layer,
while it was the highest in RS40 f or 20–40 cm layer
(Fig. 2b). In both 0–20 and 20–40 cm soil layers, natural
secondary grassland soil had lower MIP while replanted
forest soil had higher MIP (Fig. 2c). However, the differ-
ence of MIP betw e en mo st ve ge tate d ar eas and far mlan d
was not significant. Macroporosity (MAP) at 0–20 cm
layer for most sample plots was higher than that of 20–
40 cm soil layer (Fig. 2d). Replanted scrubland and nat-
ural secondary grassland had higher MAP than replanted
forestland and farmlan d, especially for RS40, RS3 0,
NG30, and NG10.
Table 1 Description of the sample sites in the Yanhe watershed
ID Vegetation type Age (years) Latitude Longitude Elevation (m) Slope (°) SOM (g kg
−1
)
RF35 Replanted arboreal forest 35 36°46′08″ 109°16′23″ 1140 21 8.32
RF25 Replanted arboreal forest 25 36°44′41″ 109°15′03″ 1152 26 6.98
RS40 Replanted scrubland 40 36°47′16″ 109°16′17″ 1200 28 8.26
RS30 Replanted scrubland 30 36°44′37″ 109°15′13″ 1260 20 8.55
RS15 Replanted scrubland 15 36°43′52″ 109°14′46″ 1340 20 8.41
NG40 Secondary natural grassland 40 36°47′16″ 109°15′30″ 1200 25 8.61
NG30 Secondary natural grassland 30 36°47′51″ 109°16′46″ 1250 26 7.39
NG20 Secondary natural grassland 20 36°47′15″ 109°15′27″ 1230 25 6.57
NG10 Secondary natural grassland 10 36°47′16″ 109°16′24″ 1180 20 5.58
FA Farmland 0 36°44′23″ 109°15′0″ 1173 26 8.49
ID is the sample site identification and SOM is the soil organic matter in 0–20 cm layer. Age refers to the number of years since the cessation of farming
activities
720 J Soils Sediments (2019) 19:716–728
3.2 Soil particle size composition
Mechanical analysis (Table 2) showed that there was signifi-
cantly lower sand contents in soil from revegetated than farm-
land. Additionally, for sand contents in 0–20 cm layer, sec-
ondary natural grassland of 40 an d 30 years (i.e., NG40,
NG30) were lower than NG20 and NG10. Silt contents of
soils in most restored sites were significantly higher than the
farmland soil (FA). For each soil from revegetated, only NG30
was significantly higher than NG20. There was no significant
difference among the ten sites for clay content. However, there
was a trend where clay content increased the longer the plots
were vegetated. Changes of soil particle size composition in
the 20–40 cm layer were similar to the topsoil. Soil texture
Fig. 2 Soil bulk density (a), inactive porosity (b), microporosity (c), and macroporosity (d) for different sample plots. The same letter above the point
denotes they are not significantly different at the 0.05 probability level (Duncan’stest)
Fig. 3 The fitting of VG model (a) and the soil water retention curves of the 0–20 cm layer (b) for the ten study sites
J Soils Sediments (2019) 19:716–728 721

triangle showing texture class for both topsoil and subsoil
were silt loam texture class (Fig. 4a USDA classification sys-
tem). Moreover, sand content of soil for 20–40 cm layer was
generally higher than soil in the 0–20 cm (Fig. 4b).
3.3 Aggregate stability
Table 3 shows RF35 had the highest proportions of > 5 mm
aggregates, while FA had the lowest proportions in the 0–
20 cm layer. A significant difference between the soils of
farmland and replanted vegetation sites was also found for
2–5mm,2–1 mm, 0.5–1mm,and0.25–0.5 mm aggregates.
For the total percent aggregates (> 0.25 mm), replanted forest-
land had the highest values, followed by NG40. FA had the
lowest percent aggregates and was not significantly different
from NG20 and NG10. Aggregate stability in the 20–40 cm
soil layer was significantly lower than that of 0–20 layer, and
the difference of the sites was slight compared with the topsoil
(data not shown).
3.4 Saturated hydraulic conductivity
Figure 5 shows vegetation restoration soils had signifi-
cantly higher Ks than farmland in the topsoil, while the
differences were less f or the subsoil. Ks ranged from 13.8
(FA) to 27 mm h
−1
for (RS40) in the 0–20 cm layer and 7.2
(FA) to 12 mm h
−1
(RS30) in the 20–40 cm layer f or the ten
sites. Of all vegetation types, RS40 was significantly
higher than RS30 and RS15. No distinguishable differ-
ences were found for other vegetation types in the topsoil.
In the subsoil, there was no significant difference among
the restoration periods for the ea ch vegeta tion type.
Moreover, RF35, RF25 , and NG10 were not signi fic ant ly
different fro m f ar mla nd.
Table 2 Mechanical composition (%) for different vegetation recovery types
0–20 cm 20–40 cm
ID Sand (%) Silt (%) Clay (%) Sand (%) Silt (%) Clay (%)
(0.05–2mm) (0.002–0.05 mm) (< 0.002 mm) (0.05–2mm) (0.002–0.05 mm) (< 0.002 mm)
RF35 10.76 (0.90)cd 63.07 (1.05)abcd 26.17 (0.24) 12.61 (0.15)b 61.57 (0.01)cd 25.82 (0.14)
RF25 10.05 (0.16)d 64.05 (0.13)a 25.90 (0.28) 12.40 (0.02)bc 61.83 (0.03)bc 25.78 (0.05)
RS40 10.08 (0.53)d 63.24 (0.30)abc 26.68 (0.46) 11.88 (0.17)d 62.29 (0.09)ab 25.84 (0.14)
RS30 10.43 (0.25)cd 62.9 (0.11)abcd 26.67 (0.25) 12.54 (0.24)b 61.73 (0.15)cd 25.73 (0.28)
RS15 10.17 (0.19)d 63.39 (0.57)abc 26.44 (0.42) 12.06 (0.42)cd 62.07 (0.52)abc 25.88 (0.13)
NG40 10.04 (0.06)d 63.30 (0.45)abc 26.67 (0.50) 11.81 (0.39)d 62.03 (0.39)abc 26.16 (0.32)
NG30 10.16 (0.20)d 63.63 (0.24)ab 26.21 (0.10) 12.02 (0.23)cd 62.47 (0.42)a 25.52 (0.23)
NG20 11.59 (0.15)ab 62.34 (0.23)cd 26.07 (0.22) 11.91 (0.29)d 62.37 (0.02)a 25.72 (0.29)
NG10 11.19 (0.73)bc 62.59 (1.04)bcd 26.22 (0.70) 12.81 (0.11)ab 61.63 (0.20)cd 25.57 (0.32)
FA 12.3 (0.55)a 62.01 (0.99)d 25.69 (0.48) 13.25 (0.19)a 61.30 (0.36)d 25.45 (0.46)
Significance of ANOVA < 0.001 0.024 0.073 < 0.001 < 0.001 0.126
Mean values in the same column followed by the same letter are not significantly different at the 0.05 probability level (Duncan’s test)
Fig. 4 Soil texture triangle
showing the range of textures for
different vegetation recovery
types (1, sand; 2, loamy sand; 3,
silt; 4, sandy loam; 5, loam; 6, silt
loam; 7, sandy clay loam; 8, clay
loam; 9, silty clay loam; 10, sandy
clay; 11, silty clay; 12, clay)
722 J Soils Sediments (2019) 19:716–728

3.5 Correlation analysis of soil physical properties
BD showed a significant negative relationship to most mea-
sured soil physical properties (P < 0.01) (Table 4). Sand con-
tents were negatively related to most soil properties (except
for BD and MIP); however, silt were positively correlated
with most soil properties. Total aggregates were significantly
related to most soil physical properties except for soil porosity.
IP was significantly positively correlated with silt content.
MIP was significantly positive correlated with BD and sand
contents, while it was negatively correlated with most other
soil properties. MAP was just significantly positive correlated
with clay content and Ks. The Ks was negatively correlated
with BD and sand contents, while it was significantly posi-
tively related to other soil physical properties except for IP.
3.6 Effects of soil physical properties on saturated
hydraulic conductivity
A stepwise regression (forward) was performed to select the
optimal factors that influenced Ks. Results showed that when
BD (X
1
), MAP (X
2
), and > 0.25 mm aggregate stability (X
3
)
were included, the model had the highest efficiency. The re-
gression equation was expressed as:
Y ¼ −52:893X
1
þ 0:164X
2
þ 0:081X
3
þ 69:845 R
2
¼ 0:763; N ¼ 60; P < 0:001
ð9Þ
where Y is the saturated hydraulic conductivity.
Because of changes in MAP, > 0.25 mm aggregate stability
could also cause the changes in BD. Path coefficients were
conducted to determine the direct and indirect effects of the
soil physical properties on Ks. Figure 6 shows that BD had the
highest direct effects (− 0.84) on Ks, followed by MAP (0.43),
while the lowest was found in aggregate stability (0.38).
Moreover, the direct effect of BD on Ks was negative, while
it was positive for other factors. In terms of the indirect effects,
the high est indirect e ffect was exerted by MAP (− 0. 4 7) ,
followed by aggregate stability (− 0.38). They exerted influ-
ences on Ks via BD. Moreover, the indirect effect of MAP was
higher than its direct effects, which revealed the importance of
BD in Ks.
Table 3 Percent (%) of aggregates by size in the surface layer (0–20 cm) for different vegetation recovery types
ID > 5 mm 5–2mm 2–1mm 0.5–1mm 0.25–0.5 mm > 0.25 mm
RF35 15.08 (1.08)a 13.58 (0.18)ab 12.06 (0.80)b 10.59 (0.56)b 9.38 (1.01)b 60.68 (0.56)a
RF25 3.98 (2.51)b 9.38 (2.48)cd 16.61 (0.21)a 18.64 (3.97)a 15.56 (2.52)a 64.16 (1.72)a
RS40 13.42 (7.05)a 9.38 (1.81)cd 6.07 (1.09)c 4.98 (0.55)cde 5.53 (1.98)b 39.39 (11.13)c
RS30 12.70 (2.25)a 12.09 (3.11)abcd 6.93 (1.33)c 5.64 (1.56)cde 5.52 (2.08)b 42.88 (6.33)bc
RS15 13.19 (7.32)a 9.90 (1.09)bcd 6.75 (0.99)c 5.95 (0.92)cde 6.65 (2.80)b 42.45 (5.26)bc
NG40 11.18 (3.11)a 12.86 (1.88)abc 10.31 (2.67)b 8.19 (2.82)bc 6.71 (2.31)b 49.24 (6.54)b
NG30 11.68 (0.96)a 14.90 (3.83)a 5.62 (0.48)c 3.09 (0.64)e 8.13 (3.78)b 39.42 (5.11)c
NG20 9.35 (2.96)ab 11.39 (0.59)abcd 5.37 (0.77)c 3.11 (0.72)e 6.18 (0.12)b 35.40 (4.22)cd
NG10 4.45 (0.63)b 8.97 (0.52)d 6.91 (1.43)c 6.97 (1.73)cd 8.18 (1.48)b 35.49 (1.40)cd
FA 2.95 (0.81)b 9.10 (0.80)cd 6.09 (0.77)c 3.78 (1.52)de 5.98 (0.76)b 27.91 (0.83)d
Significance of ANOVA 0.003 0.011 < 0.001 < 0.001 < 0.001 < 0.001
Mean values in the same column followed by the same letter are not significantly different at the 0.05 probability level (Duncan’s test)
Fig. 5 Saturated hydraulic
conductivity of 0–20 cm and 20–
40 cm soil layer for all sample
plots. The same letter above the
point denotes they are not
significantly different at the 0.05
probability level (Duncan’stest)
J Soils Sediments (2019) 19:716–728 723

3.7 Linkages between vegetation restoration and soil
properties
Principal component analysis (PCA) revealed that the first two
principal components explained 65.8% (PC1 = 42.7%, PC2 =
23.1%) of the variance, indicating they could express most
information of the data structure. Figure 7a shows the scatter
plot for the study sites and the relationship between the soil
properties based on the first two principal components. The
sample plots could be divided into three categories. The first
category includes RS40, RS30, and NG40, which have high
clay contents, MAP, and Ks. However, BD, sand contents, IP,
and MIP of the first category were fairly low. RF35, RF25,
RS15, and NG30 belong to the second category. These sample
plots had higher aggregates stability, IP, MIP, and silt contents,
while they had r elatively lower MAP. The third category
covers FA, NG20, and NG10. This category had higher BD
and sand contents compared with others. In terms of the soil
physical quality index (S
Dexter
), all the sites were higher than
0.035, indicating the studied soil had relatively good quality
(Fig. 7b). For the sites, S
Dexter
of RS40 is the highest (0.112),
followed by RS30 (0.099) and NG40 (0.094). S
Dexter
of RS35
and FA were 0.052 and 0.043, respectively, and were signifi-
cantly lower than others.
4 Discussion
4.1 Changes in soil physical properties along with
vegetation restoration
A common perception is that vegetation restoration can de-
crease BD and increase the porosity, especially the CP (Celik
2005;Lietal.2007; Neris et al. 2012). In our study, the
highest BD and lowest porosity were found in farmland,
which was mainly credited to compaction from tillage and
harvest operations (Zhang et al. 2010). In contrasts, soils from
the re-vegetated areas had a lower BD and higher porosity.
This is partly due to the accumulation of organic matter in the
soils from the re-vegetated (Table 1, r = − 0.685, P <0.001).A
relatively higher organic matter in the farmland was mainly
the result of fertilization which produced a high rate of vege-
tation turnover (Wang et al. 2011).
Our results showed that the soil texture of all study sites did
not significantly change (Fig. 4), which implies the soil texture
was slow to transform in the Loess Plateau ( Li and Shao
2006). Although significant differences in sand, silt, and clay
were lacking, sands were generally lower with silt and clay
higher in the plots with longer years in vegetation. This would
indicate that vegetation protects the soil from erosion loss of
highly erodible finer particles. Aggregate stability plays an
Table 4 Correlation coefficient matrix (N = 60) of main soil physical properties in the vegetation recovery plots
BD Sand Silt Clay Aggregates IP MIP MAP Ks
BD 1
Sand 0.853** 1
Silt − 0.539** − 0.845** 1
Clay − 0.787** − 0.609** 0.089 1
Aggregates − 0.345** − 0.433** 0.368** 0.260* 1
IP 0.186 0.014 0.254* − 0.402** 0.084 1
MIP 0.365** 0.348** − 0.180 − 0.380** 0.091 − 0.441** 1
MAP − 0.443** − 0.356** 0.118 0.488** − 0.093 0.156 − 0.432** 1
Ks − 0.834** − 0.760** 0.445** 0.755** 0.830** − 0.251 − 0.323* 0.471** 1
BD bulk density, sand sand contents, silt silt content, clay clay content, Aggregates > 0.25 mm aggregate stability, IP inactive porosity, MIP micropo-
rosity , MAP macroporosity, Ks saturated hydraulic conductivity
*Significant at P ≤ 0.05
**significant at P ≤ 0.01
MAP
>0.25 mm
Aggregates
BD
Ks
-0.47
-0.38
0.38
-0.84
0.43
Fig. 6 Path diagram for the relationship between soil properties and
saturated hydraulic conductivity. The magnitudes of the numerical
values in the figure indicate the level of effects on saturated hydraulic
conductivity. MAP, macroporosity; BD, bulk density; Ks, saturated
hydraulic conductivity
724 J Soils Sediments (2019) 19:716–728

important role in anti-erodibility and stabilizing soil structure
(Bissonnais 1996;Erktanetal.2016; Van Hall et al. 2017).
Areas with vegetation restoration had higher aggregate stabil-
ity than farmland (Table 3), which indicates that farmland is
more vulnerable to erosion than soils from the revegetated.
The low aggregate stability of farmland was mainly because
of anthropogenic disturbance resulting from agriculture
(Cerdà 2000). MAP of replanted RS40, RS30, and NG40
were higher while IP and MIP were lower than others, indi-
cating they have better porosity (Fig. 2b–d). BD was signifi-
cantly related to most other soil parameters (Table 4); hence, it
could be used as an indicator of soil structure evolution. The
reductions in the BD of soils from the re-vegetated illustrated
the amelioration effects on soil structure.
Vegetation restoration increased Ks compared with farm-
land (Fig. 5). The higher Ks indicated that soils fro m the
revegetated had better soil permeability than farmland, which
is a cause for runoff reduction in the region (Gao et al. 2011).
Ks correlated with most of the studied soil physical parame-
ters, which demonstrated that Ks also could be used as an
indicator of soil structure change. The stepwise regression
showed that BD, MAP, and > 0.25 mm aggregates stability
were the principal soil physical parameters that affect the Ks.
Furthermore, the indirect effects of MAP via soil BD were
higher than its direct effects, implying the great effect of BD
on Ks (Fig. 6). Many studies in the literature show that there is
a significant exponential relationship between Ks and BD
(Jabro 1992), which is in accordance with our results
(y = 64.435e
−4.806x
, R
2
= 0.7007, P < 0.001) (Fig. 8a). With
the succession of vegetation, soil BD decreased while porosity
and aggregate stability increased. These changes in the soil
properties enhanced the soil water conductive capability.
MAP was more closely related to Ks than IP and MIP, and
acting as an input of Eq. 9. MAP could form macropore flow
in the soil, which was shown to be a main determinant for Ks
(Ahuja et al. 1984). Biological macropore (e.g., root channels)
hasgoodconnectivityandlargeporediameterthatisbetterfor
the flow processes in the soil (Lado et al. 2004; Ajayi and
Horn 2016). Additionally, the length of vegetation time affects
Ks. Wilson et al. (2005) found that soil matrix infiltration
rate was highest in the newly established (1 year) and the
oldest (> 15 years) revegetated areas, and biogenic surface
crust was the main reason. In our study, Ks increased along
with vegetation time for each vegetation type because there is
no biogenic surface crust for our soil samples.
On the other hand, organic matter accumulation in vegetat-
ed areas plays an important role in Ks increases. Bissonnais
and Arrouays (1997) used a rainfall simulator and found that
reduction of the organic carbon content of a loamy soil below
1.5 to 2.0% decreased the soil infiltration rate. A quadratic
function was identified by others between soil organic matter
and Ks (Celik 2005;LiandShao2006)aswellasthisstudy
(i.e., y = − 0.001 4x
2
+ 0.0481x +0.0183, R
2
= 0.6545, P <
0.001) (Fig. 8b). Increases in organic matter were positive-
ly correlated to aggregate formation, reduced BD, and de-
creased the susceptibility of the soil to seal formation
(Lado et al. 2004 ). Those functions were conducive to
the increases of Ks. However, the quadratic relation indi-
cated that the role of organic matter on Ks was not mono-
tonic. There was a threshold value for soil organic matter.
When soil organic matter to affect Ks lower than the
threshold, it played a positive role in Ks. Otherwise, the
role was adverse. The main reason is that soil organic mat-
ter h as retention effect on soil moisture (Van Hall et al.
S
Dexter
Site
d
cd
a
ab
bc
ab
abc
abc
abc
d
RF35 RF25 RS40 RS30 RS15 NG40 NG30 NG20 NG10 FA
0.00
0.04
0.08
0.12
0.16
0.20
(a) (b)
-1.5 -1.0 -0.5 0.0 0.5 1.0
-1.5 -1.0 -0.5 0.0 0.5 1.0
PC1
PC2
FA FA FA
NG20 NG20
NG10 NG10
BD
MIP
MAP
Sand
Silt
Clay
Aggregates
Ks
IP
RS40 RS40 RS40
RS30 RS30 RS30
RS15 NG40 NG40
RF35 RF35 RF35
RF25 RF25 RF25
RS15 RS15 NG40
NG30 NG30
Fig. 7 Results of principle component analysis (PCA) (a)andthesoil
physical quality index (S
Dexter
)(b) for different sample plots based on the
soil properties in 0–20 cm soil layer. BD, bulk density; Sand, sand
content; Clay, clay content; Silt, silt content; Ks, saturated hydraulic
conductivity; MAP, macroporosity; MIP, microporosity; IP, inactive
porosity; Aggregates, > 0.25 mm aggregates stability. The same letter
above the point denotes they are not significantly different at the 0.05
probability level (Duncan’stest)
J Soils Sediments (2019) 19:716–728 725

2017). If the retention effect is higher than the threshold,
the increases of soil organic matter would i mpede the in-
creases of Ks.
4.2 Effectiveness of vegetation restoration
in the Loess Plateau
Due to water shortage in the Loess Plateau, there are many
issues during vegetation restoration (Feng et al. 2012). Some
studies have found that a number of woody (e.g., Pinus
tabulaeformis, Platycladus orientalis) and shrub species
(e.g., Hippophae rhamnoide) grow well at the beginning,
but they often degrade once the initial water supply has been
exploited (Li 2000). Large-scale afforestation in the water-
limited arid and semiarid regions may increase the severity
of groundwater shortages. PCA analysis showed that RS40,
RS30, and NG40 were grouped together (Fig. 7a). They have
the best soil properties among the sites including low BD,
high MAP, and high Ks. However, RF35 and RF25 belong
to the second category (Fig. 7a), of which the soil properties
were of less quality, relative to RS40, RS30, and NG40. The
S
Dexter
showed similar result as PCA, i.e., RS40, RS30, and
NG40 had highest value while RF35 and FA had the lowest
(Fig. 7b). The findings indicated that the effectiveness of
replanted forest to ameliorate soil health was less than
replanted scrubland. Forest uses more soil water and form
drier soil layers (Li 2000), which leads to soil degradation.
We found that soil moisture of replanted forest was the highest
at 0–30 cm layer, while it sharply decreased thereafter (Fig. 9).
At depths lower than 100 cm, replanted forest had the lowest
soil moisture among the four land-use types (Fig. 9). The
results further indicated that forest consumed more soil water
than others, which was adverse to sustainability of vegetation
restoration. NG20, NG10, and FA were combined into the
same category, which implied that soil natural rehabilitation
of abandoned cropland needs a long time period. If the reha-
bilitation period is long enough (more than 40 years), the
secondary natural grassland could effectively improve soil
properties like the shrub (Fig. 7).
5 Conclusions
Vegetation restoration in the hilly-gully region of the Loess
Plateau, China had significant effects on soil physical proper-
ties and saturated hydraulic conductivity. The bulk density
decreased significantly, while aggregate stability increased
significantly during vegetation restoration. Change of soil po-
rosity was complex, which showed that inactive porosity and
microporosity was higher in replanted forest while
macroporosity was higher in replanted scrubland. Vegetation
restoration resulted in significant increases in soil saturated
hydraulic cond uctivity, but did not alter soil texture. Bulk
density, macroporosity, and > 0.25 mm aggregate stability
were the main soil physical parameters that influenced satu-
rated hydraulic conductivity. Bulk density and saturated hy-
draulic conductivity were strongly correlated with most mea-
sured so il physical properties. Hence, bulk density and
Fig. 8 Relationships between saturated hydraulic conductivity and bulk density (a) and soil organic matter (b)
Fig. 9 Average vertical soil moisture (%) distributions among different
land-use pattern (RF, replanted forest; RS, replanted scrubland; NG,
secondary nature grassland; FA, farmland)
726 J Soils Sediments (2019) 19:716–728

saturated hydraulic conductivity could be used as indicators to
evaluate the impact of vegetation restoration on soil proper-
ties. It is better to plant scrub or grassland than forest in the
study area for eco-environment rehabilitation. When selecting
the tree species for vegetation restoration on the Loess
Plateau, water conditions should be considered as a major
limiting factor.
Acknowledgments This work was supported by the National Natural
Science Foundation of China (41671285) and t he National Key
Research and Development Program of China (2016YFC0501707,
2016YFC0402401).
References
Ahuja L, Naney J, Green R, Nielsen D (1984) Macroporosity to charac-
terize spatial variability of hydraulic conductivity and effects of land
management. Soil Sci Soc Am J 48(4):699–702
Ajayi AE, Horn R (2016) Transformation of ex-arable land to permanent
grassland promotes pore rigidity and mechanical soil resilience. Ecol
Eng 94:592–598
Bartlett MS (1954) A note on the multiplying factors for various χ2
approximations. J R Stat Soc Ser B Methodol 16:296–298
Berger TW, Hager H (2000) Physical top soil properties in pure stands of
Norway spruce (Picea abies) and mixed species stands in Austria.
For Ecol Manag 136(1):159–172
Bissonnais YL (1996) Aggregate stability and assessment of soil
crustability and erodibility: I. Theory and methodology. Eur J Soil
Sci 47(4):425–437
Bissonnais YL, Arrouays D (1997) Aggregate stability and assessment of
soil crustability and erodibility: II. Application to humic loamy soils
with various organic carbon contents. Eur J Soil Sci 48(1):39–48
Celik I (2005) Land-use effects on organic matter and physical properties
of soil in a southern Mediterranean highland of Turkey. Soil Tillage
Res 83(2):270–277
Cerdà A (2000) Aggregate stability against water forces under different
climates on agriculture land and scrubland in southern Bolivia. Soil
Tillage Res 57(3):159–166
Chi CM, Wang ZC (2009) Effect of sand on saturated hydraulic conduc-
tivity and salts leaching of sodic soil. J Soil Water Conserv 23(01):
99–102 +116 (in Chinese)
Dexter AR (2004) Soil physical quality: part I. Theory, effects of soil
texture, density, and organic matter, and effects on root growth.
Geoderma 120(3):201–214
Erktan A, Cécillon L, Graf F, Roumet C, Legout C, Rey F (2016) Increase
in soil aggregate stability along a Mediterranean successional gradi-
ent in severely eroded gully bed ecosystems: combined effects of
soil, root traits and plant community characteristics. Pl ant Soil
398(1–2):121–137
Fang W, Peng SL (1997) Development of species diversity in the resto-
ration process of establishing a tropical man-made forest ecosystem
in China. For Ecol Manag 99(1):185–196
Feng X, Sun G, Fu B, Su C, Liu Y, Lamparski H (2012) Regional effects
of vegetation restoration on water yield across the Loess Plateau,
China. Hydrol Earth Syst Sci 16(8):2617–2628
Fu B, Wang J, Chen L, Qiu Y (2003) The effects of land use on soil
moisture variation in the Danangou catchment of the Loess
Plateau, China. Catena 54(1):197–213
Gao P, Mu XM, Wang F, Li R (2011) Changes in streamflow and sedi-
ment discharge and the response to human activities in the middle
reaches of the Yellow River. Hydrol Earth Syst Sci 15(1):1–10
Horton RE (1945) Erosional development of streams and their drainage
basins; hydrophysicalal approach to quantitative morphology. Geol
Soc Am Bull 56(3):275–370
Jabro J (1992) Estimation of saturated hydraulic conductivity of soils
from particle size distribution and bulk density data. Trans ASAE
35(2):557–560
Jia X, Shao M, Wei X, Horton R, Li X (2011) Estimating total net primary
productivity of managed grasslands by a state-space modeling ap-
proach in a small catchment on the Loess Plateau, China. Geoderma
160(3):281–291
Jiao F, Wen ZM, An SS (2011) Changes in soil properties across a
chronosequence of vegetation restoration on the Loess Plateau of
China. Catena 86(2):110–116
Lado M, Paz A, Ben-Hur M (2004) Organic matter and aggregate size
interactions in infiltration, seal formation, and soil loss. Soil Sci Soc
Am J 68(3):935–942
Li Y (2000) Effects of forest on water circle on the loess plateau. J Nat
Resour 16(5):427
–43
2 (in Chinese)
Li Y, Shao M (2006) Change of soil physical properties under long-term
natural vegetation restoration in the Loess Plateau of China. J Arid
Environ 64(1):77–96
Li X, He M, Duan Z, Xiao H, Jia X (2007) Recovery of topsoil physico-
chemical properties in revegetated sites in the sand-burial ecosys-
tems of the Tengger Desert, northern China. Geomorphology 88(3):
254–265
Li Z, Liu WZ, Zhang XC, Zheng F-L (2009) Impacts of land use change
and climate variability on hydrology in an agricultural catchment on
the Loess Plateau of China. J Hydrol 377(1):35–42
Li W, Yan M, Qingfeng Z, Zhikaun J (2012) Effects of vegetation resto-
ration on soil physical properties in the wind–water erosion region of
the northern Loess Plateau of China. Clean Soil Air Water 40(1):7–
15
Luxmoore R (1981) Comments and letters to the. Soil Sci Soc Am J 45:
671–673
McVicar TR, Li L, Van Niel TG, Zhang L, Li R, Yang Q, Zhang X, Mu X,
Wen Z, Liu W (2007) Developing a decision support tool for China's
re-vegetation program: simulating regional impacts of afforestation
on average annual streamflow in the Loess Plateau. For Ecol Manag
251(1):65–81
Mu X, Zhang X, Shao H, Gao P, Wang F, Jiao J, Zhu J (2012) Dynamic
changes of sediment discharge and the influencing factors in the
Yellow River, China, for the recent 90 years. Clean Soil Air Water
40(3):303–309
Neris J, Jiménez C, Fuentes J, Morillas G, Tejedor M (2012) Vegetation
and land-use effects on soil properties and water infiltration of
Andisols in Tenerife (Canary Islands, Spain). Catena 98:55–62
Reynolds W, Elrick D, Youngs E, Amoozegar A, Booltink H, Bouma J
(2002) 3.4 Saturated and field-saturated water flow parameters. In:
Dane JH, Topp GC (eds) Methods of soil analysis Part 4. Physical
methods. SSSA, Madison, pp 797–878
Shapiro SS, Wilk MB (1965) An analysis of variance test for normality
(complete samples). Biometrika 52(3–4):591–611
Stolte J, van Venrooij B, Zhang G, Trouwborst KO, Liu G, Ritsema CJ,
Hessel R (2003) Land-use induced spatial heterogeneity of soil hy-
draulic properties on the Loess Plateau in China. Catena 54(1):59–
75
Van Genuchten MT (1980) A closed-form equation for predicting the
hydraulic conductivity of unsaturated soils. Soil Sci Soc Am J
44(5):892–898
Van Hall R, Cammeraat L, Keesstra S, Zorn M (2017) Impact of second-
ary vegetation succession on soil quality in a humid Mediterranean
landscape. Catena 149:836–843
Wang H, Yang Z, Saito Y, Liu JP, Sun X, Wang Y (2007) Stepwise
decreases of the Huanghe (Yellow River) sediment load (1950–
2005): impacts of climate change and human activities. Glob
Planet Chang 57(3):331–354
J Soils Sediments (2019) 19:716–728 727

Wang Y, Fu B, Lü Y, Chen L (2011) Effects of vegetation restoration on
soil organic carbon sequestration at multiple scales in semi-arid
Loess Plateau, China. Catena 85(1):58–66
Wilson GV, Xu M, Chen Y, Liu G, Romkens MJM (2005) Macropore
flow and mass wasting of gullies in the Loess Plateau, China. Int J
Sediment Res 20(3):249
Xu M, Zhao Y, Liu G, Wilson GV (2006) Identification of soil quality
factors and indicators for the Loess Plateau of China. Soil Sc i
171(5):400–413
Zhang K, Dang H, Tan S, Wang Z, Zhang Q (2010) Vegetation commu-
nity and soil characteristics of abandoned agricultural land and pine
plantation i n the Qinling Mountains, China. For Ecol Manag
259(10):2036–2047
Zhang YW, Deng L, Yan WM, Shangguan ZP (2016) Interaction of soil
water storage dynamics and long-term natural vegetation succession
on the Loess Plateau, China. Catena 137:52–60
728 J Soils Sediments (2019) 19:716–728
