
What the world
thinks about work
UK
The
in
the
W RLD
VALUES
SURVEY
September 2023
DOI: 10.18742/pub01-143

The World Values Survey (WVS) is an international research programme devoted
to the study of people’s social, political, economic, religious and cultural values
around the world. Running since 1981, the WVS is the world’s largest and most
widely used social survey, with over 800,000 data downloads per year. The WVS
covers 120 countries represented across seven waves of data, with the most
recent wave – 7 – the largest wave yet.
The questionnaire has extensive coverage of a huge range of attitudes, beliefs and
values. The WVS also has a 50% overlap with the European Values Survey (EVS),
opening up comparisons with another five waves of European data.
In the UK, fieldwork was completed Mar-Sept 2022 by Ipsos, among a random
probability sample of 3,056 adults aged 18+. This included respondents in England
(1,645) and boost samples in Scotland (523), Wales (437) and Northern Ireland
(446). This means not only can we compare the UK against other countries around
the world, but also the four UK nations against each other. (See the technical
details section at the end of this report for more information on the UK sample and
international samples.)
How countries were selected for inclusion in this report
This is wave 7 of WVS, which included around 90 countries and ran from 2017 to
2022. This report focuses on comparison with a cross-section of 24 countries from
WVS wave 7 and EVS wave 5 (see table for fieldwork years).
Countries were initially shortlisted based on the availability of reliable and
accurately weighted data and then narrowed down, focusing on global coverage
(based on the UN's standardised country coding system), regional coverage and
population size. This selection gives coverage of 12 of the 17 UN M49 geographic
regions across 24 countries, representing almost 50% of the world's population
(source: World Bank).
Introduction
Latest data for the UK was collected in 2022. However, for analysis of trends over
time, data is for Great Britain due to a lack of available trend data from Northern
Ireland.
Questions with 10-point scale response options
For one question in this report, respondents were asked to give their answer on a
numerical scale between 1 and 10, with only these two points on the scale labelled.
For our analysis, following examination of the profile of responses and comparison
with similar questions from other studies that use fully labelled semantic scales, we
group the top three and bottom three response items together, with items 4–7
considered a middle group.
Countries included and latest years for which data is available
Australia (2018)
Japan (2019)
Brazil (2018)
Mexico (2018)
Canada (2020)
Morocco (2021)
China (2018)
Nigeria (2017/2018)
Egypt (2018)
Norway (2018)*
France (2018)*
Philippines (2019)
Germany (2017/2018)
Poland (2017/2018)
United Kingdom (2022)
+
Russia (2017)
Greece (2017)
South Korea (2017/2018)
Indonesia (2018)
Spain (2017/2018)*
Iran (2020)
Sweden (2017/2018)*
Italy (2018)*
United States (2017)
* European Values Survey (EVS) country; 50% question coverage.
+ UK used comparing WVS7 data; Great Britain used for analysis over time due to data availability.
2

Of 24 countries, the UK public are
least likely to say work is important in
their life and among the least likely to
say work should always come first,
even if it means less leisure time
1. How important is work and should it always come first?

People in the UK are least likely to say work is important in their life
73% of the UK public say work is
very or rather important in their life
– the lowest of 24 countries, though
on a par with Russia (74%) and
Canada (75%).
Other western nations such as Italy,
Spain, Sweden, France and Norway
all rank much higher than the UK on
this measure, with more than nine in
10 saying work is important in their
life.
For each of the statements below, please indicate how important it is in your life: Work
(% who say very/rather important)
4
UK base: 3,056 people in the UK aged 18+, surveyed 1 Mar–9 Sept 2022. Other countries all surveyed in
wave 7 of WVS at various points between 2017 and 2022. See WVSA website for sample information
73%
74%
75%
80%
81%
83%
84%
86%
87%
89%
90%
92%
92%
94%
94%
94%
96%
96%
96%
96%
96%
97%
99%
99%
United Kingdom
Russia
Canada
United States
Japan
Australia
Germany
South Korea
Egypt
China
Greece
Mexico
Norway
Poland
France
Sweden
Spain
Morocco
Italy
Brazil
Iran
Nigeria
Indonesia
Philippines
But this is not a new development: the share of the British public who say work is important in their life has
hardly changed in three decades
As in several other high-income
western nations, the proportion of
Britons who say work is very or
rather important in their life has
changed little since 1990. Back then,
76% felt this way, compared with
73% in 2022.
For each of the statements below, please indicate how important it is in your life: Work
(% who say very/rather important)
Great Britain
United States
Canada
Australia
Germany
0%
10%
20%
30%
40%
50%
60%
70%
80%
90%
100%
1990
1992
1994
1996
1998
2000
2002
2004
2006
2008
2010
2012
2014
2016
2018
2020
2022
Base: minimum of 1,000 people aged 18+ surveyed per country per year. See WVSA website for sample information
5

Work inevitably becomes less important to people as they age and leave the workforce
The importance of work has
declined significantly among Baby
Boomers and those born pre-1945
as they age and leave the labour
market, while younger generations
that still make up the workforce are
much more likely to view work as a
key part of their life.
For each of the statements below, please indicate how important it is in your life: Work
(% who say very/rather important by generation in Britain)
Gen Z
Millennials
Gen X
Baby
Boomers
Pre-War
0%
10%
20%
30%
40%
50%
60%
70%
80%
90%
100%
1990
1992
1994
1996
1998
2000
2002
2004
2006
2008
2010
2012
2014
2016
2018
2020
2022
Base: minimum of 130 people surveyed per generation per year
6

Only three nations are less likely than the UK to say work should always come first
22% of the UK public agree work
should always come first, even if it
means less spare time, with only
Australia (21%), Canada (19%) and
Japan (10%) less likely to hold this
view.
And within the UK, there is a notable
gender difference in responses, with
men (28%) more likely than women
(16%) to say work should always take
priority.
In some comparable countries, such
as Spain (45%) and France (39%), the
public are around twice as likely as
those in the UK to say work should
come first, while Italy (55%) and
Norway (56%) are even more likely to.
But Egypt (92%), Nigeria (83%) and
China (82%) come top for this view, in
line with other findings on the
perceived importance of work in
those countries.
How would you feel about the following statements? Do you agree or disagree with them?
Work should always come first, even if it means less spare time (% who strongly agree/agree)
7
UK base: 3,056 people in the UK aged 18+, surveyed 1 Mar–9 Sept 2022. Other countries all surveyed in
wave 7 of WVS at various points between 2017 and 2022. See WVSA website for sample information
10%
19%
21%
22%
28%
29%
33%
35%
37%
39%
45%
47%
50%
55%
55%
56%
61%
63%
66%
72%
79%
82%
83%
92%
Japan
Canada
Australia
United Kingdom
United States
Germany
Sweden
Russia
Poland
France
Spain
South Korea
Brazil
Italy
Iran
Norway
Morocco
Greece
Mexico
Philippines
Indonesia
China
Nigeria
Egypt

Britons’ views on whether work should always come first are largely unchanged since 1999
Between 1999 and 2022, the
proportion of the British public who
agreed work should always come
first, even if it means less spare
time, declined only slightly, from
26% to 22% – although agreement
rose as a high as 35% in 2009.
Canada has seen a starker decline,
with the share of the public saying
work should always come first more
than halving, from 44% to 19%,
between 2000 and 2020. Meanwhile,
the US and Australia have
experienced much smaller declines.
How would you feel about the following statements? Do you agree or disagree with them?
Work should always come first, even if it means less spare time (% who strongly agree/agree)
8
Great Britain
United States
Canada
Australia
Germany
0%
10%
20%
30%
40%
50%
60%
70%
1999
2000
2001
2002
2003
2004
2005
2006
2007
2008
2009
2010
2011
2012
2013
2014
2015
2016
2017
2018
2019
2020
2021
2022
Base: minimum of 1,000 people aged 18+ surveyed per country per year. See WVSA website for sample information

There are big generational differences in views on whether work should always come first
Most generations’ opinions on
whether work should always come
first have remained relatively
stable, but Millennials have become
much less likely to agree with this
view over time: in 2009, 41% felt this
way; by 2022, this had fallen to 14%.
Both Gen X (17%) and Gen Z (19%)
are similarly unlikely to think work
should be prioritised above all else,
while the Pre-War generation (43%)
stand out as by far the most
supportive of the view that work
should always take precedence.
How would you feel about the following statements? Do you agree or disagree with them? Work should always
come first, even if it means less spare time (% who strongly agree/agree by generation in Britain)
9
Gen Z
Millennials
Gen X
Baby Boomers
Pre-War
0%
10%
20%
30%
40%
50%
1999
2000
2001
2002
2003
2004
2005
2006
2007
2008
2009
2010
2011
2012
2013
2014
2015
2016
2017
2018
2019
2020
2021
2022
Base: minimum of 130 people surveyed per generation per year

The UK is among the most likely to say it would be a good thing if less importance were placed on work
43% of people in the UK say it would
be a good thing if less importance
were placed on work – virtually the
same as Spain (45%), Germany
(45%) and Indonesia (45%), where
slightly greater proportions agree
with this view, but far behind the
Philippines (61%), which comes top
on this measure.
At the other end of the table, just
6% of people in Egypt think it would
be a positive development if work
was seen as less important, while
Norway (21%) ranks bottom among
western nations for this view.
Below is a list of various changes in our way of life that might take place in the near future. For each one, if it
were to happen, please indicate whether you think it would be a good thing, a bad thing, or you don’t mind?
Less importance placed on work
10
UK base: 3,056 people in the UK aged 18+, surveyed 1 Mar–9 Sept 2022. Other countries all surveyed in
wave 7 of WVS at various points between 2017 and 2022. See WVSA website for sample information
6%
10%
16%
21%
25%
25%
26%
27%
27%
27%
28%
29%
34%
35%
38%
38%
40%
40%
41%
43%
45%
45%
45%
61%
3%
32%
7%
14%
14%
14%
4%
17%
18%
36%
17%
40%
23%
23%
17%
41%
16%
20%
41%
37%
13%
9%
9%
14%
88%
57%
77%
63%
61%
56%
70%
52%
48%
37%
50%
30%
40%
41%
45%
20%
40%
36%
18%
19%
39%
46%
42%
25%
Egypt
Japan
Iran
Norway
China
Greece
Morocco
Italy
Russia
South Korea
Poland
United States
Brazil
Mexico
Nigeria
Australia
Sweden
France
Canada
United Kingdom
Germany
Indonesia
Spain
Philippines
Good thing Don't mind Bad thing
United Kingdom

Compared with 40 years ago, people in Britain are now more likely to say it would be a good thing if less
importance were placed on work – a trend that can also be seen across other western nations
Between 1981 and 2022, the share
of the British public who said it
would be a good thing if less
importance were placed on work
rose from 26% to 43% (although this
view peaked in popularity in 1999).
This opinion has gradually become
more widespread in several other
western nations too. For example,
over a similar period, the
proportion holding this view rose
from 25% to 41% in Canada and
from 30% to 45% in Germany.
Below is a list of various changes in our way of life that might take place in the near future. For each one, if it
were to happen, please indicate whether you think it would be a good thing, a bad thing, or you don’t mind?
Less importance placed on work (% who say good thing)
Great
Britain
United States
Canada
Australia
Germany
0%
10%
20%
30%
40%
50%
60%
1981
1983
1985
1987
1989
1991
1993
1995
1997
1999
2001
2003
2005
2007
2009
2011
2013
2015
2017
2019
2021
1999 question wording asked if it would be a good or bad thing to ”make work less central in our lives”.
Base: minimum of 1,000 people aged 18+ surveyed per country per year. See WVSA website for sample information
11

In Britain, Millennials have become much more likely to say it would be good if less importance were placed on
work – but older generations previously underwent a similar shift in views
In 2022, 52% of Millennials said it
would be a good thing if less
importance were placed on work –
up from 31% in 2005.
But they are not alone in becoming
much more likely to feel this way. At
different stages, older generations
experienced a similar shift, before
then reverting back. For example,
between 1981 and 1999 the
proportion of Baby Boomers who
thought work should be treated as
less important more than doubled
from 25% to 56%, only to then fall
back to 34% by 2022.
And while other generations took
many years to become increasingly
convinced that we should focus less
on work, Gen Z – the youngest
cohort – have entered the data with
a majority (52%) feeling this way.
Below is a list of various changes in our way of life that might take place in the near future. For each one, if it
were to happen, please indicate whether you think it would be a good thing, a bad thing, or you don’t mind?
Less importance placed on work (% who say good thing by generation in Britain)
Gen Z
Millennials
Gen X
Baby Boomers
Pre-War
0%
10%
20%
30%
40%
50%
60%
1981
1983
1985
1987
1989
1991
1993
1995
1997
1999
2001
2003
2005
2007
2009
2011
2013
2015
2017
2019
2021
Base: minimum of 130 people surveyed per generation per year
12

By international standards, the UK is relatively less likely to agree that work is a duty towards society
60% of people in the UK say work is
a duty towards society, placing the
country on a par with several other
western nations – such as Australia
(61%), Spain (59%) and the US
(59%) – for agreement with this
view.
However, other peer countries,
including Norway (86%), Germany
(74%) and Sweden (71%), are all
more likely to consider work a duty.
How would you feel about the following statements? Do you agree or disagree with them?
Work is a duty towards society (% who strongly agree/agree)
13
UK base: 3,056 people in the UK aged 18+, surveyed 1 Mar–9 Sept 2022. Other countries all surveyed in
wave 7 of WVS at various points between 2017 and 2022. See WVSA website for sample information
47%
55%
56%
58%
59%
59%
60%
61%
61%
62%
68%
69%
70%
70%
71%
73%
74%
74%
83%
83%
86%
87%
90%
94%
Russia
Canada
Greece
Japan
Spain
United States
United Kingdom
Australia
Brazil
South Korea
Italy
Mexico
France
Morocco
Sweden
Poland
Germany
Indonesia
China
Iran
Norway
Philippines
Nigeria
Egypt

Britons are more likely to see work as a duty towards society than they were around two decades ago
When trends began in 1999, 49% of
Britons agreed work is a duty
towards society. By 2022, this had
risen to 59% – although this is down
on the 67% who felt this way as
recently as 2018.
Tr e n d s i n o t h e r c o u n t r i e s h av e
varied. In the US, views on this
question have remained largely
stable, while in Canada, people have
become less likely to see work as a
duty towards society: 55% held this
view in 2020, compared with 69% in
2006.
How would you feel about the following statements? Do you agree or disagree with them?
Work is a duty towards society (% who strongly agree/agree)
Great Britain
United States
Canada
Australia
Germany
0%
10%
20%
30%
40%
50%
60%
70%
80%
1999
2000
2001
2002
2003
2004
2005
2006
2007
2008
2009
2010
2011
2012
2013
2014
2015
2016
2017
2018
2019
2020
2021
2022
Base: minimum of 1,000 people aged 18+ surveyed per country per year. See WVSA website for sample information
14

The UK public are among the most likely to say leisure time is important in their life – though the majority of
countries place a similarly high value on this
93% of the UK public say leisure
time is very or rather important in
their life – only slightly lower than
Sweden and Norway, which come
top on this measure, with 96%
feeling this way.
The UK is not alone in valuing leisure
time a great deal: in the majority of
countries, around nine in 10 people
say it is important for them, and
there is little difference in views.
Egypt (55%), the Philippines (61%)
and China (71%) are the biggest
outliers, with far smaller shares of
the population reporting that leisure
time is important in their life.
For each of the statements below, please indicate how important it is in your life: Leisure time
(% who say very/rather important)
UK base: 3,056 people in the UK aged 18+, surveyed 1 Mar–9 Sept 2022. Other countries all surveyed in
wave 7 of WVS at various points between 2017 and 2022. See WVSA website for sample information
55%
61%
71%
77%
79%
82%
85%
85%
86%
89%
89%
91%
91%
91%
92%
92%
92%
93%
93%
93%
94%
95%
96%
96%
Egypt
Philippines
China
Indonesia
Morocco
Russia
Brazil
Mexico
France
Greece
United States
Italy
Japan
Spain
Germany
Iran
South Korea
Australia
Nigeria
United Kingdom
Poland
Canada
Norway
Sweden
15

Across Britain and other nations, there has been little change in the perceived importance of leisure time
The share of the British public who
say leisure time is important in their
life has risen only slightly in recent
decades, from 86% in 1990 to 93% in
2022.
Similar shifts can be seen in Canada
and Germany, while attitudes in the
US and Australia have remained
even more stable.
For each of the statements below, please indicate how important it is in your life: Leisure time
(% who say very/rather important)
Great Britain
United States
Canada
Australia
Germany
0%
10%
20%
30%
40%
50%
60%
70%
80%
90%
100%
1990
1992
1994
1996
1998
2000
2002
2004
2006
2008
2010
2012
2014
2016
2018
2020
2022
Base: minimum of 1,000 people aged 18+ surveyed per country per year. See WVSA website for sample information
16

The UK has one of the most favourable
views of people who don’t work: only
Sweden is less likely to say such
individuals turn lazy
2. What the world thinks of those who don’t work

Only Sweden is less likely than the UK to say people who don’t work turn lazy
40% of the UK public agree those
who don’t work turn lazy, with
Sweden (32%) the only nation
where people are less likely to
agree.
Yet there is a gender divide in the
UK, as men (48%) are considerably
more likely than women (32%) to
hold this opinion. Overall, however,
the UK has a more favourable view
of people who don’t work than
those in many peer countries, such
as Italy (70%) and Germany (55%),
where greater proportions think
such individuals turn lazy.
And there is a broad range of
opinion on this issue: at the top of
the table, nearly nine in 10 people in
Egypt (89%) and Nigeria (87%) have
this negative perception of those
not in work.
How would you feel about the following statements? Do you agree or disagree with them?
People who don’t work turn lazy (% who strongly agree/agree)
18
UK base: 3,056 people in the UK aged 18+, surveyed 1 Mar–9 Sept 2022. Other countries all surveyed in
wave 7 of WVS at various points between 2017 and 2022. See WVSA website for sample information
32%
40%
40%
44%
46%
48%
51%
51%
53%
54%
54%
55%
63%
65%
68%
70%
74%
76%
79%
81%
81%
83%
87%
89%
Sweden
United Kingdom
Canada
United States
France
Greece
Australia
Philippines
Indonesia
Norway
Spain
Germany
Russia
Japan
Brazil
Italy
South Korea
Mexico
Iran
Poland
Morocco
China
Nigeria
Egypt

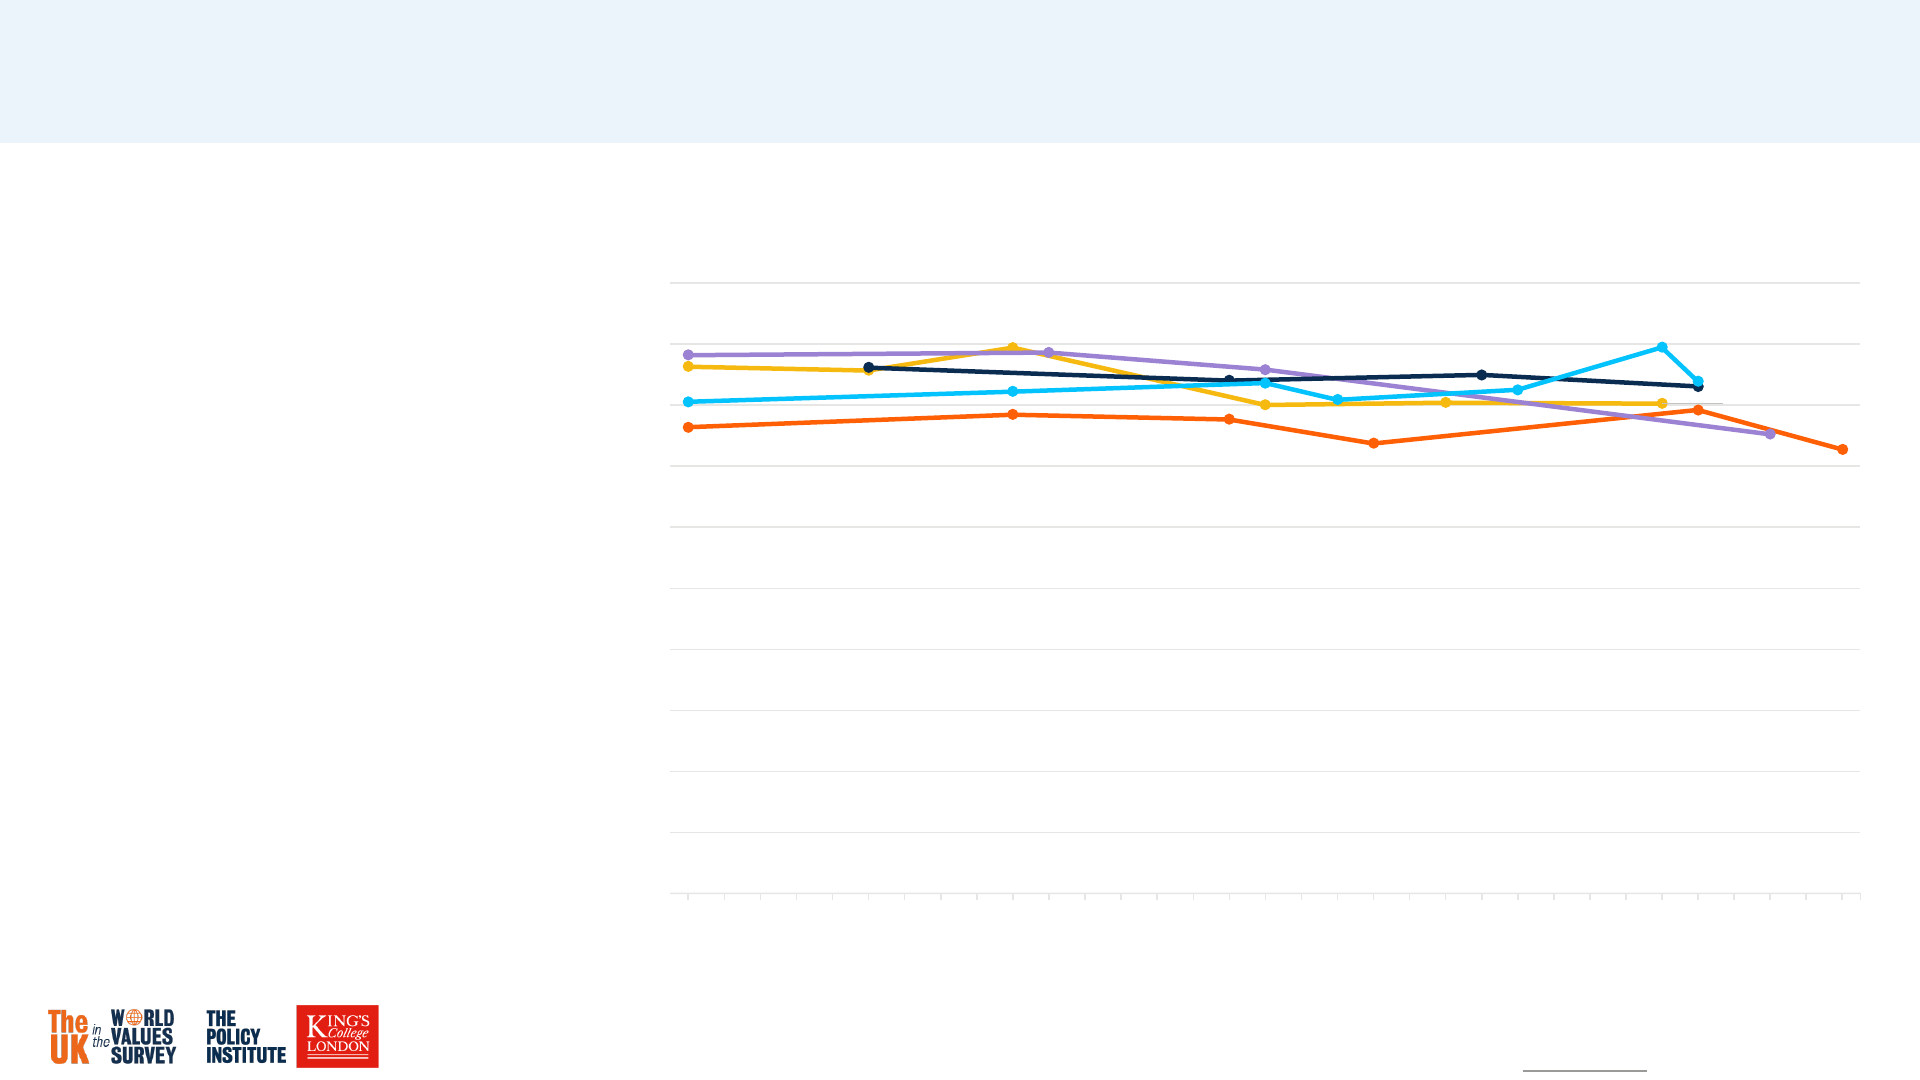
Britons’ perceptions of those who don’t work are roughly as negative as they were back in 1999
In 1999, 43% of Britons said those
who don’t work turn lazy – a figure
that was virtually the same in 2022,
at 40%. However, this is down on
2009, when agreement with this
view peaked at 54%.
In several other western nations,
people are less likely to hold this
opinion than they were in previous
decades. For example, in Canada,
the share of the public who agree
that those who don’t work turn lazy
fell from 53% to 40% between 2000
and 2020.
How would you feel about the following statements? Do you agree or disagree with them?
People who don’t work turn lazy (% who strongly agree/agree)
Great Britain
United States
Canada
Australia
Germany
0%
10%
20%
30%
40%
50%
60%
70%
1999
2000
2001
2002
2003
2004
2005
2006
2007
2008
2009
2010
2011
2012
2013
2014
2015
2016
2017
2018
2019
2020
2021
2022
Base: minimum of 1,000 people aged 18+ surveyed per country per year. See WVSA website for sample information
19

Other countries, such as the US, are
notably more likely than the UK to think
hard work leads to a better life, with the
UK public more inclined to think luck and
connections are equally important
3. Does hard work bring a better life?

The UK ranks relatively low for the belief that hard work usually brings a better life
39% of people in the UK lean
towards the view that, in the long
run, hard work usually brings a
better life – notably below the US,
where a majority of 55% hold this
opinion, but above Germany, where
28% feel this way.
Once again, Egypt (61%) and China
(58%) put a great deal of stock in
the importance of work, coming top
for this belief.
How would you place your views on each of these scales? 1 means you agree completely with the statement on
the left; 10 means you agree completely with the statement on the right; and if your views fall somewhere in
between, you can choose any number in between.
21
UK base: 3,056 people in the UK aged 18+, surveyed 1 Mar–9 Sept 2022. Other countries all surveyed in
wave 7 of WVS at various points between 2017 and 2022. See WVSA website for sample information
16%
27%
28%
29%
35%
36%
39%
44%
46%
47%
47%
51%
53%
54%
54%
55%
58%
61%
70%
51%
50%
53%
48%
43%
49%
27%
38%
38%
34%
23%
31%
28%
34%
34%
29%
17%
14%
22%
22%
13%
18%
19%
12%
27%
16%
15%
18%
26%
16%
18%
12%
11%
13%
21%
South Korea
Greece
Germany
Japan
Canada
Russia
United Kingdom
Brazil
Morocco
Australia
Mexico
Nigeria
Indonesia
Iran
Philippines
United States
China
Egypt
In the long run, hard work
usually brings a better life (1–3)
Both and work and luck are
equally important
for success (4–7)
Hard work doesn’t generally
bring success – it’s more a matter
of luck and connections (8–10)
United Kingdom

Britons increasingly see both hard work and luck as equally important for success
In 1990, 40% of Britons thought both
hard work and luck are equally
important for success – a figure
that had risen to 49% by 2022.
Over the same period, the share of
the public who felt luck and
connections are more important
than hard work has fallen from 21%
to 12%, while the proportion
believing that hard work brings a
better life has remained largely
unchanged.
How would you place your views on each of these scales? 1 means you agree completely with the statement on
the left; 10 means you agree completely with the statement on the right; and if your views fall somewhere in
between, you can choose any number in between. (Views in Britain)
22
Hard work brings a
better life (1–3)
Both hard work and luck
are equally important (4–7)
Luck and connections
are more important
than hard work (8–10)
0%
10%
20%
30%
40%
50%
1990
1992
1994
1996
1998
2000
2002
2004
2006
2008
2010
2012
2014
2016
2018
2020
2022
Base: minimum of 1,000 people aged 18+ surveyed in Great Britain per year. Don’t knows not shown. See WVSA website for sample information

7. Technical details

Ipsos interviewed a random probability sample of 3,056 adults aged 18+
across the UK. This included respondents in England (1,645) and boost
samples in Scotland (523), Wales (437) and Northern Ireland (446). Data has
been weighted by region, education and age interlocked with gender to be
nationally representative. Due to the Covid-19 pandemic respondents were
able to complete the survey either through a face-to-face survey (1,509
completes), an interviewer-led video interview through MS Teams (86), or
through either a self-completion paper survey (592) or an online push-to-web
follow-up (869). Fieldwork ran from 1 March to 9 September 2022. Ipsos is a
member of the British Polling Council and abides by its rules.
Further information on the sampling methodology for other countries
included in this report is available via the World Values Survey Association
website.
Technical details
Unweighted sample sizes for UK nations
England 1,645
Northern Ireland 446
Scotland 523
Wales 437
Region unknown 5
Total 3,056
24
Figures in this report may vary from those in the official WVS dataset
because of the exclusion/inclusion of non-responses, use of different
weighting, or different rounding procedures used by statistical software.
Data points for non-WVS years are taken from the European Values Survey,
with weights to compare samples provided by the World Values Survey
Association.
Years of birth for generations used in report
Gen Z 1996 onwards
Millennials 1980-1995)
Gen X 1966-1979)
Baby Boomers 1945-1965
Pre-War 1944 or earlier

@policyatkings kcl.ac.uk/policy-institute
For more information, contact:
Bobby Duffy
WVS Principal Investigator,
Professor of Public Policy and
Director of the Policy Institute,
King’s College London
bobby.duff[email protected]
@bobbyduffykings
UK
The
in
the
W RLD
VALUES
SURVEY
WVS team at the Policy Institute,
King’s College London:
Suzanne Hall
Director of Engagement
Kirstie Hewlett
Research Fellow
George May
Head of Communications
Zara Regan
Research Assistant
James Wright
Quantitative Research Assistant
Co-investigators:
David Halpern
Chief Executive of the Behavioural
Insights Team
Roger Mortimore
Professor of Public Opinion and
Political Analysis at King’s College
London
Antonio Silva
Head of Social Cohesion at the
behavioural Insights Team
David Voas
Professor of Social Science at the
UCL Social Research Institute
worldvaluessurvey.org
@WVS_Survey
