
1
MANUAL
MECHANICAL OPERATIONS LABORATORY
B.E. Chemical Engineering
Department of Chemical Engineering
BMSCE, Bengaluru
Authors
Dr. C T Puttaswamy, Professor
Y. K. Suneetha, Associate Professor
Department of Chemical Engineering, BMSCE
B.M.S. COLLEGE OF ENGINEERING
(Autonomous Institute, Affiliated to VTU)
BENGALURU – 19

2
Sl.
No.
Name of the Experiment
Page
No.
01
Jaw Crusher
03 – 06
02
I C I Sedimentation
07 –09
03
Batch Sedimentation
10 – 13
04
Plate & Frame Filter Press
14 –17
05
Air Permeability
18 – 20
06
Screen Effectiveness
21 - 25
07
Drop Weight Crusher
26 – 28
08
Air Elutriation
29 – 31
09
Beaker Decantation
32 – 34
10
Leaf Filter
35 – 38
CONTENTS

3
Experiment No: 1
JAW CRUSHER
Aim: - To determine the crushing law constants and to verify the laws by conducting
experiment on jaw crusher.
Apparatus: - Jaw crusher, sieve set, sieve shaker, weighing balance, brush, etc. .
Theory: - Crushers are slow speed machines for coarse reduction of large quantities of
solids. Coarse feed is used in jaw crusher. Jaw crusher crushes lumps and other hard
materials using compression force. In a jaw crusher feed is admitted between two jaws set to
from a ‘V’ open at the top. One jaw, the fixed or the anvil jaw is nearly vertical and does not
move. The other jaw swinging jaw reciprocates in a horizontal plane. It makes an angle of 20
0
to 30
0
to the anvil jaw. It is driven by an eccentric so that it applies great compression force to
lumps caught between the jaws. The jaw opening is 10mm at the bottom. There are two
types, namely Blake jaw crusher(swinging jaw pivoted at the top) and the Dodge jaw
crusher(swinging jaw pivoted at the bottom).
Following laws have been proposed to calculate the energy requirement in crushing,
1. Rittinger’s law: - E = K
R
(1/D
P
– 1/D
F
)
Where K
R
= Rittenger’s constant
D
P
= Diameter of the product
D
F
= Diameter of the feed.
Rittinger’s law is applicable mainly to that part of the process where new surface is being
created and holds most accurately for fine grinding where increase in surface per unit
mass of material is large. This law states that the work required in crushing is
proportional to the new surface created. K
R
value is usually determined by the drop
weight test
..
Rittinger’s law is best applicable to coarse and intermediate size reduction.
2. Kick’s Law: - E = K
K
ln(D
F
/D
P
)
K
K
= Kick’s Constant
D
P
=Diameter of the product
D
F
= Diameter of the feed
Kick’s law states that the energy necessary for crushing a material is same for the same
reduction ratio irrespective of original size. It means that required energy is proportional
to the logarithm of the ratio of feed size to product size. This is the limitation of this law
too. Kick’s law can be applied without much serious error to coarse crushing where the
feed size is quite large and the reduction ratio is quite low.
3. Bond’s Law: -
E = K
B
(1/D
P
–1/D
F
)
K
B
= Bond’s constant
D
P
= Diameter of the product
D
F
= Diameter of the feed .
4. Work Index: - Work index is denoted by W
I
. W
I
is defined as the gross energy in
kilowatt-hour per ton of feed needed to reduce a very large feed to such a size that 80% of
Work required to obtain a particle of size of D
P
from very large feed is proportional to the square –
root of surface to volume ratio of the product.

4
the product passes through a 100-micron screen and this definition leads to relation which
gives W
I
= √(100 x 10
-3
) K
B
= 0.3162 K
B
Procedure: -
1. About 1 kg of sample of approximately the same size and shape is taken.
2. The feed size is found by taking three representative stones by water displacement
method. Known volume (say 500 mL) of water is taken in a measuring cylinder and
stones are placed in it. The volume of displaced water is noted.
3. The time t
2
taken for 5 revolutions of the energy meter disc without load as (N
i
) is found.
4. The sample is fed one by one to the jaw crusher, the stopwatch is started simultaneously.
The time t
1,
and the number of revolutions (N) of the energy meter disc are recorded when
all the material is crushed.
5. Sampling for screen analysis: Representative product of about 500 g by cone and
quarter method is obtained. Crushed sample is mixed well and put together to form a
cone. The cone is divided into four equal parts (quarted) and two of them are considered.
Once again quartered and two of them are considered. or
Representative product of about 500 g by random sampling method is obtained.
Crushed sample is mixed well and about 500 g is taken randomly for analysis.
6. The sample product is transferred on to the top screen of the given sieve set and shaken
for about five minutes. The sample weights retained on each screen are recorded.
7. One more sample of 500 g is obtained from the remaining 1.5 kg and the step no. 6 is
repeated.
Fig: Jaw crusher
Energy meter constant =150 rev/kwh

5
Tabular column: Observations
Sl.
No.
Weight of sample
taken, W
Time required to crush the material
With load t
1,
s
Without load t
2,
s
for N
i
= 5
1
2
Tabular Column 2: Observations and calculations
Sl.
No.
Mesh
No.
(BSS)
Aperture
size
D
pi
Average
particle
size
(D
Pave
)
Weight of
material
retained, W
i
Weight fraction
w
i
=W
i
/ W
w
i
/(D
Pave
)
Cumulative
weight
fraction
(x
i
)
01
5
3
02
8
1.875
03
18
0.833
04
25
0.6
05
30
0.5
06
44
0.3409
07
85
0.1763
08
100
0.15
09
Pan
0.0
ΣW
i
= W
Σx
i
/dp
Tabular Column 3:
Sl.
No.
Mesh
No.
(BSS)
Aperture
size
Dp
i
Average
particle
size
(D
Pave
)
Weight of
material
retained W
i
Weight fraction
w
i
=W
i
/ W
w
i
/(D
Pave
)
Cumulative
weight fraction
(x
i
)
01
5
3
02
8
1.875
03
18
0.833
04
25
0.6
05
30
0.5
06
44
0.3409
07
85
0.1763
08
100
0.15
09
Pan
0.0
ΣW
i
= W
Σx
i
/dp
Specimen Calculations:
Feed particle diameter by volume displacement method
Note: Assuming that the particles are spherical in shape.
Volume of water displaced by three stones=3 times the volume of sphere
=3 x 4/3 π R
F
3
= - m
3
R
F
= mm
D
F
= mm
E = (1/m) [ N – N
i
(t
1
/t
2
)]/ ECF J/kg

6
m = mass of sample crushed in kg
ECF = 150 Rev/kw h
ECF = 150/1000*3600, rev/w s
= 150/1000*3600, rev/J=4.17*10
-5
rev/J
Unit of E becomes rev/rev kg/J = J/kg
D
p
from Analytical method:
D
P
= 1/ (w
i
/D
Pave
) (to be obtained from the table)
D
P
= Volume surface mean diameter.
D
P
from the graphical method :
Draw a graph of (1/D
Pave
) Vs Cumulative weight fraction (x
i
). The inverse of area under the
curve from 0-1 of x
i
gives the D
P
Cumulative weight
fraction (x
i
)
w
1
w
1
+ w
2
w
1
+w
2
+ w
3
weight
fraction
Kicks law: K
K
= E/ ln(D
F
/D
P
) J/kg
Rittingers law: K
R
= E/(1/D
P
–1/D
F
) J/kg mm
Bonds law:- Since the percentage of sample product passing through 100µm mesh is very
less, the Bonds is not verified.
W
I
for granite is 15.13 .
Verification of the laws: Find the ratios of law constants (K
R1
/K
R2
) and (K
K1
/K
K2
). The ratio
closure to One (1) represents the valid law.
Find the reduction ratio (D
F
/D
P
) for both the trials and check whether they are same or not.
If reduction ratio is same Kicks law is valid.
Result:-
I trial: Rittenger’s law constant K
R1
= __________
Kick’s law constant K
K1
= __________
Reduction ratio(D
F
/D
P
) is __________
II trial: Rittenger’s law constant K
R2
= __________
Kick’s law constant K
K2
= __________
Valid law for jaw crusher operation is__________
Reduction ratio(D
F
/D
P
) is __________
Note: State whether Rittenger’s or Kick’s law is valid.
Compare reduction ratio of two trials. If reduction ratio is same, report as “Kick’s law is
valid“.

7
Experiment No: 2
I.C.I SEDIMENTATION
Aim: To determine the particle size of given sample in sub-sieve range using ICI
sedimentation technique and also to plot the cumulative distribution curve.
Apparatus: ICI (Imperial Chemical Industries) setup, six graduated beakers (50ml),
stopwatch, weighing balance, measuring jar, hot air oven and six filter papers.
Theory: The particle size in the sub-sieve range can be determined by using several
techniques such as ICI sedimentation, Beaker decantation etc. These methods depend on fact
that terminal settling velocity of particle in a fluid increases with size.
Sedimentation methods are of two main types. In the first, the sample is abstracted from
selecting a suspension at a fixed horizontal level at an interval of time, each sample of
suspension with the exception of particles larger than a critical size, all of which will have
settled below level of sampling point. In the second, the particles settle on a immersed
sedimentation balance pan, which is continuously weighed. The largest particles will be
deposited preferentially and consequently the rate of increase of weight will fall off
progressively as particles settle out. Sedimentation methods must be carried out at
concentrations which are sufficiently low for interactive effects between particles to be
negligible so that their terminal falling velocities can be taken as equal to those of isolated
particles.
Procedure:
1. The terminal settling velocities using Stoke’s equation of different size of particles and
also the time of settling are calculated using height of settling. All the particles are
assumed to be present at the top surface initially.
2. Six number of filter papers are numbered, dried and then weighed.
3. Six graduated beakers of 50 mL capacity are taken and numbered.
4. 1g of sample is taken and the slurry is prepared with about 3ml of water.
5. The reservoir is filled with water up to the brim by keeping valve2 open while all other
valves are kept closed.
6. Valve 2 is closed and valve1 is opened. Water is added up to 18 cm.
7. The slurry is transferred to the sedimentation tube and made up to the mark to known
height by adding water.
8. Valve 4 is opened and air is blown gently into the sedimentation tube by opening valve1
till the slurry concentration becomes uniform.
9. Stopwatch is started and the particles are allowed to settle for calculated time.
10. About 20 mL of sample is collected by opening the valve3 carefully.
11. Water is added up to the mark and air is blown using valve 4 .

8
12. The procedure (steps 8, 9,10 and 11) is repeated to collect the particles of other size
samples at corresponding calculated time.
13. The collected samples are filtered and dried to know the mass of the particles.
Observations:
Density of the sample =
s,
= 2560 kg/m
3
Density of water =
w,
= 1000 kg/m
3
w
, = 0.98 x 10
-3
Ns/m
2
Acceleration due to gravity = g = 9.81 m/s
2
Height of setting = 27 cm
Particle Size: 120, 120/√2, 60, 60/√2, 30, 30/√2µm respectively
Table: Observations
Sl.
No.
Particle
size, D
p
µm
Terminal
velocity U
t,,
m/s
Time ,
s
Weight
retained W
i
,
g
Weight
fraction;
w
i
= W
i
/W
1.
120
2.
120/√2
3.
60
4.
60/√2
5.
30
6.
30/√2
∑W
i
=W
Table:Observations and calculations
Sl
No
Size
μm
Size Range
μm
Average Particle
Size – D
p avg
, μm
Cumulative
Wt fraction ,
x
i
1 - x
i
w
i
/ D
p avg
1.
120
240/√2- 120
(240/√2+120)/2
w
1
2.
120/√2
120 - 120/√2
(120 + 120/√2)2
w
1
+ w
2
3.
60
120/√2 – 60
w
1
+w
2
+ w
3

9
Sl
No
Size
μm
Size Range
μm
Average Particle
Size – D
p avg
, μm
Cumulative
Wt fraction ,
x
i
1 - x
i
w
i
/ D
p avg
1.
120
240/√2- 120
2.
120/√2
120 - 120/√2
3.
60
120/√2 – 60
4.
60/√2
60 - 60/√2
5.
30
60/√2 – 30
6.
30/√2
30 - 30/√2
∑ = 1
∑ =
1
∑ w
i
/ D
pavg
Specimen calculations:
1. Terminal settling velocity U
t
= [g D
p
2
(
s
-
w
)] / 18
w
= __________ m / s
2. Level/Height of the slurry in the sedimentation tube, H = __________m
3. Time = t = H / U
t
= __________ s
4. Volume surface mean diameter of sample, D
P
= 1/w
i
/D
p aveg
Graph: Draw the graph and find the area under the curve.
Inverse of area under the curve = Average particle size of the sample (X –axis range 0-1)
Variable on X-axis is cumulative weight fraction
Variable on Y-axis is 1/ D
p aveg,
D
p avg
of sample = 1/Area under the curve
Frequency distribution curves:
RESULT: The average particle size of the sample
1. Analytically: D
p, sample
2. Graphically : D
p,sample
3. Frequency distribution curves are plotted.

10
BATCH SEDIMENTATION
Aim: To determine the minimum cross sectional area of a continuous thickener required to
handle 150tons/day of dry solids from initial concentration of 4% to give an underflow
concentration of 50% by conducting a batch sedimentation test.
Apparatus: 1litre measuring cylinder, plastic beaker, stirrer, weighing balance, stop watch.
Sample Used: CaCO
3
(laboratory Grade)
Theory: In the operation of thickeners the basic assumption is that the material to be settled
consists of flocs sufficiently uniform in size and shape so that they settle at uniform velocities
under conditions of hindered settling in the initial stages. The process of settling is best
described by batch settling tests in glass cylinders.
Application of Batch Settling Test to Design a Continuous Thickener: The capacity of a
continuous thickener is determined by the fact that the solids initially present in the feed must
be able to settle through all zones of slurry concentration from that of the initial feed to that
of the underflow. If the area provided is not sufficient, the solids will build up through the
settling zone and into the classification zones until finally some solids are discharged in the
overflow. It was assumed that the settling rate was a function only of the solid concentration
expressed as volume of solids per unit volume of slurry. This method is based on the
mathematical analysis of batch settling presented by Kynch, which showed that the settling
rate and the concentration of the zone that limits capacity can be determined by from the
single batch settling test.
L
o
= Feed rate, m
3
/s
L
u
=
under flow rate, m
3
/s
C
o
= Slurry feed concentration, kg/ m
3
C
u
= under flow concentration, kg/ m
3
Experiment No: 3
11
Writing the material balance for solids/unit time: L
o
C
o
= L
u
C
u
L
u
= L
o
C
o
/Cu
Now writing the overflow liquid balance: L
o
(1-C
o
) – Lu (1-C
u
) = V
Where V is the overflow volume per unit time.
Substituting for L
u
: L
o
(1-C
o
) – L
o
C
o
/C
u
(1-C
u
) = L
o
C
o
(1/C
o
– 1/C
u
)
If the cross sectional area of the thickener is denoted by S, V/S = L
o
S
o
/S (1/C
o
– 1/C
u
)
The term V/S denotes the upward liquid velocity in the clarification zone of the thickener.
When the thickener is operated at capacity the lowest settling rate encountered must be equal
to or greater than this value, otherwise some solids will leave in the overflow.
Thus V/S is replaced by v.
L
o
C
o
= L
L
C
L
v = L
L
C
L
/S(1/C
L
– 1/C
u
)
S = L
L
C
L
/(v/(1/C
L
-1/C
u
))
Here C
L
L
L
= solids handling capacity, kg/s is given.
v = settling velocity which is calculated by batch sedimentation test. The minimum
value of v/[(1/ C
L
)-(1/ C
u
)] is used to calculate the thickener area.
Where C
L
= Limiting layer concentration, kg/m
3
Procedure:
1. Prepare 4 % CaCO
3
slurry in a measuring jar using one litre water and 40 g of CaCO
3
.
2. Keep the measuring jar against a bright background to see the interface clearly.
3. The slurry is stirred vertically for uniform concentration and the initial height of slurry Z
o
is noted down.
4. As soon as the agitation is stopped, the stop watch is started and the time is noted as solid
–liquid interface moves down by every 1cm.
5. After some height (about 15cm), the time is noted down for every half cm decrease in the
interface height.
6. The experiment is continued for about 1hour and till no more settling is observed.
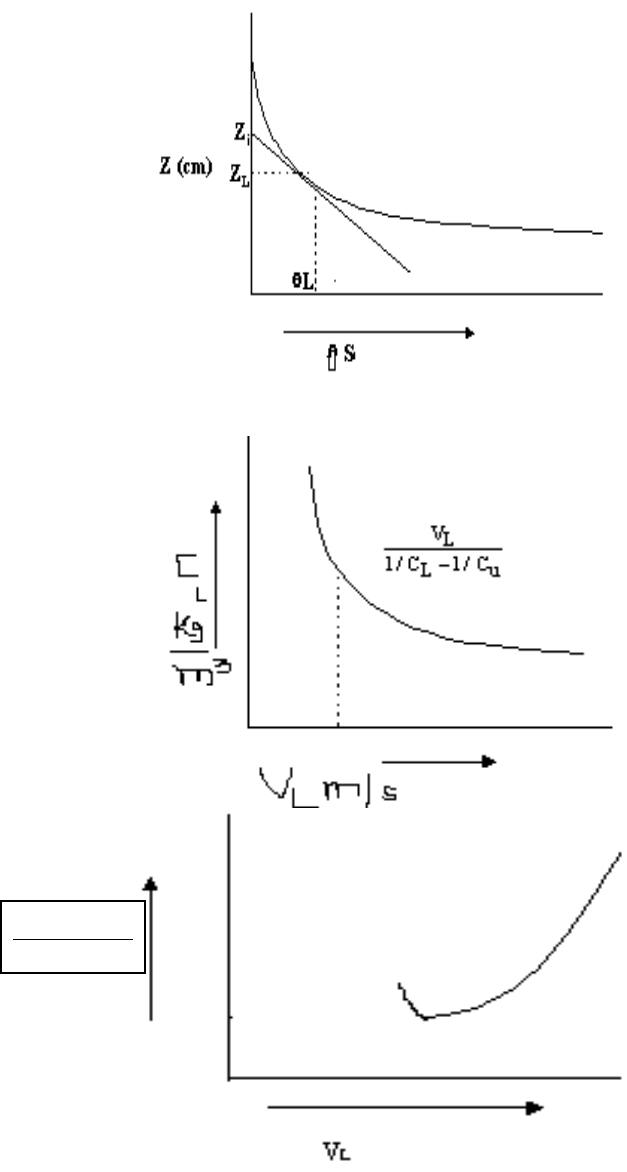
7. A graph of the interface Z vs. settling time is plotted.
8. 6 tangents are drawn and Z
i
, Z
L,
and
L
are noted.
9. C
L
Vs v
L
graph and as well as graph of v
L
/(1/C
L
- 1/C
U
) Vs v
L
are plotted.
10. Extra data of C
L
and v
L
from the second graph to get the shape of third graph (to confirm
the minimum value by increase in y-axis value) are obtained.
Observations & Calculations:
1. Initial height of the slurry ,Z
o
= __________cm
2. Density of CaCO
3
= 2560 kg/m
3

12
Table:Observations
Height of the interface
Z , cm
Time
, s
Specimen calculations:
Plot a graph of Z Vs .
Z
i
= point where tangent drawn from selected point at Z vs curve meets Y-axis.
L
= point where vertical line drawn from selected point curve meets X-axis.
Z
L
= point where horizontal line drawn from selected point curve meets Y-axis.
C
o
= initial concentration of slurry, kg/m
3
C
u
= underflow concentration of slurry, kg/ m
3
C
L
L
L
= (150*1000)/(24*3600) kg/s
1. Initial concentration of CaCO
3
= C
o
, kg/m
3
=
Sample wt./{(sample wt./ sample density)+( water wt./water density)},
Minimum cross sectional area of the thickener =
min
/1/1
min
uL
L
LLLL
CC
V
LC
Y
LC
S
Table 2:Observations
Sl. No
Z
L
m
Z
i
m
L
s
v
L
=( Z
i
-Z
L
)/
L
m/sec
C
L=
(Z
o
C
o
)/Z
i
kg/ m
3
Table 3: Calculations
Sl.
No.
v
L
m/s
C
L
kg/m
3
v
L
/[(1/ C
L
)-(1/C
u
)]
kg/m
2
s
Graphs: C
L
versus v
L
and
Versus v
L
V
L
1/C
L
- 1/C
U
13
Result: The area of thickener = _________m
2
V
L
1/C
L
- 1/C
U

14
Experiment No: 4
PLATE & FRAME FILTER PRESS
Aim: To determine the specific cake resistance (
) and filter medium resistance (R
m
) by
carrying out an experiment using plate & frame filter press with 4% by weight of CaCO
3
slurry.
Apparatus: Filter press, stopwatch, bucket, stirrer, weighing balance, two watch glasses.
Theory: Filtration is the removal of solid particles from a fluid by passing the fluid through a
filtering medium or septum on which the solids are deposited. Often the feed is modified by
pretreatment to increase the filtration rate as by heating, re-crystallization or adding a filter
aid such as cellulose or diatomaceous earth.
The process may be continuous or discontinuous depending upon whether the discharge of
filtered solids is steady or interrupted. In discontinuous filtration the flow of fluid through the
device is continuous, but it must be interrupted periodically to permit discharge of the
accumulated solids. In continuous filters the discharge of both solids and fluids is interrupted
as long as the equipment is in operation.
Plate & Frame Filter Press: the plate and frame filter press represents a more satisfactory
and more versatile type of filter. This press is made up of plates with very slightly raised
edges and hollow frames, assembled alternately. In assembling this press a filter cloth is
thrown over each plate but not over the frame. The filter cloth has holes that register with the
connections on the plates and frames, so that when the press is assembled these openings
form a continuous channel through the whole length of the press and register with the
corresponding connections on the fixed head. The channel shown opens only into the interior
of the frames and has no opening on the plates, and at the bottom of the plates holes are cored
that connect the faces of the plates to the outlet cock. As the material to be filtered is pumped
through the feed channel, it first fills all the frames. As the feed pump continues to supply
material and builds up pressure the filtrate passes through the cloth, runs down the face of the
plate and passes out through the discharge cock. When the press is filled it is opened and
dumped. In such a press the cake cannot be washed and therefore is discharged containing a
certain amount of the filtrate with whatever valuable or undesirable material it may contain.
Each plate discharges a visible stream of filtrate into the collecting launder and therefore if
any cloth breaks or runs cloudy, that plate can be shut off without spoiling the whole batch. If
the filtrate is hot or volatile or if for any other reason the open discharge is not desired a
channel like the feed channel can be supplied to take this discharge.
Constant Rate & Constant Pressure Filtration: If an initial high pressure is maintained,
the first particles caught will be compacted on to a tight mass that fills the pores of the cloth
and results in the low rate of filtration throughout the cycle. If the initial pressure is low, the
initial layer of precipitate will be more open. Rate of filtration will be higher and the cake can
be easily separated from the cloth. As time passes the cake resistance increases and the

15
pressure is increased until the maximum pressure is reached. As soon as the clothes are well
coated with cake and the filtrate is clear, the pressure is increased at constant pressure.
The filter medium resistance may vary with the pressure drop since the higher liquid velocity
caused by a large pressure drop may add particles of solids into the filter medium.
Procedure:
1. 4% CaCO
3
slurry by mixing 160 g CaCO
3
in 4litres of water is prepared in a bucket..
2. Two dry, empty watch glasses are weighed.
3. The compressor is switched on.
4. The filter clothes are wet, placed over the frame and tightened by means of ram.
5. Slurry is agitated for uniform concentration.
6. The drain valve is closed. The compressed air flow rate is adjusted till the pressure is
constant at 0.5 kg/cm
2
using the vent cock.
7. The slurry is transferred into the tank by opening the inlet valve and vent cock.
8. The initial level of filtrate (water) in filtrate receiver is noted. The slurry outlet valve is
opened to begin the filtration and the stopwatch is started simultaneously.
9. The time (cumulative) for the filtrate rise in the receiver for every 1cm is noted.
10. After the completion of filtration, a sample of cake is taken on the watch glass.
11. The wet cake is weighed, dried and weighed again to note the dry cake weight.
12. The above steps are repeated with an increased pressure of about 1.0 kg/cm
2
with fresh
slurry.
Observations:
1. Dimensions of the filtrate receiver(tank) = 13 x 10
-2
*13 x 10
-2
m
2
2. Diameter of the plate =d
2
= 12.5 x 10
-2
m.
3. Pressure applied, p = 0.5 kg/cm
2
x 9.81 x10
4
= 49.050 x 10
3
N/m
2
4. Viscosity of the filtrate μ = 0.98 x 10
-3
Ns/m
2
5. Density of sample = 2560 kg/m
3
6. Density of water (ρ) = 1000 kg/m
3
7. Initial concentration of CaCO
3
= C
s
, kg/m
3
=
8. Sample wt./{(sample wt./ sample density)+( water wt./water density)},
Table: Obervations
SL.
No.
Filtration
pressure drop,
p
(kg/cm
2
)
Weight of
watch
glass
W
1
(g)
Weight of
wet cake
+ watch
glass
W
2
(g)
Weight of
dry cake
+ watch
glass
W
3
(g)
Weight of
wet cake
(W
2
-W
1
)
m
f
(g)
Weight of
dry cake
(W
3
-W
1
)
m
c
(g)

16
Table: Observations and Calculations
Sl
No.
Filtrate
level
L (m)
Filtrate
volume
V , m
3
ΔV= V
2
-V
1
m
3
V
m
=V
1
+V
2
2
m
3
θ
s
Δθ=θ
2
-θ
1
s
Δθ/ΔV
s/m
3
0
0
0
Specimen Calculations:
1. Cross sectional area of the filtrate tank, Cylindrical A= 13 x 10
-2
*13 x 10
-2
m
2
2. Volume of the filtrate collected V = A x L= _____m
3
3. Cross sectional area of the plate = A
f
= πd
2
2
/4 = _____m
2
4. Weight of watch glass W
1
= _____g
5. Weight of wet cake + watch glass W
2
= _____g
6. Weight of wet cake (W
2
-W
1
)= m
f
= _____g
7. Weight of dry cake + watch glass W
3
= _____g
8. Weight of dry cake (W
3
-W
1
) =m
c
= _____g
9. Concentration of solids per unit volume of filtrate =
s
C
f
S
C
m
m
C
C
11
*
C* = _____kg/m
3
10. Specific cake resistance = =
*
**
2
C
pAK
fC
= _________ m/kg.
11. Filter medium resistance R
m
=
p*A*
f
= __________/m

17
Graph
Results from the graph: Filtration pressure = 0.5 kg/cm
2
k
c
= _________s/m
6
= __________s/m
3
For the pressure of 1.0 kg/cm
2
k
c
= _________s/m
6
= __________s/m
3
Results: Filtration pressure = 0.5 kg/cm
2
Specific cake resistance = _________m/kg
Filter medium resistance R
m
= __________/m.
For the pressure of 1.0 kg/cm
2
Specific cake resistance = _________m/kg
Filter medium resistance R
m
= __________/m.

18
Experiment No: 5
AIR PERMEABILITY
Aim: - To determine the specific surface area of the given sample by conducting an
experiment using air permeability technique.
Apparatus: - Stop watch, Measuring jar, Air permeability apparatus, Plunge, Beakers,
weighing balance and Granite Powder (sample).
Theory: -Air permeability methods depend on the fact that at low flow rates the flow through
a packed bed is directly proportional to the pressure difference the proportionality constant
being proportional to the square of the specific surface (Surface to volume ratio) of the
powder. From this method it is possible to obtain the diameter of the sphere with the same
specific surface area of the powder. The reliability of the method is dependent upon the care
with which the sample of powder is packed. The method is strictly only suitable for beds of
uniformly packed particle and it is not a suitable method for measuring the size distribution
of particle in the sub sieve range. In the apparatus air or another suitable gas flows through
the bed contained in a cell and the pressure drop across the bed and the flow rate of air
through the bed are obtained. If the diameters of the particle are below about 5 micron meter
then slip will occur and this must be allowed for. This method is successfully used for
measurement of surface area of cement, pigment, fine metal powders, pulverized coal and
fine fibers.
Kozeny Carmann equation is used for the flow of fluids through bed of solids.
S
W
2
=P
3
S
/ L*(1-)
2
* k V
s
2
Where S
w
= specific surface area of sample (m
2
/kg)
P = pressure drop across bed (N/m
2
)
L = Bed height (m)
= Porosity of the bed
= viscosity of air ( kg/m s)
V= velocity of air (m/s)
s
= density of particle (kg/m
3
)
s = Shape factor =1(for sphere)
k , the constant = 4.6
Procedure:
1. The tank is filled about 3/4
th
of the total height with water which is indicated by the level
indicator.
2. 6 g of the given sample is weighed and transferred into the sample holder. The graduated
plunger is used for leveling and to measure the height of the bed.
3. The system is checked for air tightness by opening the bottom valve and while the top air
valve is closed (no water should flow if the setup is air tight).

19
4. The tap at the bottom is opened so as to attain a certain flow rate. The manometer reading
is taken when the liquid levels in the two tubes become steady.
5. The volume of water collected for 60 s is noted down.
6. Similarly the volume of water collected for different flow rates for 60seconds are noted.
7. The above steps are repeated for 8 g of sample being taken in the sample holder.
Tabular Column
Table : Observations and Calculations (6g of the sample)
Sl.
No
Manometer
reading,
(cm)
H
m
Pressure
drop, P
(N/m
2
)
Water
volume
V,
m
3
Time
,
s
Superficial
velocity, v
(m/s)
Porosity
Specific
surface
area, S
w
(m
2
/kg)
LHS
RHS
R
m
Avg S
w
=-------- m
2
/kg
Table 2: Observations and Calculations (8g of sample)
Sl.
No
Manometer
reading,
(cm)
H
m
Pressure
drop, P
(N/m
2
)
Water
volume
V, m
3
Time,
s
Superficial
velocity, v
(m/s)
Porosity
Specific
surface
area, S
w
(m
2
/kg)
LHS
RHS
R
m
Avg S
w
= ---
m
2
/kg
Specimen calculation: -
1. Height of the bed, L = _____ m.
2. Diameter of the bed, d = 3.4 x 10
-2
m.
3. Cross sectional area of the bed, A
B
=
4
2
d
= _____m
2
4. Manometer reading, R
m
= _____m.
5. Pressure drop, P= g H = _____N/m
2
6. H = R
m
{(
m -
f
)/
f
} = m

20
7. Superficial velocity, v = V/A
d
= _____m/s
A
D
= Cross sectional area of drain pipe, m
2
=
π
D
2
/4
D = Diameter of the drain pipe = 6.35 mm
V= Volume of water collected in m
3
= Time of collection in seconds
8. Volume of the bed, V
B
= A
B
x L = _____m
3
9. Volume of particles,
s
p
takensampleofamount
V
= _____m
3
,
Where
s
is the density of the sample.
10. Porosity, = (V
B
- V
p
)/V
B
or {1/
B
– 1/
S
}/(1/
B
)
B
= Density of Bed.
B
= Mass of sample taken/A
B
* L
s
= 2660 kg/m
3
, Density of sample
11.
2/1
22
2/1
3
16.4
vL
P
Sw
s
= _____m
2
/kg
Viscosity of air=18.36 x 10
-6
N-s/m
2
Density of air =1.129 kg/m
3
Result:
The specific surface area of the particles of the 6g sample is found to be
S
w
= _____ m
2
/kg for porosity of ----
The specific surface area of the particles of the 8g sample is found to be
S
w
= _____ m
2
/kg for porosity of ----

21
Experiment No: 6
SCREEN EFFECTIVENESS
Aim: - To find the particle size distribution of a given sample and effectiveness of given
screen.
Apparatus: - Sieve shaker, sieve set, balance & weights.
Theory: - Screening is a method of separating particles according to size alone. In industrial
screening the solids are dropped on or thrown against, a screening surface. The undersize or
fines pass through the screen openings; oversize, or tails do not. A single screen can make but
a single separation in to two fractions. They are called unsized fractions, because although
either the upper or lower limit of the particle sizes they contain is known, the other limit is
unknown.
Comparison of ideal and actual screens: The objective of a screen is to accept a feed
containing a mixture of particles of various sizes and separates it into two fractions, as under
flow that is passed through the screen and an overflow that is rejected by the screen. Either
one or both of these streams may be a product and in the following discussion no distinction
is made between the over flow and under flow streams from the stand point of one’s being
desirable and other undesirable. An ideal screen would sharply separate the feed mixture in
such a way that the smallest particle in the overflow would be just larger than the largest
particle in the underflow. Such an ideal separation defines cut point diameter D
pc
which
marks the point of separation between the fractions, usually D
pc
is chosen to be equal to the
mesh opening of the screen.
Actual screens do not give a perfect separation about the cut point diameter instead the
cumulative screen analysis of the under flow and over flow are like those shown in figure
below. The closest separation is obtained with spherical particles on standard testing screens
but even here there is an overlap between the smallest particle in the overflow and largest
ones in the underflow. The overlap is especially pronounced when the particles are needle
like or fibrous or where the particles tend to aggregate into clusters that act as large particles.
Some long thin particles may strike the screen surface endwise and pass through easily while
other particles of the same size and shape may strike the screen sidewise and be retained.
Commercial screens usually give poorer separation than testing screens of the same mesh
opening operating on the same mixture.

22
Mesh Opening (mm) – x axis
Cumulative mass fraction (range: 0-1)larger than D
p
Material balance over the screen: The equations are useful in calculating the ratio of feed,
over size, and under size from the screen analysis of the three streams and knowledge of the
Let F= mass flow rate of feed
D=mass flow rate of over flow
B= mass flow rate of under flow
x
F
= mass fraction of material A in feed
x
D
= mass fraction of material A in overflow
x
B
= mass fraction of material A in underflow
The mass fraction of material B in the feed, overflow and underflow are, 1- x
F
, 1-x
D
,
& 1- x
B
.
Since the total material feed to the screen must leave either as underflow or overflow.
F = D + B …i
The material A in the feed must also leave in those two streams and
____
F x
F
= D x
D
+B x
B
…ii
Elimination of B from equation 1 and 2 gives:
D/F = (x
F
– x
B
)/ (x
D
–x
B
) …iii
Elimination of D gives: B/F = (x
D
–x
F
) /(x
D
– x
B
) …iv
The screen effectiveness or efficiency of a screen is a measure of the success of a screen in
closely separating materials A and B. If the screen functioned perfectly all of materials A
would be in the over flow and all of material B would be in the under flow. A common
measure of screen effectiveness is the ratio of oversize material A that is actually in the over
flow to the amount of A entering with the feed. These quantities are D x
D
and F
XF
respectively thus: E
A
= (D
XD
)/(F
XF
) ….v
Where E
A
is the screen effectiveness based on the oversize. Similarly E
B
is the screen
effectiveness based on the undersize material is given by:
E
B
= B (1-x
B
)/F (1-x
F
) …vi
A combined effectiveness can be defined as the product of the two individual ratios. If this
product is denoted E,
E = E
A
* E
B
E = D B x
D
(1-x
B
)/F
2
x
F
(1-x
F
) ….vii

23
Substituting D/F and B/F equations and into the above equation vii gives
E = (x
F
- x
B
) (x
D
- x
F
) x
D
(1-x
B
)/( x
D
- x
B
)
2
(1-x
F
) x
F
….viii
Procedure:
Sampling for screen analysis: Representative product of about 300 g by cone and
quarter method is obtained. Given sample is mixed well and put together to form a
cone. The cone is divided into four equal parts and two of them are considered. Once
again quartered and two of them are considered. This quartering procedure is repeated to
obtain about 300g. OR
Representative product of about 300g is obtained by random sampling method.
Crushed sample is mixed well and about 300g is taken randomly for analysis.
1. 300g of sample is weighed.
2. The sieve set is arranged such that the largest mesh number is at the bottom and lowest
mesh number is at the top.
3. The sample is transferred on to the top mesh and closed with lid.
4. Feed analysis: The sieve set is shaken in a sieve shaker (gyratory or rotap) for 5minutes
and the weights retained in each mesh are found.
5. Separation of the sample as oversize and undersize: The same sample is taken in a
particular mesh number (say 100) of which the effectiveness is to be determined. The
sieve is shaken manually or using the mechanical shaker for about 5 minutes and the
weight retained on the mesh are noted as oversize and the material screened through the
mesh as under size.
6. Over size and the under size analysis: Oversize and undersize material is screened
separately. Oversize and undersize material is screened using specified set of sieves for 5
minutes in a sieve shaker. The weights retained in each mesh are recorded for both
oversize and undersize.
Graph:
Mesh opening D
P
: x-axis
Cumulative mass fraction (Range: 0-1) smaller than D
P
: y- axis
Specimen calculations: E = (x
F
–x
B
) (x
D
– x
F
) x
D
(1-x
B
) / (x
D
–x
B
)
2
(1-x
F
) x
F
Where x
F
=Cumulative mass fraction of the feed
x
D
= Cumulative mass fraction of over size.
x
B
= Cumulative mass fraction of under size.

24
Table: Observations and calculations of feed analysis
Sl.
No
Mesh.
No
(BSS)
Aperture
Size D
pi
mm
Weight/Mass
Retained in g,
W
i
Weight/Mass
Fraction
= W
i
/W
Cumulative
Weight/Mass
Fraction larger
than D
Pi
(x
i
)
Cumulative
weight
fraction
smaller
than D
Pi
1-x
i
01
25
0.6
w
1
02
44
0.351
w
1
+ w
2
03
60
0.251
w
1
+w
2
+ w
3
04
100
0.151
05
150
0.104
06
170
0.089
07
200
0.076
08
Pan
0.0
∑ W
i
= W
Table: Observations and calculations of oversize analysis
Sl. No
Mesh. No
(BSS)
Aperture
Size D
pi
mm
Weight
Retained, g
W
i
Weight/Mass
Fraction
= Wi/W
Cumulative
Weight/Mass
Fraction larger
than D
Pi
(x
i
)
Cumulative
weight
fraction
smaller
than D
Pi
1-x
i
01
18
0.842
w
1
02
25
0.6
w
1
+ w
2
03
52
0.296
w
1
+w
2
+ w
3
04
72
0.211
05
100
0.152
06
120
0.124
07
170
0.089
08
Pan
0.0
∑ W
i
= W
Table: Observations and Calculations of undersize analysis
Sl.
No
Mesh. No
(BSS)
Aperture
Size D
pi
mm
Weight
Retained , g
W
i
Weight/Mass
Fraction
= Wi/W
Cumulative
Weight/Mass
Fraction larger
than D
Pi
(x
i
)
Cumulative
weight
fraction
smaller
than D
Pi
1-x
i
01
72
0.211
w
1
02
85
0.178
w
1
+ w
2
03
100
0.152
w
1
+w
2
+ w
3
04
120
0.124
05
150
0.104
06
170
0.089
07
200
0.076
08
Pan
0.0
∑ W
i
= W
Result: The efficiency or effectiveness of the given screen (Mesh No. =100)
is:____________

25
Experiment No: 7
DROP WEIGHT CRUSHER
Aim: - To determine the Rittinger’s law constant Kr & Kick’s law constant K
K
by carrying
out crushing operation in a drop weight crusher and to verify the laws of crushing.
Apparatus: - Drop weight crusher, sieve set, weighing balance, and screen shaker.
Theory: - The crushing operation is carried out to effect the size reduction. During size
reduction new surface area is created. Since a unit area of a solid has a definite amount of
surface energy the creation of new surface requires work to be done which is supplied by the
release of energy when the particles break. The basic law of crushing and its energy is given
as dE/dL = -CL
P
….(.i)
Where L is the size of the particle .By giving 3 different values to P we get 3 different laws.
When P= - 2 , Rittinger’s law results
E = P/W = K
R
[1/D
P
–1/D
F
] ….(ii)
P= power required.
W = Mass of materials crushed.
Where K
R
=Rittinger’s law constant
D
P
=product size. m
D
F
=feed size. m
E = energy required, J,Where P= -1 we get Kick’s law i.e.
E = P/W = K
K
[ln D
F
/ D
P
]
Where K
K
=Kick’s law constant
When P = -3/2, Bond’s law constant can be obtained
E = P/W = K
B
(1/Dp – 1/D
F
) ..(iii)
K
B
= Bond’s law constant.
Work Index: -It is the energy required for material to crush from a very large size feed to a
product such that 80% passes through a 100 micron mesh. We have work index
W
I
= K
B
100 x10
-3
kW h/t
Energy required E =m g h n ….(iv)
m = mass of bob
h = height through which bob has fallen
n = number of times the bob has fallen down
g = acceleration due to gravity

26
Procedure: -
1. The feed sample is prepared by screening sample through 8 and 10 mesh. Collect the
sample, which is retained on 10 mesh and passes through 8 mesh.
2. About 70 g of this sample is weighed and placed in a crushing zone in a drop weight
crusher.
3. Bob (weight) is dropped from a known height about 40times. The product is mixed using
spatula after every 5 drops for uniform mixing.
4. Sample after the crushing is subjected to screen analysis and weight retained on each
mesh is noted. From the data, average size of product is determined.
5. The experiment is repeated for the same product about 20 more drops. (total 30 + 20 = 50
drops)
6. The weight of the bob is noted.
7. The height through which the bob has fallen is noted.
8. Using the data, energy and the law constants are determined.
Data:
Weight of crusher = 1 kg
Weight of Feed = 70 g
Height of fall = 1 m
Size of feed = 1.854 mm
Table: 1
Sl.
No.
Mesh No.
BSS
Aperture
Size
D
pi
mm
Average
aperture size
D
pi
,mm
Weight retained (W
i
)
40 drops
80 drops
01
8
2.032
02
10
1.676
02
18
0.833
03
25
0.592
04
44
0.351
05
72
0.211
06
100
0.151
07
120
0.124
08
150
0.104
09
Pan
0.0
∑W
i
= W
∑W
i
= W

27
Table 2:Calculations
Weight fraction
w
i
= W
i
/W
Cumulative weight fraction, x
i
w
i
/ D
Pi ave
40
80
40
80
40
80
(w
i
/D
Pi ave
)
(w
i
/D
Pi ave
)
Specimen Calculations:
E =m g h n/ W = _________ J/kg
Mass of the bob (weight), m = ______ kg
Height of the column from where the bob is dropped, h = _________m
Weight of the sample taken (Run-1), n = 40 = _________ g
Weight of the sample taken (Run-2), n = 80 = _________ g
Feed size, D
F
= - 8 # + 10 # {(2.032+1.676)/2 = 1.854 = 1.854 mm
Where g = acceleration due to gravity = 9.81 m/s
2
Cumulative weight
fraction, x
i
w
1
w
1
+ w
2
w
1
+w
2
+ w
3
Volume surface mean diameter of the sample, D
p
= 1 / (w
i
/D
Pi ave
)
Rittinger’s law: E = K
R
[1/D
P
–1/D
F
] = ___________ J/kg.
So, K
R
= E/[1/D
P
–1/D
F
] J m /kg.
Kick’s law: E = K
K
ln [D
F
/ D
P
] = ___________ J/kg
So, K
K
= E/ ln[D
F
/ D
P
] = J/kg
Verification of the laws : Find the ratios of law constants (K
R1
/ K
R2
) and (K
K1
/K
K2
). The
ratio closure to one represents the valid law.
28
Result: - For n=50
K
R
=Rittinger’s law constant for, = ____________ J m /kg
K
K
=Kick’s law constant for, = ____________J/kg
For n=70
K
R
= Rittinger’s law constant for, = ____________ J m /kg
K
K
=Kick’s law constant for, = ____________J/kg
The valid law for drop weight crusher =
Reduction ratios are =

29
Experiment No: 8
AIR ELUTRIATION
Aim: - To determine the average particle size differentially and cumulatively and frequency
distribution curves.
Apparatus: Elutriator setup, weighing balance, sample collecting bottles.
Sample Used: Granite powder
Theory: - Materials can be separated by means of an elutriator, which consists of a vertical
tube in which fluid is passed at a controlled velocity. The particles are introduced through a
side tube for continuous operations or sample holder is attached for batch operations. The
smaller particles are carried over in the fluid stream while the larger particles settle against
the upward current. Further sized fractions can be corrected if the over flow from the first
tube is passed vertically upwards through a second tube of the greater cross section. Any
number of such tubes can be arranged in series. Other fractions can also be collected by
changing the fluid velocity with the same set up.
Cyclones are used primarily for the separation of solids from fluids and utilize the centrifugal
force to effect the separation. Such a separation depends not only on the particle size but also
on the particle density so that the cyclones may be used to effect a separation on the basis of
particle size or particle density or both.
The apparatus consists of a short vertical cylinder closed by a flat or dished plate on top and
by a conical bottom. The air with its load of solid is introduced tangentially at the top of the
cylindrical portion. Centrifugal force throws the solid particles out against the wall and they
drop into the hopper. Terminal velocity is given by
U
t
= g D
P
2
(
s
-
air
) m/s
18
Where D
p
= diameter of the particle in m
= Density of the sample, kg/m
3
air
= Density of elutriating air, kg/m
3
. = Viscosity of air, Ns/m
2
Procedure: -
1. The density of air at room temperature is determined using ideal gas law and viscosity of
air is found from Chemical Engineer’s handbook Perry.
2. Using Stoke’s equation the terminal settling velocities of different ranges of particles are
determined and the corresponding manometer readings to be maintained are noted down
from the given calibration chart.

30
Assumption: Sizes greater than 1μm are to be assumed. Since this method should not be
used for sub sieve range. The size range with the difference of square root of 2 starting
from 60μm to 240 μm.
3. Exactly 2g of the sample is weighed and put into the sample holder.
4. The flow rate of air is adjusted using manometer and maintained constant for about 5
minutes so that all particles between say 302-60μ size are elutriated.
5. The fraction of the sample in the previously weighed bottle is collected from the cyclone
separator.
6. The collected sample is weighed.
7. The procedure is repeated for different flow rates so that all particles between the next
size fractions are elutriated into different bottles.
Experimental set up:
Observations:
1. Ambient temperature = __________
0
C
2. Density of air at ambient temperature,
air
= __________kg/m
3
Density of
air
= PM/RT
P = Atmospheric pressure = 1.0133 x 10
5
N/m
2
M = Molecular weight of air = 29
R = Gas constant = 8314 J/ k mol, k
T = Ambient temperature in, k
3. Viscosity of air at ambient temperature, = __________Ns/m
2
(Approximately = 18 x 10
-6
N s/m
2
)
4. Density of granite sample,
s
= 2660 kg/m
3
5. Diameter of Elutriator tube, D
e
= 2.8 cm
Table 1:
Sl.
No
Particle size,
D
p
(μm)
Terminal settling
velocity, U
t
m/s
Flow rate,
Q = U
t
/{A
e
)
m
3
/s
Manometer
reading, R
m
,cm
01
30
02
302
03
60
04
602
05
120
06
1202

31
Table 2:Calculations
Sl.
No
Size range
()
Average
size
(D
Pave
)
()
Weight
Retained,
g , W
i
Weight
fraction
w
i
=
W
i
/W
w
i
/ (D
Pave
)
Cumulative
Wt fraction
(x
i
), larger
than D
P
Cumulative
Wt fraction
(1- x
i
),
smaller
than D
P
01
152-30
w
1
1.0
02
30-302
w
1
+ w
2
03
302-60
w
1
+w
2
+ w
3
04
60-602
05
602-120
06
120-
1202
1.0
0.0
W
i
=W
w
i
/(D
pave
)
Specimen Calculations:
1. U
t
= g D
p
2
(ρ
s
- ρ
air
)/18μ = __________m/s
2. Area, A
e
= πD
e
2
/4 = __________m
2
3. Volumetric flow rate of air through elutriator tube, Q= U
t
*A = __________m
3
/s
4. Average sample size, D
p
Sample
= 1/ w
i
/D
p
The average sample size by cumulative analysis :
Graph: Draw the graph of 1/D
p ave
Vs x
i
and find the area under the curve.
Sample D
p avg
= 1/area under the curve
Y- Axis range 0-1
To plot frequency distribution curve using mass fraction and particle size
Result: - The average size of the sample:
Differentially
Cumulatively
Experiment No: 9
BEAKER DECANTATION
32
Aim: To determine the average particle size of the given powdered sample by beaker
decantation method and also to plot the particle size distribution curves.
Sample used: CaCO
3
(commercial grade).
Apparatus: 6 (1liter capacity) beakers, stopwatch, 6 filter papers, 6 funnels, stirrer, weighing
balance etc.
Theory: When size separations are to be carried out on particles too small to screen
effectively(less than 50μm) or where very large tonnages are to be handled, methods
involving the differences in the rates of settling of particles of different sizes and of different
materials are used. For example two particles of different settling rates in water are placed in
an upward flowing water stream. If the velocity of the water is adjusted so that it lies between
the settling rate of two particles, the slower particle will be carried upward, the faster particle
will move downward against the water stream and separation is thereby attained.
Another method would be to send a slow stream of water horizontally through a tank of
water. If the two particles are carried into the box by the entering water, they will both start to
settle. Each will be carried horizontally at substantially the same rate, but the faster settling
particle will reach the bottom of the tank before the slower settling particle and will be found
nearer the entrance end of the tank than its slower companion. Such classification methods
are not very simple. The settling rate of the particle depends on its shape also. Water
velocities in any one c/s of the classifying device are not uniform. Hence such processes do
not give fractions having all the particles in a relatively small size range but rather fractions
having a mixture of sizes with the average size smaller in one fraction and larger in the other.
Procedure:
1. The terminal settling velocities using Stoke’s equation of different ranges of particles and
also the time of settling are calculated using height of settling All the particles are
assumed to be at the top surface initially.
2. Six equal size filter papers are cut, numbered, dried and then weighed.
3. Six beakers of equal size and shape are taken and are numbered.
4. Water is taken up to the mark in the first beaker i.e. 12 cm from the bottom.
5. A known amount of sample (2 g) is added to the beaker and stirred vertically in order to
minimize centrifugal action.
6. The stirrer is removed from the water suspension and simultaneously the stopwatch is
started.
7. This homogeneous suspension is allowed to settle for predetermined time (corresponding
to the terminal settling velocity of largest size particle).
8. Water from the first beaker is carefully decanted into the second beaker leaving about
1cm of water in the beaker, which corresponds to the settled particles.

33
9. Fresh water is added to the second beaker to make up to the mark (12cm), stirred well,
and again allowed to settle for the calculated time to the next larger particle size.
10. This is continued till the last beaker, the water in the last beaker is discarded leaving 1cm
in the bottom for collection of particles. The particles remaining in each beaker is
weighed after filtering and drying.
11. Weight of the empty filter paper is subtracted.
Observations & Data
1. Density of solids =
S
= 2560 kg/m
3
2. Density of water =
f
= 1000 kg/m
3
.
f
= 0.98 x 10
-3
Ns/m
2
4. Acceleration due to gravity = g = 9.81 m/s
2
5. Particle size 60, 60/√2, 30, 30/√2, 15, 15/√2 µm respectively
6. Weight of the sample taken= 2 g
7. Height of settling=12 cm
Specimen Calculations:
1. Terminal velocity, U
t
= g D
p
2
(
s
-
f
) = __________m/s
18
f
2. Time, θ = H / U
t
= __________s
Method of calculating cumulative weight fraction
Cumulative weight
fraction, x
i
Sample weight, w
1,
w
2
w
1
+ w
2
w
1
+w
2
+ w
3
3. Average particle size of sample, D
p avg
= 1/w
i
/D
P aveg
= _________m
Table 1:
Sl.
No.
Particle
size,
D
p
(μm)
Terminal
velocity,
U
t
, m/s
Height
H
m
Time
Weight of
Empty Filter
paper in g
Weight of
sample (alone),
W
i
, g
01
60
02
60/√2
03
30
04
30/√2
05
15
06
15/√2

34
Table 2:
Sl.
No.
Size range
(μm)
Average
size, (m)
D
P ave
Weight
of
sample
W
i
Weight
fraction,
w
i
=
W
i
/W
w
i
/
D
Pave
Cumulative
wt fraction
x
i
,
larger than
D
p
Cumulative
weight
fraction
(1- x
i
)
smaller
than D
P
01
60√2 – 60
02
60 – 60/√2
03
60/√2 – 30
04
30 – 30/√2
05
30/√2 – 15
06
15 – 15/√2
∑W
i
=
W
∑ w
i
/
D
Pave
Particle size distribution of sample: Draw the graph and find the area under the curve
D
p avg
= 1/area under the curve
Nature of Graph:
Result:
1. Average particle size, calculated = _________m
2. Particle size distribution curve is plotted

35
Experiment No: 10
LEAF FILTER
Aim: To determine the specific cake resistance () and filter medium resistance (R
m
) by
filtering CaCO
3
slurry in a vacuum leaf filter apparatus.
Apparatus: Leaf filter setup, stopwatch, water, bucket (to prepare the slurry), two watch
glasses, weighing balance, hot air oven.
Sample: CaCO
3
(Commercial Grade)
Theory: - Filter is a device that separates solids from fluids through a membrane called filter
medium. This is done by applying pressure difference between slurry inlet and filtrate outlet.
In this case vacuum is created with the help of a vacuum pump, so that filtrate is forced
through the equipment. During filtration the solids form the solid bed of particles and stick to
the lower part of the leaf filter. Two types of resistances are offered by the filtration unit.(1)
the resistance of the cake (2) the resistance of the filterer medium. Filter press although it is
well adapted for many purposes, it is not so economical for handling the large quantities of
sludge or for efficient washing with a small amount of wash water, because of the channeling
that always takes place in a washing press. Thus leaf filters were introduced which require
less labor. But the first cost of this filter is higher and the filters are somewhat more
complicated. Flow rate dt/dv is given by the following formula
dt /dv =K
p
V
ave
+ β
K
p =
C α μ/A
2
(Δp)
β = R
m
μ/A (Δp)
C = C
s
/{1-(m
f
/m
s
- 1) C
s
/}
Note: After integration the equation becomes t /v =(K
p
/2) V + β
Where C = concentration of filtrate, kg/m
3
C
s
= concentration of slurry, kg/m
3
= Density of water, kg/m
3
μ = viscosity of filtrate, kg /m s
A = Area of filter , m
2
Δp = pressure difference across filter medium, N/m
2
m
f =
weight of wet cake, g
m
s
= weight of dry cake, g
α = Specific cake resistance m/kg
R
m
= Filter medium resistance in /m

36
Procedure:
1. 4 litre of 4 % CaCO
3
slurry is prepared by weighing 160g CaCO
3
powder in 4 litre of water
2. Two dry empty watch glasses are weighed.
3. 5litre of this slurry is transferred to the slurry tank and the slurry in the slurry tank is mixed
by switching on the stirrer.
4. The pressure is adjusted to the required value by placing the leaf in water taken in a bucket.
5. The filter cloth is placed on to the leaf and the leaf is kept in the tank, thus equipment is set to
filter the slurry.
6. The pressure of 100mm Hg is set on the pressure gauge and maintained constant throughout
the experiment.
7. The rise in the filtrate level is observed as soon as the vacuum pump is switched on.
8. The time taken for every 2 cm rise in the filtrate level is recorded (cumulated time).
9. Leaf is lifted from the tank to collect a small quantity of the cake on a previously weighed
watch glass. The vacuum pump is switched off. The weight of wet cake is noted. The cake is
dried and the dry weight is noted.
10. Repeat the above steps by preparing the fresh slurry for 200 mm Hg pressure.
Observations:
1. Diameter of the filtrate tank = d
1
= 0.08 m
2. Diameter of the leaf =d
2
= 0.105 m
3. Pressure H = 100 mm Hg or 100 x 10
-3
m Hg
4. Pressure applied p = ρ
Hg
g H = 13600 x 9.81x100x10
-3
Hg
=13.341x 10
3
N/m
2
5. Viscosity of the filtrate, μ = 0.98 x 10
-3
Ns/m
2
(Assuming as that of water)
6. Density of sample = 2560 kg/m
3
7. Density of water = 1000 kg/m
3
8. Initial concentration of CaCO
3
= Cs, kg/m
3
=
Sample wt./{sample wt./ sample density+ water wt./water density},
Table 1: Observations and Calculations
SL
No.
Filtration
pressure drop,
p
(mm Hg)
Weight of
watch
glass
W
1
(g)
Weight of
wet cake
+ watch
glass
W
2
(g)
Weight of
dry cake
+ watch
glass
W
3
(g)
Weight of
wet cake
(W
2
-W
1
)
(g)
Weight of
dry cake
(W
3
-W
1
)
(g)

37
Table: Sample calculations
Sl
No.
Filtrat
e level
L (m)
Volume of
filtrate
collected
V, (m
3
)
ΔV= V
2
-V
1
(m
3
)
V
m
=V
1
+V
2
2
m
3
θ
s
Δθ=θ
2
-θ
1
(s)
Δθ/ΔV
s/m
3
0
0
5.026*10
-05
1
5.026*10
-5
5.026*10
-5
2.5133*10
-5
2
10.026*10
-5
5.026*10
-03
7.54*10
-5
3
15.026*10
-5
5.026*10
-03
12.513*10
-5
4
20.026*10
-5
5.026*10
-03
17.5*10
-5
Table: observations and Calculations
Sl
No.
Filtrat
e level
L (m)
Volume of
filtrate
collected
V, (m
3
)
ΔV= V
2
-V
1
(m
3
)
V
m
=V
1
+V
2
2
m
3
θ
s
Δθ=θ
2
-θ
1
(s)
Δθ/ΔV
s/m
3
Specimen Calculations:
1. Cross sectional area of the filtrate tank A= πd
1
2
/4 5.026*10
-3
m
2
2. Volume of the filtrate collected V = A x L = _____m
3
3. Cross sectional area of the leaf = A
f
= πd
2
2
/4 = 8.659*10
-3
m
2
4. Weight of watch glass, W
1
= _____g
5. Weight of wet cake + watch glass W
2
= _____g
6. Weight of wet cake (W
2
-W
1
)= m
f
= _____g
7. Weight of dry cake + watch glass , W
3
= _____g
8. Weight of dry cake (W
3
-W
1
) = m
c
= _____g

38
9. Concentration of solids per unit volume of filtrate =
oH
C
m
m
C
C
s
C
f
S
2
11
*
C* = _____kg/m
3
Plot a graph of Δθ/ΔV Vs V
m
From graph: k
c
= _________s/m
6
= __________s/m
3
10.
Specific cake resistance = =
*C
p*A*K
2
fC
= _________ m/kg
11. Filter medium resistance R
m
=
p*A*
f
= __________/m
Result: Pressure = 100 mmHg
Specific cake resistance, = _________m/kg
Filter medium resistance, R
m
= __________/m
Pressure = 200 mmHg
Specific cake resistance, = _________m/kg
Filter medium resistance, R
m
= __________/m
39
