
Delaware Dentist Survey
2022
prepared for:
Delaware Department of Health and Social Services
Division of Public Health
Bureau of Health Planning & Resources Management
417 Federal Street
Dover, DE 19901
302-744-4555
prepared by:
University of Delaware
Biden School of Public Policy and Administration
Tibor Tóth, Ph.D.
Newark, DE 19716
302-831-3320
May 2023

Delaware Dentist Survey 2022 ACKNOWLEDGEMENTS – CONTACT – CITATION
_____________________________________________________________________________________
_____________________________________________________________________________________
Delaware Department of Health and Social Services
i
Division of Public Health, Bureau of Health Planning and Resources Management May 2023
ACKNOWLEDGEMENTS
This report is made possible with funding from the U.S. Health Resources and Services
Administration State Primary Care Office Grant. The author would also like to acknowledge
the Delaware Division of Professional Regulation for providing the licensure data that served as
the basis for the survey.
CONTACT INFORMATION
Questions or comments concerning this report and summary can be directed to the
Division of Public Health’s Bureau of Health Planning and Resources Management at 302-741-
8599 or by mail or fax to this address:
Bureau of Health Planning and Resources Management
Delaware Division of Public Health
Edgehill
43 S. DuPont Hwy.
Dover, DE 19901
Fax 302-741-8631
https://www.dhss.delaware.gov/dph/hsm/pcohome.html
CITATION
Suggested Citation:
Delaware Department of Health and Social Services, Division of Public Health, Delaware
Dentist Survey 2022, May 2023
Delaware Dentist Survey 2022 TABLE OF CONTENTS
_____________________________________________________________________________________
_____________________________________________________________________________________
Delaware Department of Health and Social Services
ii
Division of Public Health, Bureau of Health Planning and Resources Management May 2023
TABLE OF CONTENTS
Page
Acknowledgements/Contact Information/Citation.................................................................................. i
List of Figures .................................................................................................................................................. iii
List of Tables .................................................................................................................................................. vii
Executive Summary ........................................................................................................................................ 1
1. Methodology – Dentist Survey ............................................................................................................. 4
2. Demographics – Dentists ....................................................................................................................... 6
3. Practice Characteristics – Dentists ....................................................................................................... 25
4. Spatial Distribution – Dentists .............................................................................................................. 50
5. Methodology – Dental Students/Residents Survey .......................................................................... 55
6. Demographics – Dental Students/Residents .................................................................................... 56
7. Outlook and Licensure – Dental Students/Residents ..................................................................... 61
Appendix A – Dentists Survey Questionnaire ...................................................................................... 73
Appendix B – Dental Health Professional Shortage Area Designation Criteria (excerpt) ........... 80
Appendix C – Dental Student and Resident Survey Questionnaire ................................................ 86
Delaware Dentist Survey 2022 LIST OF FIGURES
_____________________________________________________________________________________
_____________________________________________________________________________________
Delaware Department of Health and Social Services
iii
Division of Public Health Bureau of Health Planning and Resources Management
May 2023
LIST OF FIGURES
Figure Page
2.1 Number of Dentists by County, Delaware, 2022 ........................................................................ 7
2.2 Ratio of Dentist (General/Pediatric) by County, Delaware, 1998-2022 ................................ 9
2.3 Percentage of Dentists by Gender and County, Delaware, 2022 ........................................... 11
2.4 Percentage of Dentists Race by County, Delaware, 2022 ....................................................... 12
2.5 Percentage of Dentists by Hispanic Origin and County, Delaware, 2022 ........................... 13
2.6 Number of Dentists by Age and County, Delaware, 2022 ...................................................... 14
2.7 Percentage of Dentists by Age and County, Delaware, 2022 ................................................. 15
2.8 Number of Dentists Active in Five Years by County, Delaware, 2022 ................................... 16
2.9 Percentage of Dentists Active in Five Years by County, Delaware, 2022 .............................. 17
2.10 Percentage of Dentists by State of High School and County, Delaware, 2022 .................... 18
2.11 Percentage of Dentists by State of Dental School Attendance and County,
Delaware, 2022 ..................................................................................................................................... 19
2.12
Percentage of Dentists by State of Dental Residency Program and County,
Delaware, 2022 ........................................................................................................................................ 20
2.13
Percentage of Dentists by Dental Residency Program Completion and County,
Delaware, 2022 ...................................................................................................................................... 21
2.14
Percentage of Dentists by Type of Dental Residency Program Attendance and County,
Delaware, 2022 ....................................................................................................................................... 22
2.15 Number of Dental Specialists by County, Delaware, 2022 ........................................................ 23
3.1 Percentage of Dentists by Practice and County, Delaware, 2022 ........................................... 25
3.2 Average Number of Dentists at the Primary Site by County, Delaware, 2022 .................... 26
3.3 Mean Number of Weekly Patient Encounters of Dentists by County, Delaware, 2022 ..... 27
3.4 Percentage of Non-Dentist Staff Use by County, Delaware, 2022 ......................................... 28
3.5 Percentage of Dentist Offices with Spoken languages Other than English by County,
Delaware, 2022 ..................................................................................................................................... 29
3.6 Percentage of Dentists that Offer Saturday and/or Evening Hours by County,
Delaware, 2022 ..................................................................................................................................... 30
3.7 Percentage of Dentists Accepting New Patients by County, Delaware, 2022 ....................... 31
3.8 Average Wait Time in Days for New and Established Patients reported by Dentists by
County, Delaware, 2022 ...................................................................................................................... 32
3.9 Percentage of Dentists Serving Pediatric Patients by County, Delaware, 2022 ..................... 34
Delaware Dentist Survey 2022 LIST OF FIGURES
_____________________________________________________________________________________
_____________________________________________________________________________________
Delaware Department of Health and Social Services
iv
Division of Public Health Bureau of Health Planning and Resources Management
May 2023
LIST OF FIGURES
(continued)
Figure Page
3.10 Percentage of Dentists Reporting Beginning Age of Pediatric Patient Treatments by Age
and County, Delaware, 2022 ............................................................................................................. 35
3.11 Percentage of Dentists Reporting Dental Insurance Plan Participation by County,
Delaware, 2022 ....................................................................................................................................... 36
3.12 Percentage of Dentists Reporting Participation in Medicaid and Non-Medicaid
Insurance Programs by Dentists by County, Delaware, 2022 .................................................... 37
3.13 Percentage of Dentists Providing Flexible Payment Options by County,
Delaware, 2022 ....................................................................................................................................... 38
3.14 Percentage of Dentists Providing Charity Care In/Out of Office by County,
Delaware, 2022 ....................................................................................................................................... 39
3.15 Percentage of Unreimbursed Gross Fees of Dentists, by County, Delaware 2022 ............ 40
3.16 Percentage of Dentists Indicating Fully Staffed Office (by Dental Hygienists, Dental
Assistants) by County, Delaware 2022............................................................................................. 41
3.17 Percentage of Dentists Indicating Fully Staffed Office (by Dentists) by County,
Delaware 2022 ..................................................................................................................................... 42
3.18 Percentage of Dentists by Last Reported Hiring of Staff by County, Delaware 2022 ....... 43
3.19 Percentage of Dentists Reporting How Long It Took to Hire Dental Staff
by County, Delaware 2022 ................................................................................................................ 44
3.20 Percentage of Dentists Indicating Perceived Shortage of Qualified Dental Staff
by County, Delaware 2022 ................................................................................................................ 45
3.21 Percentage of Dentists Reporting Most Difficult Positions to Fill Identified by County,
Delaware 2022 ..................................................................................................................................... 46
3.22 Percentage of Dentists Reporting Open Chairs by Due to Cancellation,
Lack of Demand, and Other Reasons, by County, Delaware 2022 ......................................... 47
3.23 Average Number of Open Chair Hours per week for Dentists with Open Chairs Due to
Cancellation, Lack of Demand, and Other Reasons by County, Delaware 2022................ 48
3.24 Percentage of Dentists by Reported Reasons/Limits to Seeing Patients by County,
Delaware 2022 ...................................................................................................................................... 49
Delaware Dentist Survey 2022 LIST OF FIGURES
_____________________________________________________________________________________
_____________________________________________________________________________________
Delaware Department of Health and Social Services
v
Division of Public Health Bureau of Health Planning and Resources Management
May 2023
LIST OF FIGURES
(continued)
Figure Page
4.1 Number of Persons per FTE General/Pediatric Dentists by Census County Division,
Delaware 2022 ..................................................................................................................................... 52
4.2 Number of Persons per Total Dentists (General/Pediatric FED.FTE & Specialist FTE)
by Census County Division, Delaware 2022 ................................................................................. 54
6.1 Percentage of Dental Students/Residents by Gender, Delaware 2022 ................................. 56
6.2 Percentage of Dental Students/Residents by Hispanic Origin, Delaware 2022 ................... 57
6.3 Percentage of Dental Students/Residents by Race, Delaware 2022 ....................................... 58
6.4 Percentage of Dental Students/Residents by State of Origin, Delaware 2022 .................... 59
6.5 Percentage of Dental Students/Residents that Intend to be Active in Clinical Dentistry
in 5 years, Delaware 2022 ................................................................................................................. 60
7.1 Percentage of Dental Students’/Residents’ Estimated Student Debt (Undergraduate and
Dental school), Delaware 2022 ....................................................................................................... 61
7.2 Percentage of Dental Students/Residents by Decision on where they will Practice,
Delaware 2022 ..................................................................................................................................... 62
7.3 Percentage of Dental Students/Residents by Location of Where They Intend to Practice,
Delaware 2022 ..................................................................................................................................... 63
7.4 Percentage of Dental Students/Residents by Type of Practice They Intend to Go Into,
Delaware 2022 ..................................................................................................................................... 64
7.5 Percentage of Dental Students/Residents by Importance (Self Identified) of Student Debt
in Deciding Where They Will Practice, Delaware, 2022 .......................................................... 65
7.6 Percentage of Dental Students/Residents by Importance of The Loan
Repayment Program in Deciding Where They Will Practice, Delaware 2022 .................... 66
7.7 Percentage of Dental Students/Residents by Own Perception of General Practice
Residency (GPR) and Advanced Education (AEGD), Delaware 2022 ..................................... 68
7.8 Percentage of Dental Students/Residents by Agreement or Disagreement with Statements
Relating to Dental Licensure Examinations, Delaware, 2022 .................................................... 69
7.9 Percentage of Dental Students/Residents by the Type of Clinical Licensing They Plan on
Obtaining within 1-2 Years of Graduation, Delaware 2022 ...................................................... 70
7.10 Percentage of Dental Students/Residents by the State License They Plan on Obtaining,
Delaware 2022 ..................................................................................................................................... 71
Delaware Dentist Survey 2022 LIST OF FIGURES
_____________________________________________________________________________________
_____________________________________________________________________________________
Delaware Department of Health and Social Services
vi
Division of Public Health Bureau of Health Planning and Resources Management
May 2023
LIST OF FIGURES
(continued)
Figure Page
7.11 Percentage of Dental Students/Residents by Concerns Identified When
Thinking about the Delaware Licensing Exam, Delaware 2022 .............................................. 72
Delaware Dentist Survey 2022 LIST OF TABLES
_____________________________________________________________________________________
_____________________________________________________________________________________
Delaware Department of Health and Social Services
vii
Division of Public Health Bureau of Health Planning and Resources Management
May 2023
LIST OF TABLES
Table Page
7.1 Percentage of Dental Students/Residents by Ranked Factors of Importance
in Deciding Where They Will Practice, Delaware, 2022 ............................................................ 66
Delaware Dentist Survey 2022 EXECUTIVE SUMMARY
_____________________________________________________________________________________
_____________________________________________________________________________________
Delaware Department of Health and Social Services
1
Division of Public Health Bureau of Health Planning and Resources Management
May 2023
Executive Summary
The Delaware Dentist Survey 2022 survey follows its predecessors fielded in 2016, 2012, 2008,
2005, and 1998. For the first time this year, the study expanded the efforts of surveying
dentists licensed in Delaware with a survey of Delaware’s dental students. The University of
Delaware’s Biden School of Public Policy and Administration prepared this report for the
Delaware Department of Health and Social Services, Division of Public Health. This project is
jointly supported by the Bureau of Oral Health and Dental Services and the Bureau of Health
Planning and Resources Management. Funding for this report is made possible through federal
grant funding (Health Resources Services Administration, Bureau of Health Workforce, and the
Office of Rural Health Policy) as well as state funding and funding from the Delaware Health
Care Commission.
This report provides important information for oral health care advocates,
policymakers, and other stakeholders to better understand the supply and distribution of
dentists across Delaware. This information supports Delaware’s efforts to assess the potential
for dental Health Professional Shortage Areas (HPSAs) in the state. If an area is deemed a
HPSA by the federal Office of Shortage Designation, then facilities located there are eligible for
participation in a variety of recruitment programs such as the Conrad State 30/J-1 Visa Waiver
Program, the National Health Services Corps, and the State Loan Repayment Program.
Additionally, this information may be utilized by recruitment programs to determine whether a
dentist should be placed in a particular area.
The results of the survey indicate that Delaware has 356 dentists working in
general/pediatric dentistry and 59 dentists working in other specialties. In addition to these
findings, the following can be drawn from the data:
• Overall, the number of active dentists decreased since 2016 from 437 to 415 in
2022.
Delaware Dentist Survey 2022 EXECUTIVE SUMMARY
_____________________________________________________________________________________
_____________________________________________________________________________________
Delaware Department of Health and Social Services
2
Division of Public Health Bureau of Health Planning and Resources Management
May 2023
• The number of general/pediatric dentists increased from 352 in 2016 to 356 in
2022, while the number of specialists decreased from 85 to 59.
• The full-time equivalent (FTE) (using federal guidelines) count of general/pediatric
dentist decreased from 305 in 2016 to 294 in 2022. The FTE count of specialists
(using FTE adjustment only) decreased from 65 in 2016 to 52 in 2022.
• The population-to-dentist (general/pediatric) ratio (using federal guidelines)
increased from 3,128 persons per FTE dentist in 2016 to 3,414 persons in 2022.
• If entire counties are considered rational service areas, neither Sussex nor New
Castle counties would be considered underserved areas. However, Kent County is
getting close to the HPSA threshold of 5,000:1. The population-to-provider ratio is
only one of the variables used for HPSA designation.
• The proportion of Asian dentists decreased slightly from 6.7 percent in 2016 to 6.0
percent in 2022. Black dentists increased by about 1.4 percentage points since
2016. The proportion of dentists reporting “other” as their race stayed unchanged
at about 4.1 percent statewide.
• Nearly 42 percent of dentists statewide are 55 years of age or older. Just over 17
percent are 65 years of age or older.
• About 21 percent of Delaware dentists will either not be practicing dentistry in five
years or are unsure if they will be practicing.
• About 95 percent of general/pediatric dentists and 100 percent of specialists in
Delaware are accepting new patients.
• General/pediatric dentists in Kent and Sussex counties see more patients per week
than their colleagues in New Castle County. Weekly patient encounters for
general/pediatric dentists are 99 patients per week in Kent County and 103 patients
per week in Sussex County, while general/pediatric dentists in New Castle County
see 90 patients per week.
• Waiting times for new patients seeking an appointment with a general/pediatric
dentist are somewhat longer in Sussex County (34 days) than in Kent County (26
days) or New Castle County (nine days).
• Medicaid is accepted by about 64 percent of general/pediatric dentists, and about 24
percent of specialists accept Medicaid.
Delaware Dentist Survey 2022 EXECUTIVE SUMMARY
_____________________________________________________________________________________
_____________________________________________________________________________________
Delaware Department of Health and Social Services
3
Division of Public Health Bureau of Health Planning and Resources Management
May 2023
• Almost all general/pediatric dentists use resources provided by hygienists and dental
assistants. Dental technicians were not addressed in this survey.
• About a third of Delaware’s dentists offer flexible hours by remaining open at night
and on Saturday. General/pediatric dentists are more likely to offer such hours
than are specialists.
• Approximately 95 percent of general/pediatric dentists and 90 percent of specialist
dentists practicing in Delaware accept pediatric patients.
• About 60 percent general/pediatric dentists and 64 percent of specialist dentists
report being fully staffed by dental hygienists and dental assistants.
• About 90 percent of general/pediatric dentists and 91 percent of dental specialists
report fully staffed offices.
• Eighty-one percent of general/pediatric dentists and 68 percent of specialist dentists
in Delaware self report a shortage of qualified dental staff.
• On average, Delaware’s dentists report 6.2 open chair hours per week due to
cancellations, 6.1 hours due to lack of demand, and about 4.3 hours due to other
non-specified reasons.
• Among dental students, 48 percent are female, about 38 percent are non-White,
and 24 percent are Hispanic.
• All dental students surveyed plan on being in dentistry five years from today.
• About 62 percent of dental students expect that their student debt (undergraduate
and dental school) will be $350,000 or above once they complete their studies.
• About 67 percent of dental students have already decided where they will practice
once they graduate.
• About 86 percent of dental students reported that loan repayment programs play a
very important or an important role in deciding where they will practice.
• About 14 percent of dental students agree that in general, licensure examinations
are unfair.
• Eighty-eight percent of dental students report that it is challenging to secure
patients for the licensure examination in Delaware.
Delaware Dentist Survey 2022 METHODOLOGY –DENTISTS
_____________________________________________________________________________________
_____________________________________________________________________________________
Delaware Department of Health and Social Services
4
Division of Public Health Bureau of Health Planning and Resources Management
May 2023
1. Methodology – Dentist Survey
In 1998, the Delaware Department of Health and Social Services, Division of Public
Health (DPH) began to measure the number and spatial distribution of dentists practicing in
Delaware. DPH repeated the survey of dentists in 2005, 2008, 2012, 2016, and 2022. The
objective was to support the identification of underserved areas and to understand any existing
or developing trends that could impact the supply of dental services. The 2022 dentist survey
instrument replicated what was used in previous years. Moreover, questions were added to
assess the impact of Coronavirus 2019 (COVID-19) on dentists. Also, questions on staffing and
open chair hours were included to provide contextual information to the quantitative data
collection among dentists.
The method chosen to gather the information among dentists was a self-administered
mail survey to all of Delaware’s licensed dentists. This approach included a pre-letter and an
initial mail survey, followed by three follow-up mailings to non-respondents. The list of licensed
dentists from February 2022 that was obtained from the Division of Professional Regulation
contained 542 records. From this total, 78 entries were determined to be duplicates and
removed. Additionally, 27 providers were identified who were not included in the original list.
By the project’s conclusion, 491 licensed dentists were contacted. Responses were received
from 230 dentists. The response rate in 2022 was 47 percent, compared to 41 percent in 2016.
As of February 2022, Delaware had 491 licensed dentists. This is an increase of 19
licensed dentists from 2016, when Delaware had 472 licensed dentists. However, this does not
mean they are active or that they have a Delaware practice. Based on the survey results,
adjusted for non-respondents, approximately 415 dentists actively practice in Delaware. This
total is used to produce all estimates presented throughout this report where the results for
adjustment for non-respondents was calculated based on geographic weights. The weights were
Delaware Dentist Survey 2022 METHODOLOGY –DENTISTS
_____________________________________________________________________________________
_____________________________________________________________________________________
Delaware Department of Health and Social Services
5
Division of Public Health Bureau of Health Planning and Resources Management
May 2023
calculated as a ratio of licensed dentists in each Census County Division and the number of
responses received from that Census County Division. This weight was applied to all responses
received and the total used to produce all estimates presented throughout the report.
This section of the report focuses on all active dentists, which includes general/pediatric
dentists and specialists. Using the survey data, it is estimated that in 2022, 356 (up from 352 in
2016) dentists worked as general/pediatric dentists and 59 dentists (down from 85 in 2016)
practiced in specialty areas. When reporting on dentists in this report, most responses are
tabulated for these two major groups.
It is important to note that the term ‘general/pediatric dentists’ used in the report
refers to dentists who chose the following three self-designated practice codes when asked
about their specialty: general/pediatric dentistry (DG), pediatric dentistry (PED DENT), and
general practice residency (GPR). For a listing of all codes, see Appendix A. The decision to
include these dentists among general/pediatric dentists is based on the Health Professional
Shortage Area (HPSA) designation criteria (Appendix B, Part I – Geographic Area, B.
Methodology, 3. Counting Dental Practitioners). The term ‘specialist’ refers to dentists who
selected one of the eight specialties (Appendix A.

Delaware Dentist Survey 2022 DEMOGRAPHICS –DENTISTS
_____________________________________________________________________________________
_____________________________________________________________________________________
Delaware Department of Health and Social Services
6
Division of Public Health Bureau of Health Planning and Resources Management
May 2023
2. Demographics – Dentists
Not all dentists practice full-time. According to the Federal Health Professional
Shortage Area (HPSA) guidelines
1
, adjustments are necessary to allow for a true measure of
dental service capacity within a given geographic area from year to year. This adjustment
provides the number of full-time equivalent (FTE) dentists. For example, a dentist engaged in
delivering care directly to patients 40 or more hours per week is defined as a full-time dentist.
Less than 40 hours is considered less than full-time. For each four hours less than 40 hours, 0.1
FTE is deducted. Anything more than 40 hours is considered full-time. A dentist delivering 60
hours per week of care is still counted as one FTE dentist.
The Federal HPSA guidelines indicate that general and pediatric dentists’ FTEs should be
further adjusted to reflect variations in productivity measured by the number of auxiliary staff
members employed. A dentist’s FTE is increased incrementally for each dental hygienist and/or
dental assistant employed. Also, since age is often a factor in a dentist’s availability, adjustments
are further made to account for the practitioner’s age in line with criteria outlined by the rules
governing HPSA designations. Thus, beginning at the age of 55, a dentist’s FTE is incrementally
decreased. These factors are used to calculate the FTE.FED number of dentists in Delaware
(FTE.FED stands for Full Time Equivalent calculated using the federal government’s productivity
factor). These adjustments are described in Appendix B.
1
Federal Register/Vol.45, No.223/ Monday, November17, 1980, Part IV Department of Health and Human Services,
42 CFR Part 5, p.76004.

Delaware Dentist Survey 2022 DEMOGRAPHICS –DENTISTS
_____________________________________________________________________________________
_____________________________________________________________________________________
Delaware Department of Health and Social Services
7
Division of Public Health Bureau of Health Planning and Resources Management
May 2023
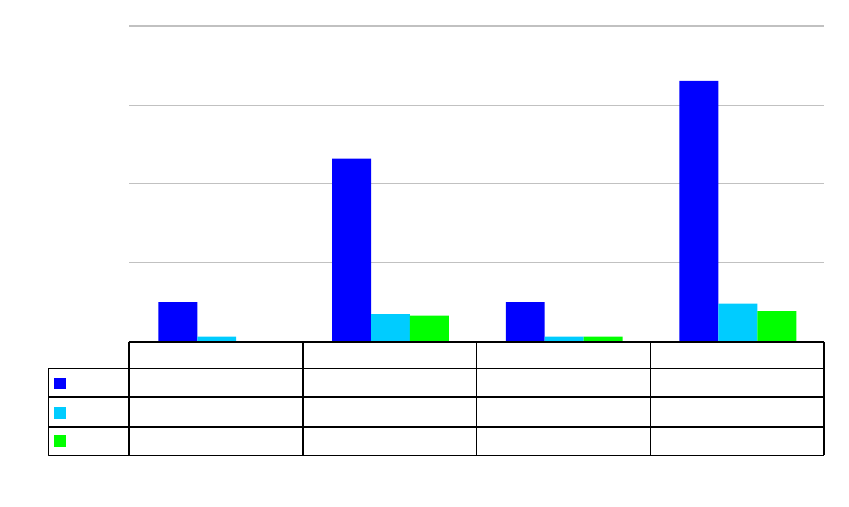
Figure 2.1
Number of Dentists by County, Delaware, 2022
Kent
New Castle
Sussex
Delaware
General/Pediatric
41
257
58
356
General/Pediatric
FTE.FED
38
199
57
294
Specialist
14
40
5
59
Specialist FTE
14
35
3
52
0
100
200
300
400
Number of Dentists
County/State
Source: Delaware Department of Health and Social Services, Division of Public Health, Delaware Dentist Survey
2022
Although the federal HPSA guidelines for determining dental shortage areas refer to
and/or pediatric dentistry, this study applies the time adjustment formula described above (FTE
formula only) to account for the service capacity of specialists throughout the state. Thus,
following the federal guidelines, the FTE calculation is used to report the full-time equivalent
number of specialists while the FTE.FED number is used to report the full-time equivalent
number of those who practice general or pediatric dentistry, taking into account recommended
productivity measures.
Figure 2.1 summarizes the current number of dentists actively practicing in Delaware by
county of practice. It includes FTE estimates for specialists based on 40 hours of direct patient
care and does not reflect either the age adjustment or an adjustment for hygienists or dental

Delaware Dentist Survey 2022 DEMOGRAPHICS –DENTISTS
_____________________________________________________________________________________
_____________________________________________________________________________________
Delaware Department of Health and Social Services
8
Division of Public Health Bureau of Health Planning and Resources Management
May 2023
assistants. The FTE.FED is calculated using the federal guidelines which apply to general
practitioners and pediatric dental specialists that include the above-mentioned FTE adjustment
and adjustment for age and auxiliary staff.
The actual number (without FTE or FTE.FED adjustments) of general/pediatric dentists
practicing increased from 352 in 2016 to 356 in 2022. However, Delaware experienced a
decrease in the actual number of specialists since 2016. In 2022, 59 specialists were practicing
in Delaware, down from 85 in 2022.
Given Delaware’s 2022 population of 1,003,654
2
, each “FTE.FED” dentist serves about
3,414 persons, an increase from 3,128 persons per FTE.FED dentist since 2016 (Figure 2.2).
These ratios reflect only those dentists in general/pediatric or pediatric practice. For the three
counties for 2022, the estimates for each FTE.FED dentist are 4,831 persons in Kent County
(up from 3,243 in 2016), 2,886 persons in New Castle County (up from 2,490 in 2016), and
4,311 in Sussex County (down from 8,416 in 2016).
2
Delaware Population Consortium Annual Population Projections Version 2021.0 from October 31, 2021, Accessed
August 22, 2022.

Delaware Dentist Survey 2022 DEMOGRAPHICS –DENTISTS
_____________________________________________________________________________________
_____________________________________________________________________________________
Delaware Department of Health and Social Services
9
Division of Public Health Bureau of Health Planning and Resources Management
May 2023
Figure 2.2
Ratio of Dentist (General/Pediatric) by County, Delaware, 1998-2022
Kent
New Castle
Sussex
Delaware
1998-FTE Ratio
4,200
2,200
6,500
3,100
2005-FTE Ratio
5,800
3,200
7,100
4,000
2008-FTE Ratio
5,700
2,600
6,000
3,300
2012
-FTE Ratio
4,627
2,785
8,200
3,573
2016-FTE Ratio
2,824
1,938
7,294
2,504
2022-FTE Ratio
3,991
2,508
4,468
3,041
1998-FTE.FED Ratio
3,400
1,900
5,400
2,600
2005-FTE.FED Ratio
4,800
2,500
5,300
3,100
2008-FTE.FED Ratio
3,700
1,800
4,200
2,300
2012-FTE.FED Ratio
3,470
2,281
5,124
2,806
2016-FTE.FED Ratio
3,243
2,490
8,416
3,128
2022-FTE.FED Ratio
4,831
2,886
4,311
3,414
0
1,000
2,000
3,000
4,000
5,000
6,000
7,000
8,000
9,000
Persons per FTE dentists
County/State
Source: Delaware Department of Health and Social Services, Division of Public Health, Delaware Dentist Survey
2022
The data labeled “FTE Ratio” represents full-time equivalencies without making the
federal productivity adjustments for age and auxiliaries and is shown for reference purposes
only. Only the hours of direct patient care are considered. The data items labeled as “FTE.FED
Ratio” represent full-time equivalencies with adjusted ratios for age and auxiliaries.
Improvement is shown in Sussex County only. Both the FTE and FTE.FED ratios for Kent and
New Castle counties declined. One of the main criteria used by the federal government to

Delaware Dentist Survey 2022 DEMOGRAPHICS –DENTISTS
_____________________________________________________________________________________
_____________________________________________________________________________________
Delaware Department of Health and Social Services
10
Division of Public Health Bureau of Health Planning and Resources Management
May 2023
determine a dental Health Professional Shortage Area (HPSA) is the ratio of persons per
FTE.FED dentist.
3
The threshold of 5,000 persons per FTE.FED dentists must be reached for an
area to be considered a shortage area. In 2022, using those criteria alone, none of Delaware’s
counties would qualify as a shortage area. However, Kent County is quite close to reaching the
5,000 HPSA designation threshold.
The next two sections of the report examine different aspects of dentists practicing in
Delaware and their practices. Overall, the objective is to present the attributes that affect the
availability of dental services across population groups throughout the state
The dental community in Delaware is 36 percent female (Figure 2.3). There is,
however, some variation among the counties. Kent County has about 13 percentage points
more female dentists than the state overall. In New Castle County, 33 percent of dentists are
female, compared to 38 percent in Sussex County.
3
In special cases this threshold is lower as described in Appendix B, Dental HPSA Designation Criteria.

Delaware Dentist Survey 2022 DEMOGRAPHICS –DENTISTS
_____________________________________________________________________________________
_____________________________________________________________________________________
Delaware Department of Health and Social Services
11
Division of Public Health Bureau of Health Planning and Resources Management
May 2023
Figure 2.3
Percentage of Dentists by Gender and County, Delaware, 2022
Kent
New Castle
Sussex
Delaware
Male
51.9
67.1
62.3
64.4
Female
48.1
32.9
37.7
35.6
0
20
40
60
80
100
Percentage of Dentists
County/State
Source: Delaware Department of Health and Social Services, Division of Public Health, Delaware Dentist Survey
2022

Delaware Dentist Survey 2022 DEMOGRAPHICS –DENTISTS
_____________________________________________________________________________________
_____________________________________________________________________________________
Delaware Department of Health and Social Services
12
Division of Public Health Bureau of Health Planning and Resources Management
May 2023
Figure 2.4
Percentage of Dentists by Race and County, Delaware, 2022
Kent
New Castle
Sussex
Delaware
White
77.4
82.4
85.7
82.9
Black
15.1
3.4
3.2
5.0
Asian
7.5
6.9
4.8
6.0
Other
0.0
7.2
6.3
6.2
0
20
40
60
80
100
Percentage of Dentists
County/State
Source: Delaware Department of Health and Social Services, Division of Public Health, Delaware Dentist Survey
2022
The racial distribution of dentists by county is shown in Figure 2.4. The most striking
aspect of this table is the low proportion of Black dentists in Delaware. Black Delawareans
account for more than 20
4
percent of Delaware’s population, yet only 5 percent of Delaware
dentists are Black. This is an increase of about 1.5 percentage points since the last survey in
2016. The proportion of Asian dentists decreased about one percentage point since the 2016
survey.
4
Delaware Population Consortium Annual Population Projections Version 2021.0 from October 31, 2021, Accessed
August 22, 2022.

Delaware Dentist Survey 2022 DEMOGRAPHICS –DENTISTS
_____________________________________________________________________________________
_____________________________________________________________________________________
Delaware Department of Health and Social Services
13
Division of Public Health Bureau of Health Planning and Resources Management
May 2023
Figure 2.5
Percentage of Dentists by Hispanic Origin and County, Delaware, 2022
Kent
New Castle
Sussex
Delaware
Hispanic
0.0
4.7
8.5
4.7
Non-Hispanic
100.0
95.3
91.5
95.3
0
20
40
60
80
100
Percentage of Dentists
County/State
Source: Delaware Department of Health and Social Services, Division of Public Health, Delaware Dentist Survey
2022
Dentists identifying themselves as “other,” including multi-racial, rose from 4.1 percent
in 2016 to 6.2 percent in 2022 statewide. At the county level, Kent County experienced the
greatest shift in racial diversity among its dentists. In 2016, about 17 percent of dentists in Kent
County were racial minorities. By 2022, roughly 23 percent of Kent County dentists identified
themselves as Black, Asian, or Other. About 83 percent of Sussex County dentists report being
White, down from 86 percent in 2016. In New Castle County, the percentage of White
dentists decreased from 85 percent in 2016 to 82.4 percent in 2022. Practitioners of Hispanic
origin are of particular interest because beginning in the 1990s, Delaware experienced a rapid
growth in its Hispanic population, particularly in Sussex County. Currently, Delaware’s Hispanic
population is above 9 percent while the dentist population is only about 5 percent Hispanic.
No Hispanic dentist reported from Kent County (Figure 2.5).

Delaware Dentist Survey 2022 DEMOGRAPHICS –DENTISTS
_____________________________________________________________________________________
_____________________________________________________________________________________
Delaware Department of Health and Social Services
14
Division of Public Health Bureau of Health Planning and Resources Management
May 2023
The U.S. Department of Health and Social Services suggests that greater diversity within
health professions positively correlates with improved public health outcomes. Greater
diversity increases access to care for underserved populations and better enables minority
patients to see practitioners with whom they share a common race, ethnicity, or language.
5
As
Delaware’s population diversifies, there may be a need to recruit or train more Black dentists
for New Castle and Sussex counties and more Hispanic dentists for Kent County.
Figure 2.6
Number of Dentists by Age and County, Delaware, 2022
Kent
New Castle
Sussex
Delaware
Under 35
4
21
8
33
35-44
22
53
12
87
45-54
20
77
20
117
55-64
4
81
10
95
65+
4
57
11
72
0
20
40
60
80
100
120
Number of Dentists
County/State
Source: Delaware Department of Health and Social Services, Division of Public Health, Delaware Dentist Survey
2022
5
U.S. Department of Health and Human Services, Health Resources and Services Administration, Bureau of Health
Professions. The Rationale for Diversity in the Health Professions: A Review of the Evidence. October 2006.

Delaware Dentist Survey 2022 DEMOGRAPHICS –DENTISTS
_____________________________________________________________________________________
_____________________________________________________________________________________
Delaware Department of Health and Social Services
15
Division of Public Health Bureau of Health Planning and Resources Management
May 2023
Figure 2.7
Percentage of Dentists by Age and County, Delaware, 2022
Kent
New Castle
Sussex
Delaware
Under 35
7.4
7.3
13.1
8.2
35-44
40.7
18.3
19.7
21.5
45-54
37.0
26.6
32.8
29.0
55-64
7.4
28.0
16.4
23.5
65+
7.4
19.7
18.0
17.8
0
10
20
30
40
50
Percentage of Dentists
County/State
Source: Delaware Department of Health and Social Services, Division of Public Health, Delaware Dentist Survey
2022
In 2016, there were 32 dentists under age 35 in Delaware; in 2022, there are about 33
dentists in this age bracket (Figure 2.6). The proportion of younger dentists (under 35)
remained basically the same across counties between 2016 and 2022 (Figure 2.7). Yet, the
majority (about 70 percent) of Delaware dentists are 45 years of age or older, and 18 percent
are 65 years of age or older. The lowest proportion of dentists above 65 reported from Sussex
Castle County (7.4 percent).
The guidelines governing federal HPSA designations suggest that age factors into
productivity levels. The HPSA guidelines include a reduction in FTE estimates beginning at age
55 to more accurately assess dental service capacity at the aggregate level. Forty-five percent of
Delaware dentists are 55 years of age or older. Unless proactive measures are taken to recruit
younger dentists, the state will continue to see a decline in the number of dental practitioners
Delaware Dentist Survey 2022 DEMOGRAPHICS –DENTISTS
_____________________________________________________________________________________
_____________________________________________________________________________________
Delaware Department of Health and Social Services
16
Division of Public Health Bureau of Health Planning and Resources Management
May 2023
working at full capacity. New Castle and Kent counties will be most impacted by this
downward trend.
Dentists were asked if they planned to be active in dentistry in five years (Figures 2.8
and 2.9). About 11 percent of Delaware dentists do not expect to be practicing five years from
now, and about 9 percent are unsure. About 10 percent of New Castle County’s and 11
percent of Sussex County’s dentists report being unsure if they will be practicing in 2027.
Figure 2.8
Number of Dentists Active in Five Years by County, Delaware, 2022
Kent
New Castle
Sussex
Delaware
Yes
49
231
50
330
No
6
35
6
47
Unsure
0
32
7
39
0
100
200
300
400
Number of Dentists
County/State
Source: Delaware Department of Health and Social Services, Division of Public Health, Delaware Dentist Survey
2022

Delaware Dentist Survey 2022 DEMOGRAPHICS –DENTISTS
_____________________________________________________________________________________
_____________________________________________________________________________________
Delaware Department of Health and Social Services
17
Division of Public Health Bureau of Health Planning and Resources Management
May 2023
Figure 2.9
Percentage of Dentists Active in Five Years by County, Delaware, 2022
Kent
New Castle
Sussex
Delaware
Yes
89.1
77.5
79.4
79.3
No
10.9
11.7
9.5
11.3
Unsure
0.0
10.7
11.1
9.4
0
20
40
60
80
100
Percentage of Dentists
County/State
Source: Delaware Department of Health and Social Services, Division of Public Health, Delaware Dentist Survey
2022
To better understand why some dentists choose to practice in Delaware and others
practice in other states, it is necessary to study several factors that affect the supply of dental
providers who serve Delaware residents. Several pieces of information are useful for this
purpose. First, where did this dentist originally reside as measured by the state from which
he/she graduated high school? Second, in what state did the dentist attend dental school?
Third, in what state did the dentist complete his/her residency?
Delaware Dentist Survey 2022 DEMOGRAPHICS –DENTISTS
_____________________________________________________________________________________
_____________________________________________________________________________________
Delaware Department of Health and Social Services
18
Division of Public Health Bureau of Health Planning and Resources Management
May 2023
Figure 2.10
Percentage of Dentists by State of High School Graduation and County,
Delaware, 2022
Kent
New Castle
Sussex
Delaware
DE
29.6
46.1
42.9
43.5
MD
11.1
7.4
11.1
8.5
NJ
11.1
5.7
11.1
7.2
NY
3.7
5.7
6.3
5.6
OH
0.0
2.7
0.0
1.9
PA
14.8
19.5
19.0
18.8
Other
29.6
12.8
9.5
14.5
0
10
20
30
40
50
60
Percentage of Dentists
County/State
Source: Delaware Department of Health and Social Services, Division of Public Health, Delaware Dentist Survey
2022
About 85 percent of Delaware’s dentists graduated from a high school in Delaware or
one of the surrounding states (Maryland, New Jersey, New York, Ohio, or Pennsylvania),
thereby suggesting that they grew up in the region (Figure 2.10). This proportion of dentists
increased approximately from 80 percent in 2016. It appears that there is some variation in
preferred practice location relative to the state in which dentists (presumably) grew up.
Delaware dentists who grew up in Maryland are more prominent in New Castle and Sussex
Counties. In the past, dentists originating from Pennsylvania used to be more oriented toward
New Castle County, but now they also show up in Sussex County. Kent County hosts a far
larger percentage (30 percent) of dentists who come from outside the region. Retired U.S. Air
Delaware Dentist Survey 2022 DEMOGRAPHICS –DENTISTS
_____________________________________________________________________________________
_____________________________________________________________________________________
Delaware Department of Health and Social Services
19
Division of Public Health Bureau of Health Planning and Resources Management
May 2023
Force dentists from either current or past associations with Dover Air Force Base may
contribute to this finding.
Figure 2.11
Percentage of Dentists by State of Dental School Attendance
and County, Delaware, 2022
Kent
New Castle
Sussex
Delaware
DC
11.1
5.7
3.2
6.0
MD
14.8
19.5
17.5
18.6
NJ
3.7
2.7
7.9
3.6
NY
3.7
3.0
1.6
2.9
OH
0.0
4.0
0.0
2.9
PA
44.4
43.8
52.4
45.2
Other
22.2
21.2
17.5
20.8
0
10
20
30
40
50
60
Percentage of Dentists
County/State
Source: Delaware Department of Health and Social Services, Division of Public Health, Delaware Dentist Survey
2022
About 45 percent of Delaware dentists graduated from dental schools in Pennsylvania,
about the same as in 2016 (Figure 2.11). The second highest proportion of dentists graduated
from Maryland dental schools (18.6 percent). The distribution among the other states is not all
that different among the counties. About 21 percent of Delaware dentists graduated from
dental schools outside of the region surrounding Delaware.

Delaware Dentist Survey 2022 DEMOGRAPHICS –DENTISTS
_____________________________________________________________________________________
_____________________________________________________________________________________
Delaware Department of Health and Social Services
20
Division of Public Health Bureau of Health Planning and Resources Management
May 2023
About 56 percent of Delaware dentists who indicated completing a residency
completed it in Delaware. However, dentists practicing in Kent County are least likely to have
completed their residency program in Delaware. Only about 18 percent of Kent County
dentists completed their residency in the state (up from 11 percent in 2016), compared to 65
percent of dentists practicing in New Castle County and 44 percent practicing in Sussex County
(Figure 2.12).
Figure 2.12
Percentage of Dentists by State of Dental Residency Program
and County, Delaware, 2022
Kent
New Castle
Sussex
Delaware
DE
18.5
65.1
44.4
55.9
CT
0.0
2.7
1.6
2.2
MD
7.4
0.0
3.2
1.4
NY
3.7
1.0
4.8
1.9
PA
25.9
13.4
19.0
15.9
VA
3.7
2.7
0.0
2.4
OTHER
40.7
15.1
27.0
20.2
0
10
20
30
40
50
60
Percentage of Dentists
County/State
Source: Delaware Department of Health and Social Services, Division of Public Health, Delaware Dentist Survey
2022
There is clearly a geographic orientation exhibited by these responses. It is plausible to
suggest that similar patterns might emerge with the state of the dentist’s residency. However,
these findings demonstrate that most dentists attend college within several hundred miles of

Delaware Dentist Survey 2022 DEMOGRAPHICS –DENTISTS
_____________________________________________________________________________________
_____________________________________________________________________________________
Delaware Department of Health and Social Services
21
Division of Public Health Bureau of Health Planning and Resources Management
May 2023
their homes, and they go to dental school within several hundred miles of where they attended
college. Just like in previous years, about 75 percent of those who graduated from high school
in Delaware attended a dental school in the region. This information may prove valuable to
recruiters.
Not all dentists have completed a residency program. Although Delaware law requires
that licensees have done so, there are two exceptions. Dentists who practiced for three years
elsewhere may be granted a waiver. In addition, there is a waiver for those who practiced
dentistry for two years while on active military duty. That explains, in part, the 93 and 97
percent completion rate (Figure 2.13).
Figure 2.13
Percentage of Dentists by Dental Residency Program
Completion and County, Delaware, 2022
Kent
New Castle
Sussex
Delaware
General/Pediatric
75.0
96.5
87.9
92.7
Specialist
100.0
95.0
100.0
96.6
0
20
40
60
80
100
Percentage of Dentists
County/State
Source: Delaware Department of Health and Social Services, Division of Public Health, Delaware Dentist Survey
2022

Delaware Dentist Survey 2022 DEMOGRAPHICS –DENTISTS
_____________________________________________________________________________________
_____________________________________________________________________________________
Delaware Department of Health and Social Services
22
Division of Public Health Bureau of Health Planning and Resources Management
May 2023
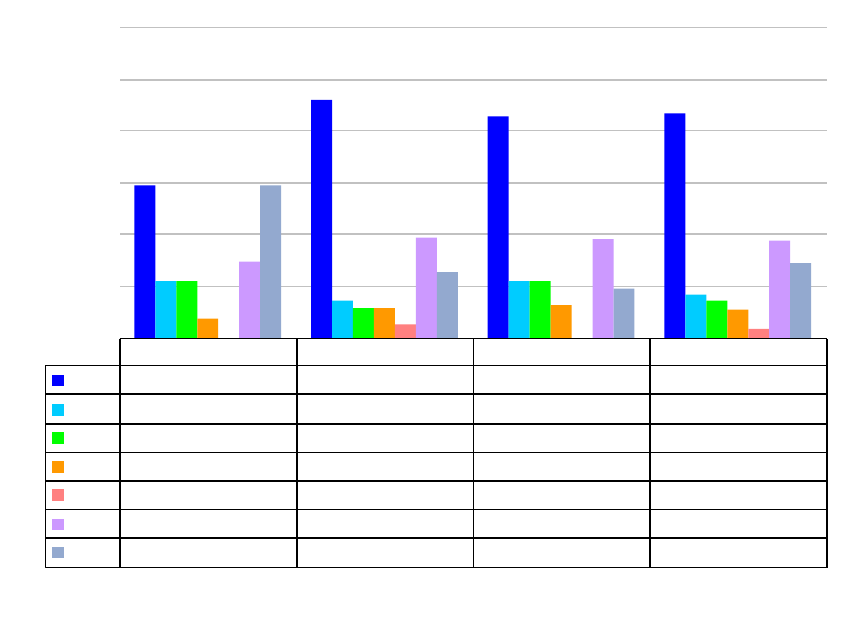
Figure 2.14
Percentage of Dentists by Type of Dental Residency Program
Attendance and County, Delaware, 2022
Kent
New Castle
Sussex
Total
General (GPR)*
44.4
88.2
66.7
79.2
Advanced (AEGD)*
11.1
3.4
6.3
4.8
Specialized
37.0
13.1
15.9
16.7
Military
0.0
1.7
0.0
1.2
Other
0.0
0.0
6.3
1.0
0
20
40
60
80
100
Percentage of Dentists
County/State
*AEGD
- Advanced Education in General Dentistry
*GPR - Genral Practice Residency
Source: Delaware Department of Health and Social Services, Division of Public Health, Delaware Dentist Survey
2022
The types of dental residency programs varied widely within the state. First, fewer
dentists practicing in Kent County reported completing a general/pediatric dental residency (44
percent) than in the other two counties. Second, Kent County has the highest proportion (11
percent) of dentists who reported completing an Advanced Education in General Dentistry
(AEGD) residency program. Third, 37 percent of Sussex County dentists were more likely to
have completed a specialized dentistry residency program, compared to 13 percent of New
Castle County dentists and 16 percent of Sussex County dentists. Responses are tabulated only
for dentists who indicated having completed a residency. The totals will not add to 100 percent

Delaware Dentist Survey 2022 DEMOGRAPHICS –DENTISTS
_____________________________________________________________________________________
_____________________________________________________________________________________
Delaware Department of Health and Social Services
23
Division of Public Health Bureau of Health Planning and Resources Management
May 2023
because some dentists, particularly those with military service, reported more than one type of
residency
6
(Figure 2.14).
Figure 2.15
Number of Dental Specialists by County, Delaware, 2022
ENDO
OMS
ORTHO
PED DENT
PERIO
PROS
Kent
0
8
4
6
2
0
New Castle
4
10
14
11
9
4
Sussex
0
0
2
2
2
2
Delaware
4
18
20
19
13
6
0
5
10
15
20
25
Number of Specialists
Specialties
Note: Endodontics (ENDO); Oral and Maxillofacial Surgery (OMS); Orthodontics and
Dentofacial Orthopedics (ORTHO); Pediatric Dentistry (PED DENT); Periodontics (PERIO);
Prosthodontics (PROS)
Source: Delaware Department of Health and Social Services, Division of Public Health, Delaware Dentist Survey
2022
The number of specialist dentists is found in Figure 2.15. Those with a specialty in
pediatric dentistry are shown here even though they are included in the General/Pediatric
category for the FTE.FED calculation. This allows for an estimate of the number of active
providers specializing in pediatric dentistry in each county.
6
AEGD is not generally recognized as meeting the requirement of having had a residency for licensure in
the State of Delaware. However, it is included for reference purposes.
Delaware Dentist Survey 2022 DEMOGRAPHICS –DENTISTS
_____________________________________________________________________________________
_____________________________________________________________________________________
Delaware Department of Health and Social Services
24
Division of Public Health Bureau of Health Planning and Resources Management
May 2023
Dental specialists are more likely to practice in New Castle County than in Kent or
Sussex counties. Increasing specialists in areas of the state that lack dental specialist services
could be a focus of recruitment efforts.

Delaware Dentist Survey 2022 PRACTICE CHARACTERISTICS – DENTISTS
_____________________________________________________________________________________
_____________________________________________________________________________________
Delaware Department of Health and Social Services
25
Division of Public Health Bureau of Health Planning and Resources Management
May 2023
3. Practice Characteristics – Dentists
This section examines four practice characteristics of the 415 dentists actively practicing
in Delaware: broad attributes, accessibility, payment for services, and hiring qualified dental
staff.
Figure 3.1
Percentage of Dentists by Practice and County, Delaware, 2022
Kent
New Castle
Sussex
Delaware
Private Office
100.0
95.2
96.7
96.1
Clinic
0.0
2.0
3.3
2.0
Hospital
0.0
1.7
0.0
1.2
Other
0.0
1.0
0.0
0.7
0
20
40
60
80
100
Percentage of Dentists
County/State
Source: Delaware Department of Health and Social Services, Division of Public Health, Delaware Dentist Survey
2022
Respondents were asked about the setting of their primary employment (Figure 3.1).
The overwhelming majority of dentists are operating in private practitioners’ offices.
Dental practices are generally small, at least in terms of the number of dentists located
at the practice site (Figure 3.2). Statewide, practices reported an average of three

Delaware Dentist Survey 2022 PRACTICE CHARACTERISTICS – DENTISTS
_____________________________________________________________________________________
_____________________________________________________________________________________
Delaware Department of Health and Social Services
26
Division of Public Health Bureau of Health Planning and Resources Management
May 2023
general/pediatric dentists. Sussex County dentists report a relatively larger average number of
general/pediatric dentists per site.
Figure 3.2
Average Number of Dentists at the Primary Site by County, Delaware, 2022
Kent
New Castle
Sussex
Delaware
General/Pediatric
2.5
2.6
3.8
2.8
Specialist
3.0
1.9
1.0
2.1
0.0
0.5
1.0
1.5
2.0
2.5
3.0
Average Number of Dentists
County/State
Source: Delaware Department of Health and Social Services, Division of Public Health, Delaware Dentist Survey
2022
Another measure of size and capacity is the patient flow. The survey attempted to
measure this by asking for the number of weekly patient encounters by the dentists. Data were
collected for the total number of patient encounters, the number of patients for treatment,
post-treatment evaluation, and the number of hygiene patients. These data mirrored the
number of patient encounters by dentists (Figure 3.3).
On average, Delaware dentists see about 93 patients per week at their primary practice
location. In Kent County, general/pediatric dentists see an average of 99 patients per week,

Delaware Dentist Survey 2022 PRACTICE CHARACTERISTICS – DENTISTS
_____________________________________________________________________________________
_____________________________________________________________________________________
Delaware Department of Health and Social Services
27
Division of Public Health Bureau of Health Planning and Resources Management
May 2023
down from 109 patients per week in 2016 (Figure 3.3). Specialists in Kent County see about 85
patients per week, up from about 139 in 2016. In New Castle County, the average number of
patient encounters among general/pediatric dentists remained about the same (90). However,
the average number of patient encounters of specialists in New Castle County increased from
about 109 per week in 2016 to 136 per week in 2022. Sussex County’s general/pediatric
dentists see about 103 patients per week, compared to 106 per week in 2016. Specialists in
Sussex County report fewer patient encounters among Delaware’s counties: 85 per week in
2022, compared to 72 per week in 2016.
Figure 3.3
Mean Number of Weekly Patient Encounters of Dentists by County, Delaware,
2022
Kent
New Castle
Sussex
Delaware
General/Pediatric
99
90
103
93
Specialist
235
136
85
158
0
50
100
150
200
250
Mean number of encounters
County/State
Source: Delaware Department of Health and Social Services, Division of Public Health, Delaware Dentist Survey
2022

Delaware Dentist Survey 2022 PRACTICE CHARACTERISTICS – DENTISTS
_____________________________________________________________________________________
_____________________________________________________________________________________
Delaware Department of Health and Social Services
28
Division of Public Health Bureau of Health Planning and Resources Management
May 2023
The calculation of full-time equivalencies discussed in the first section made adjustments
for “auxiliaries” (dental hygienists and dental assistants) in determining the productivity of a
dentist. These resources are used to provide many dental services (e.g., teeth cleaning,
radiographs, etc.) that would otherwise have to be performed by the dentist. The utilization of
such resources is quite high, as shown in Figure 3.4.
Figure 3.4
Percentage of Non-Dentist Staff Use by County, Delaware, 2022
Kent
New Castle
Sussex
Delaware
General/Pediatric
Hygienists
100.0
95.7
100.0
96.9
General/Pediatric
Assistants
95.1
98.0
100.0
98.0
Specialist Hygienists
14.3
36.6
50.0
32.2
Specialist Assistants
100.0
90.0
100.0
93.0
0
20
40
60
80
100
Percentage of Staff Use
County/State
Source: Delaware Department of Health and Social Services, Division of Public Health, Delaware Dentist Survey
2022
Almost all dentists in Delaware use both dental assistants and hygienists to provide the
necessary services expected of a general dental practice. In fact, there is little difference in the
distributions between counties. The lower utilization of hygienists by dental specialists reflects
differences between the specialties and not a lack of interest in using non-dentist resources.
For example, a periodontist would rely heavily on hygienists, while an endodontist would not.

Delaware Dentist Survey 2022 PRACTICE CHARACTERISTICS – DENTISTS
_____________________________________________________________________________________
_____________________________________________________________________________________
Delaware Department of Health and Social Services
29
Division of Public Health Bureau of Health Planning and Resources Management
May 2023
Their use of dental assistants is comparable to the use of dental assistants in general/pediatric
dentistry. However, the use of Specialists Hygienists in Kent County is lower than in Sussex
and New Castle counties.
Figure 3.5
Percentage of Dentist Offices with Spoken Languages Other than English
by County, Delaware, 2022
Kent
New Castle
Sussex
Delaware
General/Pediatric
45.0
66.5
79.3
66.2
Specialist
100.0
55.0
50.0
64.3
0
20
40
60
80
100
Percentage of Dentist Offices
County/State
Source: Delaware Department of Health and Social Services, Division of Public Health, Delaware Dentist Survey
2022
To assess accessibility of dental services to non-English-speaking populations,
respondents were asked if languages other than English were spoken at their practice site
(Figure 3.5). Across the state, about 66 percent of general/pediatric dentists and about 64
percent of dental specialists report the capability of staff to communicate in a language other

Delaware Dentist Survey 2022 PRACTICE CHARACTERISTICS – DENTISTS
_____________________________________________________________________________________
_____________________________________________________________________________________
Delaware Department of Health and Social Services
30
Division of Public Health Bureau of Health Planning and Resources Management
May 2023
than English. Among general/pediatric dentists, the highest proportion reporting the ability to
communicate in languages other than English is in Sussex County (79 percent). Spanish was the
most frequently mentioned language.
Another dimension of accessibility to dental services is having non-traditional office
hours, offered other than 9:00 a.m. to 5:00 p.m., Monday through Friday. Respondents were
asked if they provided either Saturday or evening office hours (Figure 3.6).
Figure 3.6
Percentage of Dentists that Offer Saturday and/or Evening Hours
by County, Delaware, 2022
Kent
New Castle
Sussex
Delaware
General/Pediatric Evening
14.6
34.4
14.3
28.9
General/Pediatric Saturday
0.0
17.4
1.8
12.8
Specialist Evening
50.0
20.0
0.0
25.5
Specialist Saturday
14.3
12.5
0.0
12.3
0
20
40
60
80
100
Percentage of Dentists
County/State
Source: Delaware Department of Health and Social Services, Division of Public Health, Delaware Dentist Survey
2022

Delaware Dentist Survey 2022 PRACTICE CHARACTERISTICS – DENTISTS
_____________________________________________________________________________________
_____________________________________________________________________________________
Delaware Department of Health and Social Services
31
Division of Public Health Bureau of Health Planning and Resources Management
May 2023
Overall, general/pediatric dentists are more likely to offer non-traditional office hours
than specialists. Offering evening hours is roughly two times more common than providing
Saturday hours. Dentists in New Castle County are more likely to offer non-traditional hours
than dentists located in Kent County. Specialists in Kent County are more likely (50 percent)
to offer evening hours than specialists in New Castle or Sussex counties.
Figure 3.7
Percentage of Dentists Accepting New Patients
by County, Delaware, 2022
Kent
New Castle
Sussex
Delaware
General/Pediatric
85.4
96.7
94.5
95.0
Specialist
100.0
100.0
100.0
100.0
0
20
40
60
80
100
Percentage of Dentists
County/State
Source: Delaware Department of Health and Social Services, Division of Public Health, Delaware Dentist Survey
2022
A more direct measure of accessibility is whether dentists are accepting new patients.
Similar to the 2016 report, almost all dentists (generalists and specialists alike) are accepting

Delaware Dentist Survey 2022 PRACTICE CHARACTERISTICS – DENTISTS
_____________________________________________________________________________________
_____________________________________________________________________________________
Delaware Department of Health and Social Services
32
Division of Public Health Bureau of Health Planning and Resources Management
May 2023
new patients. Accessibility decreased in Kent County; in 2022, 85.4 percent of generalists were
accepting new patients, down from about 91 percent in 2016. In Sussex County, the
proportion of generalists accepting new patients decreased from 100 percent in 2016 to 95
percent in 2022. In New Castle County, the proportion of generalists accepting new patients is
virtually unchanged: 99 percent in 2016 to 97 percent in 2022. Among specialists in Kent and
Sussex counties, the rate of new patient acceptance remained unchanged (100 percent) since
2016. However, the acceptance of new patients by specialists increased in New Castle County
from 91.4 percent in 2016 to 100 percent in 2022.
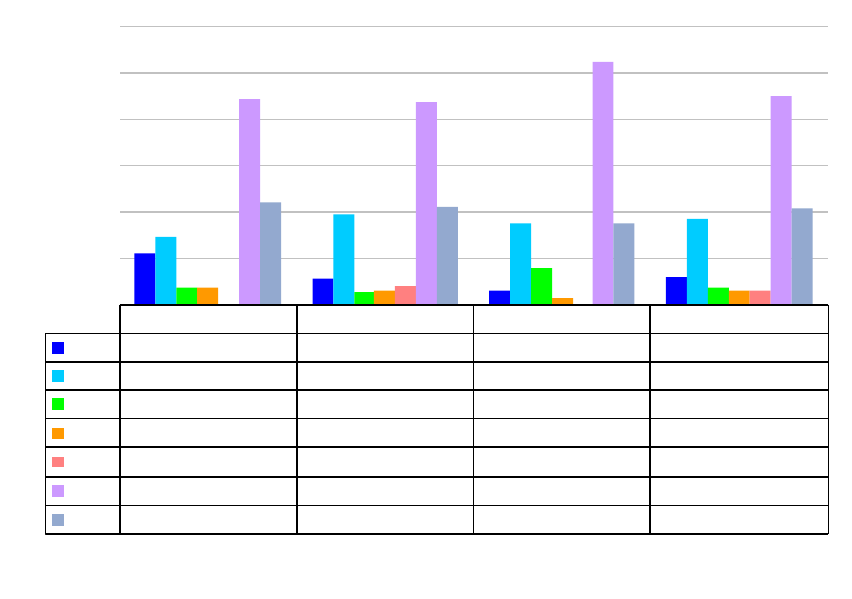
Figure 3.8
Average Wait Time in Days for Established and New Patients
reported by Dentists by County, Delaware, 2022
Kent
New Castle
Sussex
Delaware
General/Pediatric
Established
13.6
6.1
8.3
7.3
General/Pediatric New
25.7
9.3
34.0
15.2
Specialist Established
4.7
5.3
16.0
5.9
Specialist New
28.0
14.5
20.0
18.3
0
5
10
15
20
25
30
35
40
Average Number of Days
County/State
Source: Delaware Department of Health and Social Services, Division of Public Health, Delaware Dentist Survey
2022
Delaware Dentist Survey 2022 PRACTICE CHARACTERISTICS – DENTISTS
_____________________________________________________________________________________
_____________________________________________________________________________________
Delaware Department of Health and Social Services
33
Division of Public Health Bureau of Health Planning and Resources Management
May 2023
The “wait time,” or how long a person must wait for an appointment once they have
called the dentist’s office, varies significantly, depending on whether the problem is
characterized as an emergency. Most dentists leave openings to handle emergency cases.
Respondents were asked about “wait time” for non-emergency cases (Figure 3.8).
In 2022, wait times for new patients are generally longer than they are for existing
patients. New patients in Sussex County seeking an appointment with a dentist who provides
general/pediatric dental care will wait about 34 days, compared to 26 days in Kent County or
nine days in New Castle County. For a specialist dentist, new patients in Kent County waited
an average of 28 days, 20 days in Sussex County and 14.5 days in New Castle County.
Established patients in Kent and Sussex counties wait about five days to see a specialist, while in
Sussex County they wait about three times as long (16 days).

Delaware Dentist Survey 2022 PRACTICE CHARACTERISTICS – DENTISTS
_____________________________________________________________________________________
_____________________________________________________________________________________
Delaware Department of Health and Social Services
34
Division of Public Health Bureau of Health Planning and Resources Management
May 2023
Figure 3.9
Percentage of Dentists Serving Pediatric Patients by County, Delaware, 2022
Kent
New Castle
Sussex
Delaware
General/Pediatric
100.0
95.7
91.4
95.5
Specialist
100.0
84.2
100.0
89.1
0
20
40
60
80
100
Percentage of Dentists
County/State
Source: Delaware Department of Health and Social Services, Division of Public Health, Delaware Dentist Survey
2022
An overwhelming majority of dentists serve pediatric patients. However, Kent
County’s generalists stand out because 100 percent of the specialists in Kent County indicate
seeing pediatric patients, compared with 96 percent in New Castle and 91 percent in Sussex
County (Figure 3.9). The American Dental Association
7
and the American Academy of
Pediatric Dentistry
8
recommend that a child’s first dental checkup occur no later than her or his
first birthday. In Delaware, about 93 percent of dentists evaluate and/or treat children under
the age of 3 (up from 47 percent in 2016).
7
https://www.ada.org/sections/scienceAndResearch/pdfs/patient_11.pdf
8
http://www.aapd.org/resources/frequently_asked_questions/
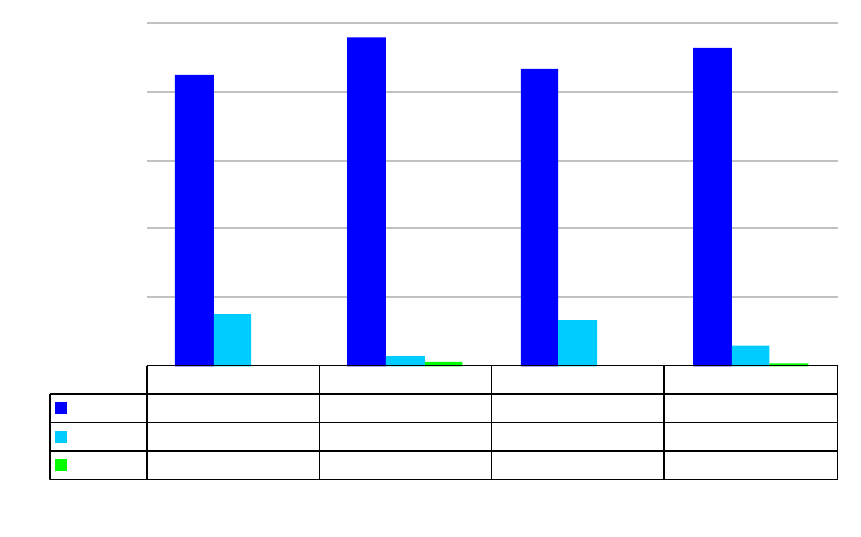
Delaware Dentist Survey 2022 PRACTICE CHARACTERISTICS – DENTISTS
_____________________________________________________________________________________
_____________________________________________________________________________________
Delaware Department of Health and Social Services
35
Division of Public Health Bureau of Health Planning and Resources Management
May 2023
Figure 3.10
Percentage of Dentists Reporting Beginning Age of Pediatric Patient Treatments
by Age and County, Delaware, 2022
Kent
New Castle
Sussex
Delaware
< 3 years
84.9
96.1
86.5
93.1
3 years
15.1
2.7
13.5
6.1
> 3 years
0.0
1.2
0.0
0.8
0
20
40
60
80
100
Percentage of Dentists
County/State
Source: Delaware Department of Health and Social Services, Division of Public Health, Delaware Dentist Survey
2022

Delaware Dentist Survey 2022 PRACTICE CHARACTERISTICS – DENTISTS
_____________________________________________________________________________________
_____________________________________________________________________________________
Delaware Department of Health and Social Services
36
Division of Public Health Bureau of Health Planning and Resources Management
May 2023
Figure 3.11
Percentage of Dentists Reporting Insurance Plans Participation by County,
Delaware, 2022
Kent
New Castle
Sussex
Delaware
General/Pediatric
100.0
84.6
86.2
86.6
Specialist
100.0
90.0
100.0
93.0
0
20
40
60
80
100
Percentage of Dentists
County/State
Source: Delaware Department of Health and Social Services, Division of Public Health, Delaware Dentist Survey
2022
Accessibility can be influenced by the acceptance of dental insurance plans.
Respondents were asked if they participated in such plans (Figure 3.11). Overall, more than 85
percent of dentists in Delaware indicate participating in a variety dental insurance programs,
including Medicaid and for-profit insurances.
The proportion of dentists accepting dental health insurance plans increased across all
counties. The proportion of Sussex County’s generalists who accept health insurance plans
increased from 75 percent in 2016 to 86 percent in 2022. At the same time, the proportion of
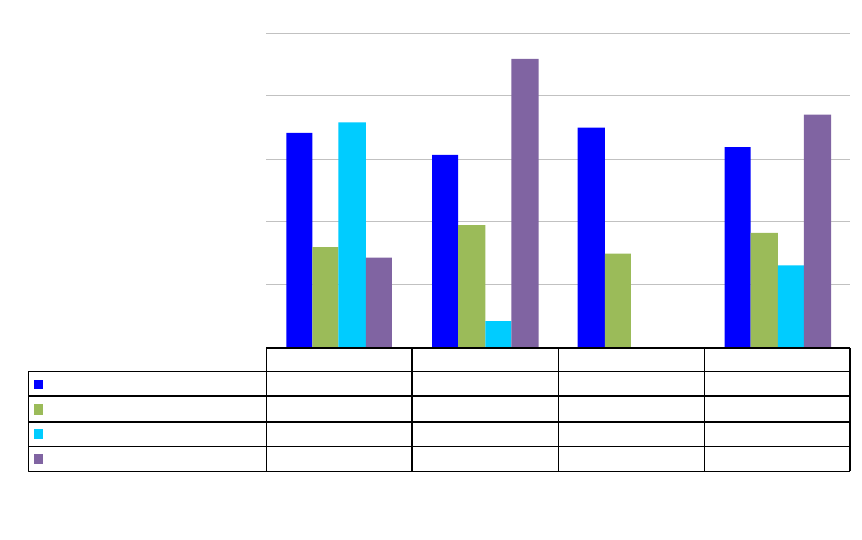
Delaware Dentist Survey 2022 PRACTICE CHARACTERISTICS – DENTISTS
_____________________________________________________________________________________
_____________________________________________________________________________________
Delaware Department of Health and Social Services
37
Division of Public Health Bureau of Health Planning and Resources Management
May 2023
specialists in Sussex County accepting health insurance plans increased from 85 percent 2016 to
100 in 2022.
Accessibility of dental services can also be influenced by the patient’s ability to pay for
services rendered. Respondents were next asked to indicate what types of insurance plans they
accepted (Figure 3.12).
Figure 3.12
Percentage of Dentists Reporting Participation in Medicaid and Non-Medicaid
Insurance Programs by County, Delaware, 2022
Kent
New Castle
Sussex
Delaware
General/Pediatric Medicaid
68.3
61.2
70.0
63.6
General/Pediatric Non-Medicaid
31.7
38.8
30.0
36.4
Specialist Medicaid
71.4
8.3
0.0
26.0
Specialist Non-Medica id
28.6
91.7
0.0
74.0
0
20
40
60
80
100
Percentage of Dentists
County/State
Source: Delaware Department of Health and Social Services, Division of Public Health, Delaware Dentist Survey
2022
The proportion of general/pediatric dentists accepting Medicaid consistently increased
between the 1998 and 2012 surveys but decreased in the 2016 survey. The situation in 2022
shows a marginal increase in Medicaid acceptance among general dentists (up from 62 in 2016
to 64) and a significant decrease among specialists (from 59 percent in 2016 to 26 percent in

Delaware Dentist Survey 2022 PRACTICE CHARACTERISTICS – DENTISTS
_____________________________________________________________________________________
_____________________________________________________________________________________
Delaware Department of Health and Social Services
38
Division of Public Health Bureau of Health Planning and Resources Management
May 2023
2022). The survey itself does not provide an explanation to this downturn. It remains to be
seen if this continues in future Delaware dental surveys.
Respondents were asked if they provided flexible payment plans or installment plans
(Figure 3.13). Dentists practicing in Sussex and New Castle counties are more likely than those
practicing in Kent County to provide flexible payment options. In Kent County, specialists are
less likely than their general/pediatric counterparts to provide such options. Overall, about 90
percent of all Delaware dentists offer flexible payment or installment plans for their patients.
Figure 3.13
Percentage of Dentists Providing Flexible Payment Options by County,
Delaware, 2022
Kent
New Castle
Sussex
Delaware
General/Pediatric
75.0
89.0
89.5
87.5
Specialist
85.7
94.7
100.0
92.7
0
20
40
60
80
100
Percentage of Dentists
County/State
Source: Delaware Department of Health and Social Services, Division of Public Health, Delaware Dentist Survey
2022

Delaware Dentist Survey 2022 PRACTICE CHARACTERISTICS – DENTISTS
_____________________________________________________________________________________
_____________________________________________________________________________________
Delaware Department of Health and Social Services
39
Division of Public Health Bureau of Health Planning and Resources Management
May 2023
Given that medically necessary dental care is not always affordable, the survey asked if
they provided any type of charity care. For purposes of this study, charity care is defined as
providing a service for which the dentist understood that he/she would not be paid. Bad debt
was excluded from the definition of charity care. About 77 percent of all dentists provide some
form of charity care in their offices, and specialists are more likely than general/pediatric
dentists to provide such care. This pattern is similar across the counties with the exception of
Sussex County. Only 50 percent of specialists in Sussex County provide charity care inside
their offices, compared to about 75 percent of general/pediatric dentists. In addition,
approximately 30 percent of dentists in Delaware provide charity care outside their offices,
presumably in clinics and other similar settings (Figure 3.14).
Figure 3.14
Percentage of Dentists Providing Charity Care In/Out of Office
by County, Delaware, 2022
Kent
New Castle
Sussex
Delaware
General/Pediatric Inside
50.0
72.7
70.7
69.8
General/Pediatric Outside
20.0
22.2
32.8
23.7
Specialist Inside
57.1
73.2
50.0
67.8
Specialist Outside
57.1
35.0
50.0
41.4
0
20
40
60
80
100
Percentage of Dentists
County/State
Source: Delaware Department of Health and Social Services, Division of Public Health, Delaware Dentist Survey
2022

Delaware Dentist Survey 2022 PRACTICE CHARACTERISTICS – DENTISTS
_____________________________________________________________________________________
_____________________________________________________________________________________
Delaware Department of Health and Social Services
40
Division of Public Health Bureau of Health Planning and Resources Management
May 2023
Survey respondents were next asked what proportion of their gross fees was
unreimbursed, including uncollectables, non-charity, or discounts. For generalist dentists, the
proportion of unreimbursable fees increased from about 3 percent in 2016 to about 11.5
percent in 2022. Specialists reported a similar increase in unreimbursable fees, from 4
percent in 2016 to about 17.5 percent in 2022. While the cause of these increases cannot
be ascertained from the current survey, it would be worthwhile to explore this phenomenon
in the next dental survey.
Figure 3.15
Percentage of Unreimbursed Gross Fees of Dentists, by County, Delaware, 2022
Kent
New Castle
Sussex
Delaware
General/Pediatric
11.5
12.0
9.0
11.5
Specialist
21.0
17.0
5.0
17.5
0
5
10
15
20
25
Percentage of Unreimbursed Gross Fees
County/State
Source: Delaware Department of Health and Social Services, Division of Public Health, Delaware Dentist Survey
2022

Delaware Dentist Survey 2022 PRACTICE CHARACTERISTICS – DENTISTS
_____________________________________________________________________________________
_____________________________________________________________________________________
Delaware Department of Health and Social Services
41
Division of Public Health Bureau of Health Planning and Resources Management
May 2023
For dentists to be highly productive, it is imperative that they obtain qualified hygienists,
dental assistants, and office staff. These health care workers are force multipliers and impact
the calculated federal FTE’s (FED.FTE). The first issue was to measure what percent of dentists
consider their facility to be fully staffed (Figure 3.16).
About 60 percent of general/pediatric dentists answered that their offices are fully
staffed by dental hygienists and dental assistants. The highest rate is measured among Kent
County’s specialist dentists where the percentage reporting being fully staffed stands at about 71
percent. General/pediatric dentists report worse staffing levels than the specialist dentists.
Staffing needs are different for specialists and general/pediatric dentists.
Figure 3.16
Percentage of Dentists Indicating Fully Staffed Offices (by Dental Hygienists and
Dental Assistants), by County, Delaware, 2022
Kent
New Castle
Sussex
Delaware
General/Pediatric
65.0
60.4
53.4
59.8
Specialist
71.4
63.2
50.0
64.3
0
20
40
60
80
100
Percentage of Dentists
County/State
Source: Delaware Department of Health and Social Services, Division of Public Health, Delaware Dentist Survey
2022

Delaware Dentist Survey 2022 PRACTICE CHARACTERISTICS – DENTISTS
_____________________________________________________________________________________
_____________________________________________________________________________________
Delaware Department of Health and Social Services
42
Division of Public Health Bureau of Health Planning and Resources Management
May 2023
Dentists were next asked to assess staffing levels for dentists in their practices (Figure 3.17).
Across Delaware, 90 percent of general/pediatric dentists and specialists reported being fully
staffed by dentists. Some variation among counties exists – 100 percent of specialists in Kent
and Sussex counties report being fully staffed by dentists. New Castle County has the highest
proportion of general/pediatric dentists (92.5 percent) reporting being fully staffed by dentists.
Figure 3.17
Percentage of Dentists Indicating Fully Staffed Offices (by Dentists)
by County, Delaware, 2022
Kent
New Castle
Sussex
Delaware
General/Pediatric
85.4
92.5
82.8
90.1
Specialist
100.0
87.5
100.0
91.2
0
20
40
60
80
100
Percentage of Dentists
County/State
Source: Delaware Department of Health and Social Services, Division of Public Health, Delaware Dentist Survey
2022
To assess the unfulfilled need for dental staff and the ability to fill open positions,
dentists were asked to report the last time they hired staff (Figure 3.18) and how long it took

Delaware Dentist Survey 2022 PRACTICE CHARACTERISTICS – DENTISTS
_____________________________________________________________________________________
_____________________________________________________________________________________
Delaware Department of Health and Social Services
43
Division of Public Health Bureau of Health Planning and Resources Management
May 2023
them to fill open positions (Figure 3.19). About 66 percent of dentists in Delaware hired a staff
member within six months. More than 77 percent of Kent County’s and 77 percent Sussex
County’s dentists hired new staff within the last six months. When hiring staff, 56 percent of
dentists reported being able to fill positions within two months and 32 percent reported filling
positions within two and four months.
Figure 3.18
Percentage of Dentists by Last Reported Hiring-Time of Staff by County, Delaware,
2022
Kent
New Castle
Sussex
Delaware
Within the past 6 months
77.4
61.1
77.4
65.7
Between 12 and 24 months
7.5
14.5
9.7
12.9
Between 12 and 24 months
11.3
11.5
4.8
10.5
More than 24 months ago
3.8
12.8
8.1
10.9
0
20
40
60
80
100
Percentage of Dentists
County/State
Source: Delaware Department of Health and Social Services, Division of Public Health, Delaware Dentist Survey
2022

Delaware Dentist Survey 2022 PRACTICE CHARACTERISTICS – DENTISTS
_____________________________________________________________________________________
_____________________________________________________________________________________
Delaware Department of Health and Social Services
44
Division of Public Health Bureau of Health Planning and Resources Management
May 2023
Figure 3.19
Percentage of Dentists Reporting How Long It Took to Hire Dental Staff by
County, Delaware 2022
Kent
New Castle
Sussex
Delaware
Less than 2 months
62.3
57.9
38.6
55.8
Between 2 to 4 months
34.0
29.3
43.9
31.9
Between 4 to 6 months
0.0
5.4
8.8
5.2
More than 6 months
3.8
7.4
8.8
7.1
0
20
40
60
80
100
Percentage of Dentists
County/State
Source: Delaware Department of Health and Social Services, Division of Public Health, Delaware Dentist Survey
2022
The survey inquired about any shortage of qualified dental staff (Figure 3.20). In 2022,
about 81 percent of general/pediatric dentists (up from 44 percent in 2016) and about 68
percent of specialists (up from 46 percent in 2016) report a perceived shortage of qualified
dental staff. The situation across counties varies; in New Castle and Sussex counties,
general/pediatric dentists are more likely (83 and 81 percent, respectively) to report shortages,
compared to their counterparts in Kent County (70 percent). About 100 percent of specialists
in Sussex County report a shortage of qualified dental staff, compared to 90 percent in Kent
County and 62 percent of specialists in New Castle County.

Delaware Dentist Survey 2022 PRACTICE CHARACTERISTICS – DENTISTS
_____________________________________________________________________________________
_____________________________________________________________________________________
Delaware Department of Health and Social Services
45
Division of Public Health Bureau of Health Planning and Resources Management
May 2023
Figure 3.20
Percentage of Dentists Indicating Perceived Shortage
of Qualified Dental Staff by County, Delaware, 2022
Kent
New Castle
Sussex
Delaware
General/Pediatric
70.0
82.8
81.0
81.1
Specialist
80.0
62.5
100.0
67.9
0
20
40
60
80
100
Percentage of Dentists
County/State
Source: Delaware Department of Health and Social Services, Division of Public Health, Delaware Dentist Survey
2022
The survey addressed the degree of difficulty in filling different categories of non-dentist
and dentist positions. It appears that Sussex County dentists have more difficulty filling hygienist
positions than the other counties but have the greatest success in hiring office staff positions (5
percent) compared to their counterparts in New Castle and Kent counties (23 percent and 25
percent, respectively). New Castle County dentists report having the least difficulty filling
dentist positions (4 percent), compared to 12 percent in Kent County and 21 percent in Sussex
County (Figure 3.21).

Delaware Dentist Survey 2022 PRACTICE CHARACTERISTICS – DENTISTS
_____________________________________________________________________________________
_____________________________________________________________________________________
Delaware Department of Health and Social Services
46
Division of Public Health Bureau of Health Planning and Resources Management
May 2023
Figure 3.21
Percentage of Dentist Reporting Most Difficult Positions to Fill
by County, Delaware, 2022
Kent
New Castle
Sussex
Delaware
Hygienist
23.1
28.7
41.0
29.8
Dental Assistant
42.3
42.2
32.8
40.8
Office Staff
23.1
24.7
4.9
21.5
Dentists
11.5
4.4
21.3
7.8
0
20
40
60
80
100
Percentage of Dentists
County/State
Source: Delaware Department of Health and Social Services, Division of Public Health, Delaware Dentist Survey
2022
A set of questions attempted to provide contextual data about services provided by
dentists. About a third of Delaware’s dentists reported open chair hours the week before they
completed the survey. Of these, 88 percent reported open chair hours due to cancellations
(Figure 3.22). The highest proportion (96 percent) of open chair hours due to cancellations
was among dentists from Kent County. Open chair hours in Delaware due to lack of demand
stood at 36 percent. More than 40 percent of New Castle County’s dentists reported open
chair hours due to lack of demand, closely followed by Kent County’s dentists (38 percent) and
a significantly lower proportion of Sussex County’s dentists (13 percent). About 26 percent of

Delaware Dentist Survey 2022 PRACTICE CHARACTERISTICS – DENTISTS
_____________________________________________________________________________________
_____________________________________________________________________________________
Delaware Department of Health and Social Services
47
Division of Public Health Bureau of Health Planning and Resources Management
May 2023
dentists in Delaware report open chair hours for reasons other than cancellations or lack of
demand.
Figure 3.22
Percentage of Dentists Reporting Open Chairs Due to Cancellation, Lack of
Demand, and Other Reasons, by County, Delaware, 2022
Kent
New Castle
Sussex
Delaware
Open Chairs due to
Cancellations
96.2
86.9
87.1
88.1
Open Chairs due to
Lack of Demand
37.7
40.7
12.9
36.4
Open Chairs due to
Other Reasons
15.1
26.3
33.9
26.0
0
20
40
60
80
100
Percentage of Dentists
County/State
Source: Delaware Department of Health and Social Services, Division of Public Health, Delaware Dentist Survey
2022
In 2022, the average number of open chair hours due to cancellations is 6.2 hours; due
to lack of demand, 6.1 hours; and due to other reasons, 4.3 hours (Figure 3.23). There is
minimal variation in open chair hours across counties. However, differences exist among
counties when considering open chair hours due to lack of demand. The highest number of
open chair hours due to lack of demand (6.3 hours) is reported by dentists from New Castle
County followed by dentists in Kent County (5.6 hours). Dentists from Sussex County
reported the lowest number of open chair hours due to lack of demand.

Delaware Dentist Survey 2022 PRACTICE CHARACTERISTICS – DENTISTS
_____________________________________________________________________________________
_____________________________________________________________________________________
Delaware Department of Health and Social Services
48
Division of Public Health Bureau of Health Planning and Resources Management
May 2023
Figure 3.23
Average Number of Open Chair Hours per week for Dentists with Open Chairs
Due to Cancellation, Lack of Demand, and Other Reasons, by County, Delaware,
2022
Kent
New Castle
Sussex
Delaware
Open Chairs due to
Cancellations
6.1
6.4
5.2
6.2
Open Chairs due to
Lack of Demand
5.6
6.3
3.1
6.1
Open Chairs due to
Other Reasons
2.0
4.5
4.2
4.3
0
1
2
3
4
5
6
7
8
9
10
Average Number of Hours per Week
County/State
Source: Delaware Department of Health and Social Services, Division of Public Health, Delaware Dentist Survey
2022
Sometimes dentists themselves have reasons to limit their time seeing patients (Figure
3.24). Fifty-seven percent of dentists reported limiting patient hours. The highest proportion
came from Kent County (62.3 percent); the lowest came from Sussex County (40 percent).
The primary reason for limiting seeing patients – limited staffing – was most often (32 percent)
reported in Sussex County. Too few patients seeking care was the primary reason (27 percent)
in New Castle County. Personal desire as a reason to limit patient encounters was most often
(15 percent) reported in Kent County.

Delaware Dentist Survey 2022 PRACTICE CHARACTERISTICS – DENTISTS
_____________________________________________________________________________________
_____________________________________________________________________________________
Delaware Department of Health and Social Services
49
Division of Public Health Bureau of Health Planning and Resources Management
May 2023
Figure 3.24
Percentage of Dentists by Reported Reasons/Limits to Seeing Patients,
by County, Delaware, 2022
Kent
New Castle
Sussex
Delaware
Limited Staffing
26.4
26.6
32.3
27.4
Too few patients seeking care
11.3
26.9
1.6
21.1
My personal desire to limit hours
15.1
11.4
3.2
10.7
Inability to find another dentist to
work with
7.5
2.0
8.1
3.6
Did not experience limited ability
to see patients
37.7
40.4
59.7
43.0
0
20
40
60
80
100
Percentage of Dentists
County/State
Source: Delaware Department of Health and Social Services, Division of Public Health, Delaware Dentist Survey
2022
Delaware Dentist Survey 2022 SPATIAL DISTRIBUTION – DENTISTS
_____________________________________________________________________________________
_____________________________________________________________________________________
Delaware Department of Health and Social Services
50
Division of Public Health Bureau of Health Planning and Resources Management
May 2023
4. Spatial Distribution – Dentists
In the first section of this report, Kent County was identified as an area having the
worst population-to-FTE.FED dentist ratio in 2022. In New Castle County, the population-to-
FTE.FED dentist ratio increased since 2016. In Sussex County, the ratio decreased since 2016.
The federal government recognizes the importance of having an adequate number of
dentists in areas smaller than states or counties. The federal guidelines governing the shortage
area designation program for dentally underserved areas and populations among others indicate:
(For an excerpt from the rule governing Health Professional Shortage Area (HPSA) designation,
see Appendix B.)
a) Rational areas for the delivery of primary dental care services can be counties, parts
of counties, and neighborhoods within metropolitan areas with a strong identity and
a population of 20,000.
b) In general, an underserved area will have a ratio of 5,000:1 or higher to qualify. The
population-to-dentist ratio is only one of the criteria used for shortage area
designation.
c) The distance criterion, which defines such areas in Delaware, is roughly 25 miles
between centers.
Good examples for such areas in Sussex County include Lewes/Rehoboth, Georgetown,
Milford, Millsboro, and Seaford. In Delaware, these general areas are census county divisions
(CCDs). The CCDs work well in Sussex County because of the distinct town centers. The
distinctions are not quite as clear in Kent County, where Dover and its suburbs are an
additional example to consider. The Smyrna and Harrington areas are the best examples of
distinct CCDs. Wilmington, Newark, New Castle, and Middletown are the most distinct areas,
although their suburban fringes are not well defined. However, Delaware’s 27 CCDs are the
most useful for the spatial examination presented in this report.
Delaware Dentist Survey 2022 SPATIAL DISTRIBUTION – DENTISTS
_____________________________________________________________________________________
_____________________________________________________________________________________
Delaware Department of Health and Social Services
51
Division of Public Health Bureau of Health Planning and Resources Management
May 2023
The spatial distribution of general/pediatric dentists relative to population CCD in
Delaware is found in Figure 4.1. The important areas to look at are those in shades of red.
Those in darkest red are too high with too few FTE dentists for the resident population. Figure
4.1 shows that New Castle County is generally well served by dentists, even though they are
unevenly distributed, with many located in northern New Castle County. While the distances
are short and certainly within the federal 25-mile criteria, there may still be reason for concern
as transportation, personal finances, and convenient office hours may be an access barrier to
some areas and among certain populations. There are no CCDs in New Castle County above
the 5,000:1 population to provider ratio (dark red), which would indicate a potential dental
shortage area. Four areas – the New Castle, Red Lion, Upper Christiana, and Lower Christiana
CCDs – are reporting no dentists. In the case of Red Lion, the population is too small to be
considered a rational service area. Lower Christiana’s population is already above 20,000 but
the perceived shortage is potentially alleviated by the surrounding CCDs. Also, Wilmington
seemingly has a sufficient supply of dentists, but those dentists also see patients from outside
the city. This may leave some patients with too few dentists to meet their needs.
Kent County has a very different profile. The majority of the dentists practicing in Kent
County appear to be focused in Smyrna and Dover. There are no dentists reporting in five
Kent County CCDs: Kenton, Central Kent, Felton, Harrington, and Milford North. Milford
North is the addition since 2016. With the exception of Dover (the pink area in the middle of
Kent County with a population of around 80,000), Smyrna (the red area north of Dover with a
population around 25,000), and Central Kent (the blank area south of Dover with a population
around 27,000), none of the other CCDs reach a population of 20,000; thus, they do not meet
the criteria for a rational service area and cannot be considered as separate HPSA areas.

Delaware Dentist Survey 2022 SPATIAL DISTRIBUTION – DENTISTS
_____________________________________________________________________________________
_____________________________________________________________________________________
Delaware Department of Health and Social Services
52
Division of Public Health Bureau of Health Planning and Resources Management
May 2023
Figure 4.1
Number of Persons per FTE General/Pediatric Dentists in Delaware 2022
by Census County Division
Source: Delaware Department of Health and Social Services, Division of Public Health, Delaware Dentist Survey
2022
Delaware Dentist Survey 2022 SPATIAL DISTRIBUTION – DENTISTS
_____________________________________________________________________________________
_____________________________________________________________________________________
Delaware Department of Health and Social Services
53
Division of Public Health Bureau of Health Planning and Resources Management
May 2023
Rehoboth CCD have an adequate supply of dentists. Two out of Sussex County’s nine CCDs
report no dentists, compared to 2016 when four CCDs reported no dentists. The Bridgeville-
Greenwood and Laurel-Delmar CCDs are currently without dentists. The Georgetown CCD
is on the verge of meeting the 5,000:1 ratio. Four areas (Seaford, Milton, Millsboro, and
Selbyville) exceed the federal guideline of 5,000:1.
In Figure 4.2, ratios are calculated by pooling the general/pediatric dentists and
specialists. However, the conclusions reached by pooling both types of dentists are essentially
the same as Figure 4.1, which depicts general/pediatric dentists only. Improvements in the FTE-
per-population ratio are observable in only four CCDs: Upper Christiana, Middletown, Dover,
and Rehoboth.

Delaware Dentist Survey 2022 SPATIAL DISTRIBUTION – DENTISTS
_____________________________________________________________________________________
_____________________________________________________________________________________
Delaware Department of Health and Social Services
54
Division of Public Health Bureau of Health Planning and Resources Management
May 2023
Figure 4.2
Number of Persons per Total Dentists (General/Pediatric FED.FTE & Specialist
FTE) in Delaware 2022 by Census County Division, Delaware, 2022
Source: Delaware Department of Health and Social Services, Division of Public Health, Delaware Dentist Survey
2022
Delaware Dentist Survey 2022 METHODOLOGY – DENTAL STUDENTS/RESIDENTS
_____________________________________________________________________________________
_____________________________________________________________________________________
Delaware Department of Health and Social Services
55
Division of Public Health Bureau of Health Planning and Resources Management
May 2023
5. Methodology – Dental Students/Residents Survey
In 2022 a new data collection effort was piloted, collecting data from dental students
and dental residents (students). The survey of dental students was fielded alongside of the
dentist survey. The dental student survey included sets of questions about demographics,
student debt burden, and dental licensing.
The method chosen to gather the information among dental students was a self-
administered online survey. The study population was defined as dental students and dental
residents who come from Delaware or who are currently in a residency program in Delaware.
To reach this population, the team (representatives from Delaware State Dental Society,
Division of Public Health, and the University of Delaware) that developed the questionnaire
used their professional and personal contacts to elicit responses from the target study
population. Additionally, directors of these programs were contacted with a request to
forward the questionnaire to eligible respondents.
While the exact size of the study population of students/residents is not exactly known,
the estimate produced by the study team suggested that between 30 and 50 individuals should
fit the definition of the study population. The survey was fielded from April to July of 2022. A
total of 29 responses were received. Out of these, seven were removed because they were
duplicates or they contained incomplete data.
The next two sections of the report present tabulations for respondents to the student
survey. Data presented here are unweighted and no effort is made to generalize the results to
anyone else but those who completed the survey.

Delaware Dentist Survey 2022 DEMOGRAPHICS – DENTAL STUDENTS/RESIDENTS
_____________________________________________________________________________________
_____________________________________________________________________________________
Delaware Department of Health and Social Services
56
Division of Public Health Bureau of Health Planning and Resources Management
May 2023
6. Demographics – Dental Students/Residents
Delaware’s dental students and dental residents answered a set of questions as they
pertain to their demographic characteristics. About 52 percent of dental students who
responded to the survey indicated that they are female (Figure 6.1).
Figure 6.1
Percentage of Dental Students/Residents by Gender, Delaware, 2022
Gender
Male
47.6
Female
52.4
0
20
40
60
80
100
Percentage of Dental Students/Residents
Gender
Source: Delaware Department of Health and Social Services, Division of Public Health, Delaware Dentist Survey
2022
About 24 percent of dental students/residents identified Hispanic (Figure 6.2). White
students represented the highest proportion of dental students and residents (62%) and Asian
and Pacific Islander and “Other” races were represented evenly at 19 percent each (Figure 6.3).
There were no Black respondents.

Delaware Dentist Survey 2022 DEMOGRAPHICS – DENTAL STUDENTS/RESIDENTS
_____________________________________________________________________________________
_____________________________________________________________________________________
Delaware Department of Health and Social Services
57
Division of Public Health Bureau of Health Planning and Resources Management
May 2023
Figure 6.2
Percentage of Dental Students/Residents by Hispanic Origin, Delaware, 2022
Hispanic Origin
Non-Hispanic
76.2
Hispanic
23.8
0
20
40
60
80
100
Percentage of Dental Students/Residents
Hispanic Origin
Source: Delaware Department of Health and Social Services, Division of Public Health, Delaware Dentist Survey
2022

Delaware Dentist Survey 2022 DEMOGRAPHICS – DENTAL STUDENTS/RESIDENTS
_____________________________________________________________________________________
_____________________________________________________________________________________
Delaware Department of Health and Social Services
58
Division of Public Health Bureau of Health Planning and Resources Management
May 2023
Figure 6.3
Percentage of Dental Students/Residents by Race, Delaware, 2022
Race
Caucasian or White
61.9
Asian or Pacific Islander
19.0
Other
19.0
African American or Black
0.0
Native American or Alaskan
0.0
Multi
-Racial
0.0
0
20
40
60
80
100
Percentage Dental Students/
Residents
Race
Source: Delaware Department of Health and Social Services, Division of Public Health, Delaware Dentist Survey
2022
To ascertain the state of origin of Delaware’s dental students/dental residents,
respondents were asked a set of questions. One hundred percent of the respondents indicated
that they graduated from a high school located in Delaware. One hundred percent of the
respondents indicated that they are currently completing or have completed a dental school in
Pennsylvania. About 81 percent of respondents indicated that they earned their undergraduate
degree in Delaware, 10 percent graduated from an undergraduate program in Virginia, and
about 5 percent respectively graduated from Florida and Pennsylvania (Figure 6.4).

Delaware Dentist Survey 2022 DEMOGRAPHICS – DENTAL STUDENTS/RESIDENTS
_____________________________________________________________________________________
_____________________________________________________________________________________
Delaware Department of Health and Social Services
59
Division of Public Health Bureau of Health Planning and Resources Management
May 2023
Figure 6.4
Percentage of Dental Students/Residents by State of Origin, Delaware, 2022
State of Residency at
the time of High
School Graduation
State of
Undergraduate
Degree
State of Dental School
Delaware
100.0
81.0
0.0
Pennsylvania
0.0
4.8
100.0
Virginia
0.0
9.5
0.0
Florida
0.0
4.8
0.0
0
20
40
60
80
100
Percentage of Dental Students/
Residents
Level of Schooling
Source: Delaware Department of Health and Social Services, Division of Public Health, Delaware Dentist Survey
2022
Dental students/residents were next asked to indicate if they expect to be active in
Clinical Dentistry five years from now (Figure 6.5). One hundred percent of respondents said
they plan to be active in clinical dentistry in five years.
Delaware Dentist Survey 2022 DEMOGRAPHICS – DENTAL STUDENTS/RESIDENTS
_____________________________________________________________________________________
_____________________________________________________________________________________
Delaware Department of Health and Social Services
60
Division of Public Health Bureau of Health Planning and Resources Management
May 2023
Figure 6.5
Percentage of Dental Students/Residents that Intend to be Active in Clinical
Dentistry in Five Years, Delaware, 2022
Active 5 years from now
Active 5 years from
now? - Yes
100.0
Active 5 years from
now? - No
0.0
0
20
40
60
80
100
Percentage of Dental Students/
Residents
Active 5 years from now
Source: Delaware Department of Health and Social Services, Division of Public Health, Delaware Dentist Survey
2022

Delaware Dentist Survey 2022 OUTLOOK AND LICENSURE-DENTAL STUDENTS/RESIDENTS
_____________________________________________________________________________________
_____________________________________________________________________________________
Delaware Department of Health and Social Services
61
Division of Public Health Bureau of Health Planning and Resources Management
May 2023
7. Outlook and Licensure – Dental Students/Residents
This section examines the responses of students/residents as they pertain to their
future work in the field of dentistry. As students decide where they locate their debt burden
likely plays a role in that decision. Students/residents were asked to estimate the student debt
they will have accrued by the time they finished their studies (Figure 7.1). About 62 percent of
respondents indicated that their student debt (undergraduate and dental school combined) will
be above $350,000. Only about 14 percent of students/residents will have a combined student
debt under $100,000 when they finish their studies.
Figure 7.1
Percentage of Dental Students’/Residents’ Estimated Student Debt
(Undergraduate and Dental School), Delaware, 2022
Student Debt Range
Under $100,000
14.3
$100,001 to $350,000
23.8
$350,001 to $450,000
38.1
$450,001 to $800,000
23.8
0
20
40
60
80
100
Percentage of Dental Students/
Residents
Student Debt Range
Source: Delaware Department of Health and Social Services, Division of Public Health, Delaware Dentist Survey
2022
The decision where to locate after graduation is an important one. About 67 percent
of responding students/residents have already made up their mind about where they will

Delaware Dentist Survey 2022 OUTLOOK AND LICENSURE-DENTAL STUDENTS/RESIDENTS
_____________________________________________________________________________________
_____________________________________________________________________________________
Delaware Department of Health and Social Services
62
Division of Public Health Bureau of Health Planning and Resources Management
May 2023
practice once they complete their studies (Figure 7.2). This leaves a sizable proportion that
might be open to discussions about future location – possibly a way to attract new dentists to
underserved areas. About 29 percent replied that they plan to practice in Delaware without
naming a municipality. About 20 percent plan to practice in and around Newark, 9 percent plan
to practice in Wilmington; 10 percent plan to practice in Southern Delaware; and 62 percent
are undecided – an opportunity to present areas with higher need (Figure 7.3).
Figure 7.2
Percentage of Dental Students/Residents by Decision on where they will Practice,
Delaware, 2022
Practice Decision
Yes - decided where to practice
66.7
No - did not decide where to practice
33.3
0
20
40
60
80
100
Percentage of Dental Students/
Residents
Practice Decision
Source: Delaware Department of Health and Social Services, Division of Public Health, Delaware Dentist Survey
2022

Delaware Dentist Survey 2022 OUTLOOK AND LICENSURE-DENTAL STUDENTS/RESIDENTS
_____________________________________________________________________________________
_____________________________________________________________________________________
Delaware Department of Health and Social Services
63
Division of Public Health Bureau of Health Planning and Resources Management
May 2023
Figure 7.3
Percentage of Dental Students/Residents by Location of Where They Intend to
Practice, Delaware 2022
City/State of Future Practice
Delaware (no city indicated)
28.6
Newark, Delaware
19.0
Wilmington, Delaware
9.5
Dagsboro, Delaware
4.8
Ocean View, Delaware
4.8
No decision made
33.3
0
20
40
60
80
100
Percentage of Demtal Students/
Residents
City/State of Future Practice
Source: Delaware Department of Health and Social Services, Division of Public Health, Delaware Dentist Survey
2022
The choice of practice type is an important factor that determines dentists’ access to
incentive programs that are designed to attract new providers to underserved areas. Some
support programs for dentists are limited to non-private providers, particularly Federally
Qualified Health Centers (FQHC), which are located primarily in underserved areas. About 67
percent of dental students/residents indicate that they intend to practice in private settings
(associateship or partner in a private practice). This leaves about 33 percent of Delaware’s
dental students/residents who could potentially consider practicing in an FQHC.

Delaware Dentist Survey 2022 OUTLOOK AND LICENSURE-DENTAL STUDENTS/RESIDENTS
_____________________________________________________________________________________
_____________________________________________________________________________________
Delaware Department of Health and Social Services
64
Division of Public Health Bureau of Health Planning and Resources Management
May 2023
Figure 7.4
Percentage of Dental Students/Residents by Type of Practice
They Intend to Go Into, Delaware. 2022
Type of Practice
No decision made
33.3
Associateship in a
private practice
38.1
Partner in a private
practice
28.6
0
20
40
60
80
100
Percentage of Dental Students/
Residents
Type of Practice
Source: Delaware Department of Health and Social Services, Division of Public Health, Delaware Dentist Survey
2022
Support programs intended to attract dentists
to underserved areas might be a way to
attract students to serve in those areas. Respondents were asked to indicate the importance of
student debt and the importance of loan repayment programs to their decision on where
practice. Seventy-six percent of Delaware’s dental students/residents indicated that student
debt plays a role (extremely important, utmost important, very important) in where they plan
to practice in the future (Figure 7.5). Only about 5 percent of respondents indicated that
student debt is not important when they think about where they decide to practice. Eighty-six
percent of respondents said a loan repayment program will have a ‘very important’ or
‘important’ role in their decision on future practice location (Figure 7.6).

Delaware Dentist Survey 2022 OUTLOOK AND LICENSURE-DENTAL STUDENTS/RESIDENTS
_____________________________________________________________________________________
_____________________________________________________________________________________
Delaware Department of Health and Social Services
65
Division of Public Health Bureau of Health Planning and Resources Management
May 2023
Figure 7.5
Percentage of Dental Students/Residents by Importance (Self Identified) of Student
Debt in Deciding Where They Will Practice, Delaware, 2022
Importance of Student Debt
Not Applicable
4.8
Extremely important
9.5
Utmost Importance
4.8
Very Important
61.9
Not Very Important
4.8
Somewhat Important
9.5
Not Important
4.8
0
20
40
60
80
100
Percentage of
Dental Students/
Residents
Importance of Student Debt
Source: Delaware Department of Health and Social Services, Division of Public Health, Delaware Dentist Survey
2022

Delaware Dentist Survey 2022 OUTLOOK AND LICENSURE-DENTAL STUDENTS/RESIDENTS
_____________________________________________________________________________________
_____________________________________________________________________________________
Delaware Department of Health and Social Services
66
Division of Public Health Bureau of Health Planning and Resources Management
May 2023
Figure 7.6
Percentage of Dental Students/Residents by Importance of the Loan Repayment
Program in Deciding Where They Will Practice, Delaware, 2022
Importance of Loan Repayment Program
Very Important
61.9
Important
23.8
Neutral
4.8
Not so Important
4.8
Not Important at all
4.8
0
20
40
60
80
100
Percentage of
Dental Students/
Residents
Importance of Loan Repayment Program
Source: Delaware Department of Health and Social Services, Division of Public Health, Delaware Dentist Survey
2022
Table 7.1
Percentage of Dental Students/Residents by Ranked Factors of Importance in
Deciding Where They Will Practice, Delaware, 2022
Most
Important
Important
Somewhat
Important
Neutral
Somewhat
Unimportant
Unimportant
Least
Important
Money/debt burden 61.9 14.3 19.0 0.0 4.8 0.0 0.0
Being Close to Family 28.6 47.6 9.5 9.5 4.8 0.0 0.0
Ease to Obtain Initial License 9.5 9.5 9.5 28.6 14.3 9.5 19.0
Type/Care Profile 9.5 52.4 19.0 9.5 4.8 0.0 4.8
Community/Perceived Quality of Life 19.0 42.9 38.1 0.0 0.0 0.0 0.0
School System 9.5 14.3 28.6 14.3 4.8 19.0 9.5
Source: Delaware Department of Health and Social Services, Division of Public Health, Delaware Dentist Survey
2022
Delaware Dentist Survey 2022 OUTLOOK AND LICENSURE-DENTAL STUDENTS/RESIDENTS
_____________________________________________________________________________________
_____________________________________________________________________________________
Delaware Department of Health and Social Services
67
Division of Public Health Bureau of Health Planning and Resources Management
May 2023
In addition to student debt and the loan repayment program, respondents evaluated
additional factors that might impact their choice of location after completing dental school,
including: being close to family; ease of obtaining license; type of care/care profile; and
perception of quality of life and the school system (Table 7.1). Sixty-two percent of
respondents indicated that money/debt burden plays the most important role in their location
decision. Being close to family is most important to 29 percent of respondents and important
to 48 percent of survey participants; and ease of obtaining a license is least important to 19
percent of respondents (highest proportion for all factors). Type of care profile is an important
factor to 52 percent of students/residents. Community/quality of life is most important to 19
percent and important to 43 percent of students/residents. The quality of a school system is
‘Somewhat Unimportant, Unimportant, or Least Important’ to 33 percent of the respondents.
Fourteen percent consider the school system a neutral factor and about 53 percent consider
school an important factor in their decision on where to practice in the future.
Students/residents were next asked a set of questions regarding licensing in general and
licensing in Delaware. Students were asked to indicate their own perception of General
Practice Residency (GPR) and Advanced Education (AEGD). About 90 percent of
students/residents indicated that they see the value of learning more before going into practice
(Figure 7.7). About 10 percent indicated that they will be going into a specialty. None of the
respondents indicated that they have learned enough and do not need either a GPR or an
AEGD.

Delaware Dentist Survey 2022 OUTLOOK AND LICENSURE-DENTAL STUDENTS/RESIDENTS
_____________________________________________________________________________________
_____________________________________________________________________________________
Delaware Department of Health and Social Services
68
Division of Public Health Bureau of Health Planning and Resources Management
May 2023
Figure 7.7
Percentage of Dental Students/Residents by Own Perception of General Practice
Residency (GPR) and Advanced Education (AEGD), Delaware, 2022
Perception of GPR and AEGD
I see the value of learning more
before going into practice.
90.5
I plan on going into a specialty.
9.5
I have learned enough in school
and do not need a GPR.
0
I have learned enough in school
and do not need a AEGD.
0
0
20
40
60
80
100
Percentage of
Dental Students/
Residents
Perception of GPR and AEGD
Source: Delaware Department of Health and Social Services, Division of Public Health, Delaware Dentist Survey
2022
Dental licensure examinations was another subject for the students (Figure 7.8). About
14 percent of respondents agreed with the statements: “The Licensure Examinations in
General are Unfair” and “The Delaware Licensure Examination is Unfair.” However, 52 percent
of respondents disagreed with the statement that the licensure examinations mentioned above
are unfair. About a third of the students/residents have not thought about the fairness of
licensure examinations. About 81 percent of students/residents agreed with the statement that
“I am Confident that I am Prepared to Take any Licensure Exam.”

Delaware Dentist Survey 2022 OUTLOOK AND LICENSURE-DENTAL STUDENTS/RESIDENTS
_____________________________________________________________________________________
_____________________________________________________________________________________
Delaware Department of Health and Social Services
69
Division of Public Health Bureau of Health Planning and Resources Management
May 2023
Figure 7.8
Percentage of Dental Students/Residents by Agreement or Disagreement with
Statements Relating to Dental Licensure Examinations, Delaware, 2022
Licensure
Examination
s in General
are Unfair
The
Delaware
Licensure
Examination
is Unfair
I am
Confident
that I am
Prepared to
Take any
Licensure
Exam
Agree
14.3
14.3
81.0
Disagree
52.4
52.4
0.0
Don't know or have not thought
about it
33.3
33.3
19.0
0
20
40
60
80
100
Percentage of Dental Students/
Residents
Perception of Licensure Examinations
Source: Delaware Department of Health and Social Services, Division of Public Health, Delaware Dentist Survey
2022
Students/residents were asked to indicate the type of clinical licensing they plan to
obtain within one to two years of graduation (Figure 7.9). They were also asked to list the
state or combination of states where they plan to get licensed (Figure 7.10). The most
common clinical licensing that students plan to obtain is the State license (48 percent). About
19 percent plan to pursue a Commission on Dental Competency Assessment (CDCA). In
terms of state licensing, 72 percent of students/residents plan to obtain a license in Delaware
and an additional 8 percent plan to obtain dual licenses in Delaware and Pennsylvania.

Delaware Dentist Survey 2022 OUTLOOK AND LICENSURE-DENTAL STUDENTS/RESIDENTS
_____________________________________________________________________________________
_____________________________________________________________________________________
Delaware Department of Health and Social Services
70
Division of Public Health Bureau of Health Planning and Resources Management
May 2023
Figure 7.9
Percentage of Dental Students/Residents by the Type of Clinical Licensing They
Plan to Obtain within 1-2 Years of Graduation, Delaware, 2022
Type of Licensing Exam Planned
Central Regional Dental Testing
Service (CRDTS)
4.8
Central Regional Dental Testing
Service (CRDTS) and State license
4.8
Commission on Dental
Competency Assessments
(CDCA, formerly the NERB)
9.5
Commission on Dental
Competency Assessments
(CDCA, formerly the NERB) and
State license
19
State license
47.6
Skipped Question
14.3
0
20
40
60
80
100
Percentage of
Dental Students/
Residents
Type of Licensing Exam Planned
Source: Delaware Department of Health and Social Services, Division of Public Health, Delaware Dentist Survey
2022

Delaware Dentist Survey 2022 OUTLOOK AND LICENSURE-DENTAL STUDENTS/RESIDENTS
_____________________________________________________________________________________
_____________________________________________________________________________________
Delaware Department of Health and Social Services
71
Division of Public Health Bureau of Health Planning and Resources Management
May 2023
Figure 7.10
Percentage of Dental Students/Residents by the State License They Plan to Obtain,
Delaware, 2022
State of future Licensure
Delaware
71.4
Delaware and Maryland and
Pennsylvania
4.8
Pennsylvania and Delaware
4.8
Unsure
4.8
Skipped Question
14.3
0
20
40
60
80
100
Percentage of
Dental Students/
Residents
State of future license
Source: Delaware Department of Health and Social Services, Division of Public Health, Delaware Dentist Survey
2022
Students/residents were next asked to evaluate potential concerns/challenges when
thinking about the Delaware Licensing Exam (Figure 7.11). An overwhelming majority of
respondents (88 percent) indicated potential concerns with securing patients for the exam.
About 59 percent had concerns with paying patients to participate in the exam. About 53
percent were concerned with potentially postponing care so patients can participate as exam
board patients. Almost 50 percent saw a potential for an incomplete treatment of patients
during board licensing examinations, and 35 percent perceived a challenge with arranging
transportation for patients.

Delaware Dentist Survey 2022 OUTLOOK AND LICENSURE-DENTAL STUDENTS/RESIDENTS
_____________________________________________________________________________________
_____________________________________________________________________________________
Delaware Department of Health and Social Services
72
Division of Public Health Bureau of Health Planning and Resources Management
May 2023
Figure 7.11
Percentage of Dental Students/Residents by Concerns Identified When Thinking
about the Delaware Licensing Exam, Delaware, 2022
Challenges with Licensing
General Challenge to Secure
Patients
88.2
Students Paying Patients to
Participate
58.8
Postponing Patient Care to Use as
Board Patient
52.9
Incomplete Treatment of Patients
47.1
Students Transporting Patients
35.3
0
20
40
60
80
100
Percentage of
Dental Students/
Residents
Challenges with Licensing
Source: Delaware Department of Health and Social Services, Division of Public Health, Delaware Dentist Survey
2022
Delaware Dentist Survey 2022 APPENDIX
_____________________________________________________________________________________
_____________________________________________________________________________________
Delaware Department of Health and Social Services
73
Division of Public Health Bureau of Health Planning and Resources Management
May 2023
Appendix A
Dentists Survey Questionnaire

Delaware Dentist Survey 2022 APPENDIX
_____________________________________________________________________________________
_____________________________________________________________________________________
Delaware Department of Health and Social Services
74
Division of Public Health Bureau of Health Planning and Resources Management
May 2023

Delaware Dentist Survey 2022 APPENDIX
_____________________________________________________________________________________
_____________________________________________________________________________________
Delaware Department of Health and Social Services
75
Division of Public Health Bureau of Health Planning and Resources Management
May 2023

Delaware Dentist Survey 2022 APPENDIX
_____________________________________________________________________________________
_____________________________________________________________________________________
Delaware Department of Health and Social Services
76
Division of Public Health Bureau of Health Planning and Resources Management
May 2023

Delaware Dentist Survey 2022 APPENDIX
_____________________________________________________________________________________
_____________________________________________________________________________________
Delaware Department of Health and Social Services
77
Division of Public Health Bureau of Health Planning and Resources Management
May 2023

Delaware Dentist Survey 2022 APPENDIX
_____________________________________________________________________________________
_____________________________________________________________________________________
Delaware Department of Health and Social Services
78
Division of Public Health Bureau of Health Planning and Resources Management
May 2023

Delaware Dentist Survey 2022 APPENDIX
_____________________________________________________________________________________
_____________________________________________________________________________________
Delaware Department of Health and Social Services
79
Division of Public Health Bureau of Health Planning and Resources Management
May 2023
Delaware Dentist Survey 2022 APPENDIX
_____________________________________________________________________________________
_____________________________________________________________________________________
Delaware Department of Health and Social Services
80
Division of Public Health Bureau of Health Planning and Resources Management
May 2023
Appendix B
Dental Health Professional Shortage Area Designation Criteria
(excerpt)
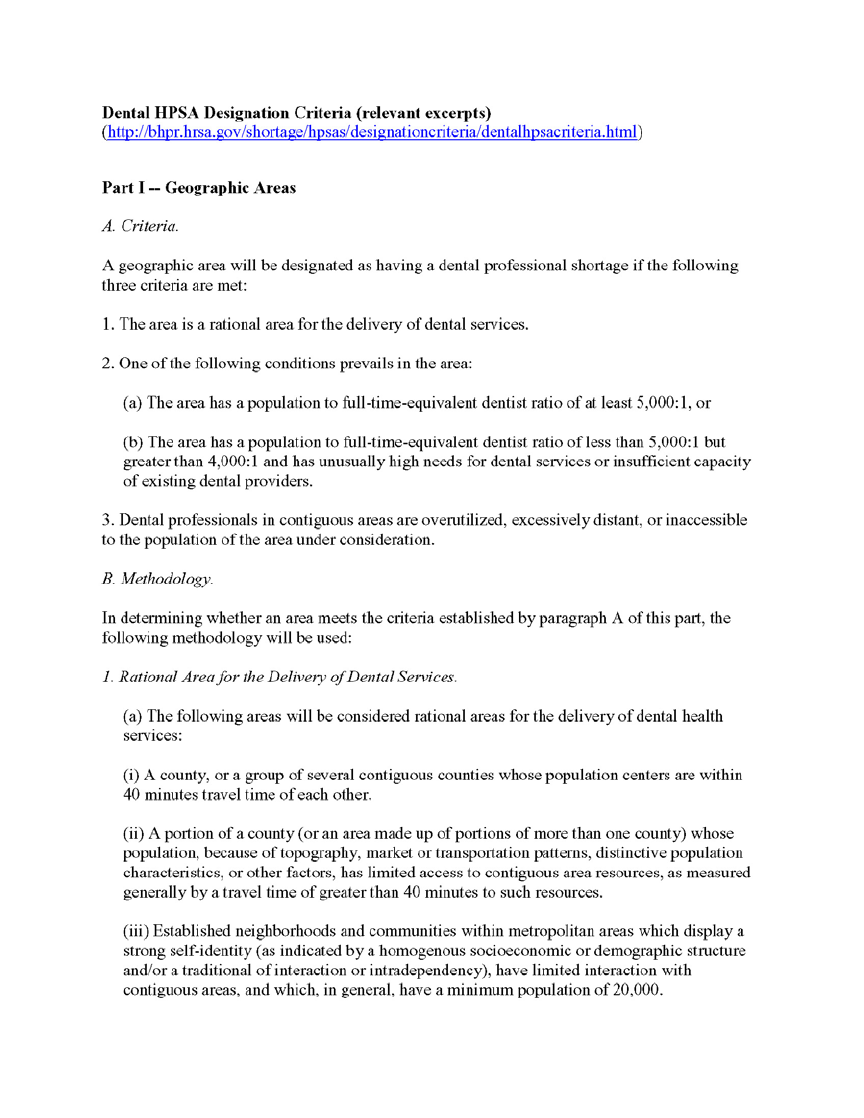
Delaware Dentist Survey 2022 APPENDIX
_____________________________________________________________________________________
_____________________________________________________________________________________
Delaware Department of Health and Social Services
81
Division of Public Health Bureau of Health Planning and Resources Management
May 2023

Delaware Dentist Survey 2022 APPENDIX
_____________________________________________________________________________________
_____________________________________________________________________________________
Delaware Department of Health and Social Services
82
Division of Public Health Bureau of Health Planning and Resources Management
May 2023

Delaware Dentist Survey 2022 APPENDIX
_____________________________________________________________________________________
_____________________________________________________________________________________
Delaware Department of Health and Social Services
83
Division of Public Health Bureau of Health Planning and Resources Management
May 2023

Delaware Dentist Survey 2022 APPENDIX
_____________________________________________________________________________________
_____________________________________________________________________________________
Delaware Department of Health and Social Services
84
Division of Public Health Bureau of Health Planning and Resources Management
May 2023

Delaware Dentist Survey 2022 APPENDIX
_____________________________________________________________________________________
_____________________________________________________________________________________
Delaware Department of Health and Social Services
85
Division of Public Health Bureau of Health Planning and Resources Management
May 2023
Delaware Dentist Survey 2022 APPENDIX
_____________________________________________________________________________________
_____________________________________________________________________________________
Delaware Department of Health and Social Services
86
Division of Public Health Bureau of Health Planning and Resources Management
May 2022
Appendix C
Dental Student and Resident Survey Questionnaire

Delaware Dentist Survey 2022 APPENDIX
_____________________________________________________________________________________
_____________________________________________________________________________________
Delaware Department of Health and Social Services
87
Division of Public Health Bureau of Health Planning and Resources Management
May 2022

Delaware Dentist Survey 2022 APPENDIX
_____________________________________________________________________________________
_____________________________________________________________________________________
Delaware Department of Health and Social Services
88
Division of Public Health Bureau of Health Planning and Resources Management
May 2022

Delaware Dentist Survey 2022 APPENDIX
_____________________________________________________________________________________
_____________________________________________________________________________________
Delaware Department of Health and Social Services
89
Division of Public Health Bureau of Health Planning and Resources Management
May 2022

Delaware Dentist Survey 2022 APPENDIX
_____________________________________________________________________________________
_____________________________________________________________________________________
Delaware Department of Health and Social Services
90
Division of Public Health Bureau of Health Planning and Resources Management
May 2022

Delaware Dentist Survey 2022 APPENDIX
_____________________________________________________________________________________
_____________________________________________________________________________________
Delaware Department of Health and Social Services
91
Division of Public Health Bureau of Health Planning and Resources Management
May 2022

Delaware Dentist Survey 2022 APPENDIX
_____________________________________________________________________________________
_____________________________________________________________________________________
Delaware Department of Health and Social Services
92
Division of Public Health Bureau of Health Planning and Resources Management
May 2022

Delaware Dentist Survey 2022 APPENDIX
_____________________________________________________________________________________
_____________________________________________________________________________________
Delaware Department of Health and Social Services
93
Division of Public Health Bureau of Health Planning and Resources Management
May 2022
