
City of Portland
Flood Hazard-Specific
Appendix to the Basic
Emergency Operations Plan
PORTLAND BUREAU OF EMERGENCY MANAGEMENT
Ted Wheeler, Mayor • Courtney Patterson, Interim Director
9911 SE Bush Street, Portland, OR 97266 • (503) 823-4375 • Fax (503) 823-3903 • TTY (503) 823-6868
Updated
MAY 2018
ACKNOWLEDGEMENTS
CITY OF PORTLAND
Bureau of Transportation
Corey Maciulewicz, Chris Spencer, Rich Grant,
Steve Townsen, Cameron Glasgow, Doug Hight,
Scott Clement, Keri Munson
Bureau of Environmental Services
Kate Carone, Ronnie Mompellier
Portland Parks and Recreation
Emily Roth, Jennifer Trimm, Matt Hill, Don Athey
Portland Fire and Rescue
Laurent Picard, Don Russ
Portland Police
Tony Zanetti
Attorney
Franco Lucchin
Water Bureau
Kim Anderson
Joint Oce of Homeless Services
April Rohman
Bureau of Emergency Management
Jonna Papaefthimiou, Courtney Patterson,
Katy Wolf, Angela Carkner*, Dan Douthit
MULTNOMAH COUNTY
Emergency Management
Amy Haase, Alice Busch
Sheri’s Oce
Marc Shrake
REGIONAL AGENCIES
Multnomah County Drainage District
Angela Carkner*
Port of Portland
Kori Nobel
National Weather Service
Andy Bryant
United States Geological Survey
Adam Stonewall
United States Coast Guard
Randy Clark
United States Army Corps of Engineers
Paul Jewell
* Represented both PBEM and MCDD.
TABLE OF CONENTS
INTRODUCTION ................................................................................1
• Purpose ...............................................................................1
• Scope .................................................................................1
• Objectives .............................................................................2
• Situation ..............................................................................2
• Assumptions. . . . . . . . . . . . . . . . . . . . . . . . . . . . . . . . . . . . . . . . . . . . . . . . . . . . . . . . . . . . . . . . . . . . . . . . . . . 8
ROLES AND RESPONSIBILITIES
..................................................................9
CONCEPT OF OPERATIONS
....................................................................13
• Phased Operations ....................................................................13
• Monitoring ...........................................................................16
• Phase 1 | High Water/Pre-Flooding and Early Flooding. . . . . . . . . . . . . . . . . . . . . . . . . . . . . . . . . . 17
• Phase 2 | Minor Flooding ..............................................................20
• Phase 3 | Moderate Flooding ..........................................................23
• Phase 4 | Major Flooding ..............................................................26
• Phase 5 | Historic Flooding ............................................................29
• Phase 6 | Recovery ....................................................................31
DIRECTION AND CONTROL
....................................................................34
PLAN DEVELOPMENT AND MAINTENANCE
....................................................34
AUTHORITIES AND REFERENCES
...............................................................35

PBEM | Flood Hazard-Specic Appendix Page 1 of 36
INTRODUCTION
PURPOSE
The Flood Hazard-Specic Appendix (Appendix)
provides an overview of the triggers, responsibilities,
and authorities of City bureaus during a ood
emergency, and describes how the City intends to work
with partner agencies and jurisdictions for eective
incident management. This Appendix does not
guarantee that the actions in this plan will be carried
out in the order listed, or at all. Response will depend
on the needs of the incident and available resources.
SCOPE
This Appendix augments the City of Portland’s Basic
Emergency Operations Plan (BEOP) with information
and procedures that are specic to ooding, and
applies to all City bureaus. The Portland Bureau of
Transportation (PBOT) serves as the lead response
bureau, providing incident command for emergency
ood response. Regional partners for ood response
include the Multnomah County Drainage District
(MCDD), Port of Portland, United States Coast Guard
(USCG) Sector Columbia River, United States Army
Corps of Engineers (USACE), Multnomah County, the
Joint Oce of Homeless Services (JOHS), and the
National Weather Service (NWS).
Other plans and procedures may be activated while
responding to a ood, such as the Alert and Warning
Annex, Evacuation Annex, or Mass Shelter Plan. If
additional plans are activated at the same time, the
thresholds for response activities (e.g. shelter) may
shift to reect those procedures. Urban and minor
ooding is addressed through normal operations of
several bureaus. There are also plans that work to
reduce risk of ooding, such as the Mitigation Action
Plan, plans for individual facilities, and plans regarding
dam maintenance and operation. While these plans are
an important part of the larger picture regarding
ooding, they are separate and outside the scope of
this Appendix.

PBEM | Flood Hazard-Specic Appendix Page 2 of 36
OBJECTIVES
The objectives of this Appendix are to:
maximize life safety of responders and
the public by preventing life-threatening situations
and rescuing people in life-threatening situations;
stabilize the incident by employing protective
measures to minimize eects; and
protect property and the environment
through ood-ghting activities.
SITUATION
Portland is subject to ooding from rivers (Columbia
and Willamette), creeks (Johnson, Fanno, Tryon, and
others), and stormwater systems that become blocked
or overwhelmed. Riverine ooding is typically caused by
spring snowmelt and/or intense rainstorms. The ood
season for Portland extends from late October through
May. Historically, most ooding occurs in December,
January, and February. The most signicant ood threats
to Portland are from the Columbia River, Willamette
River, and Johnson Creek, which are detailed further
below and highlighted in Map 1. Beyond these threats,
urban ooding can also occur when storm drains are
blocked (e.g. by leaves or other debris) or when the
sewer system becomes overwhelmed.
Flood Data
Flooding is measured in dierent ways by dierent
agencies. The Federal Emergency Management Agency
(FEMA) develops oodplain maps (which provide the
basis for Map 1) using historic data, which are primarily
used for ood insurance purposes. These maps use
terms such as the 1% annual chance ood (sometimes
called the 100-year ood), the Special Flood Hazard Area
(sometimes called the oodplain, or the area susceptible
to the 1% annual chance ood), and the 0.2% annual
chance ood (sometimes called the 500-year ood).
MAP 1 | 1% AND 0.2% ANNUAL CHANCE FEMA FLOOD ZONE

PBEM | Flood Hazard-Specic Appendix Page 3 of 36
Flooding is also measured by the United States
Geologic Survey (USGS) and the National Weather
Service (NWS), which track water elevations, volume,
and temperature using stationary gauges
1
in water
channels (see Figure 1), and issue ood watches and
warnings. Flood watches indicate that conditions are
favorable for ooding, while ood warnings indicate
that ooding is imminent or occurring. The level of
ooding is then divided into minor, moderate, and
major ood stages. These ood stages do not align
with FEMA’s 1% or 0.2% annual chance oods. Minor
ooding generally indicates minimal to no property
damage, but can still present a life safety concern,
particularly for community members camping in a
oodplain. Moderate ooding generally indicates
inundation of some structures and roads, while major
ooding indicates extensive inundation of structures
and roads. Regardless of the impact to structures, all
stages of ooding can require some amount of public
warning, evacuation, and/or sheltering.
The NWS uses a specic geodetic datum (a coordinate
system for describing geographic locations) to
communicate the elevations of their gauge readings.
This datum is published and highly accessible, and is
the default datum for this plan. However, it is important
to note that other agencies and bureaus use dierent
datum for aspects of their work. The datum can be
converted using Table 1.
TABLE 1 | RIVER ELEVATION CONVERSION all elevations in feet, rounded to nearest 0.1'
FIGURE 1 | EXAMPLE HYDROGRAPH OF JOHNSON CREEK NEAR SYCAMORE
1
The USGS uses the spelling “gage,” however “gauge” is
used in this document as the more common spelling.
2
The National Geodetic Survey website http://www.
ngs.noaa.gov/faq.shtml provides additional conversion
information and guidance.
LOCATION NWS NGVD/MSL ODOT CITY OF PORTLAND PBOT, BES NAVD088 PWB, MCDD
Columbia
River Gauge
@ Vancouver
0.0 1.8 3.2 5.3
(1.8) 0.0 1.4 3.5
(3.2) (1.4) 0.0 2.1
(5.3) (3.5) (2.1) 0.0
Willammette
River Gauge
@ Morrison
0.0 1.6 2.9 5.3
(1.6) 0.0 1.4 3.5
(2.9) (1.4) 0.0 2.1
(5.0) (3.5) (2.1) 0.0

PBEM | Flood Hazard-Specic Appendix Page 4 of 36
Willamette River
Flooding on the Willamette River is relatively infrequent,
in large part due to dams and other infrastructure
upstream. Map 2 shows the FEMA 1% and 0.2% annual
chance ood zones for the Willamette River near
Downtown Portland, and the location of the NWS
gauge at Morrison Bridge. Historic crests have been 33
feet in 1894, 30 feet in 1948, and 29.8 feet in 1964. Most
of the highest oods occurred before the regional dam
system was fully constructed, which reduced ood risk.
The most recent ood was in 1996 and crested at 28.55
feet. While this ood was considered a 1% annual
chance ood, there were areas beyond the 0.2% ood
zone that were inundated, highlighting the uncertainty
around mapped ood risk areas.
Figure 2 shows the ood stages (in NWS datum) for
the Willamette at the Morrison Bridge gauge. “Flood
Stage” (minor ooding) uses the top of the river bank
as a reference, and does not account for the permanent
harbor wall or the temporary seawall that can be
installed to increase ood protection. One hazard of
note for a Willamette River ood is that docks and
oating homes can break free in a major ood event.
MAP 2 | WILLAMETTE RIVER 1% AND 0.2%
ANNUAL CHANCE FEMA FLOOD ZONE
FIGURE 2 |
NWS FLOOD STAGES WILLAMETTE RIVER
3
Figure is representative and not to scale.
Major Flood Stage begins at 28 feet
Moderate Flood Stage begins at 24 feet
Flood Stage begins at 18 feet
West WILLAMETTE RIVER East
Temporary Seawall
Downtown Harbor Wall
1% chance ood at 27 feet
0.2% chance ood at 32 feet
PBEM | Flood Hazard-Specic Appendix Page 5 of 36
Johnson Creek
Due to frequent oods that have caused substantial damage to property and bridges, ood mitigation eorts are
ongoing in the Johnson Creek watershed. Removal of ood-prone homes and construction of ood storage projects
like the Foster Floodplain Natural Area have reduced ood impacts, but has not eliminated ood risk. Flooding still
occurs in the area, and the creek can rise and fall rapidly. The historic crest of 15.33 feet in 2015 led to considerably
less property damage than previous oods, but additional ood events need to be studied to determine the impact of
mitigation eorts on ood severity.
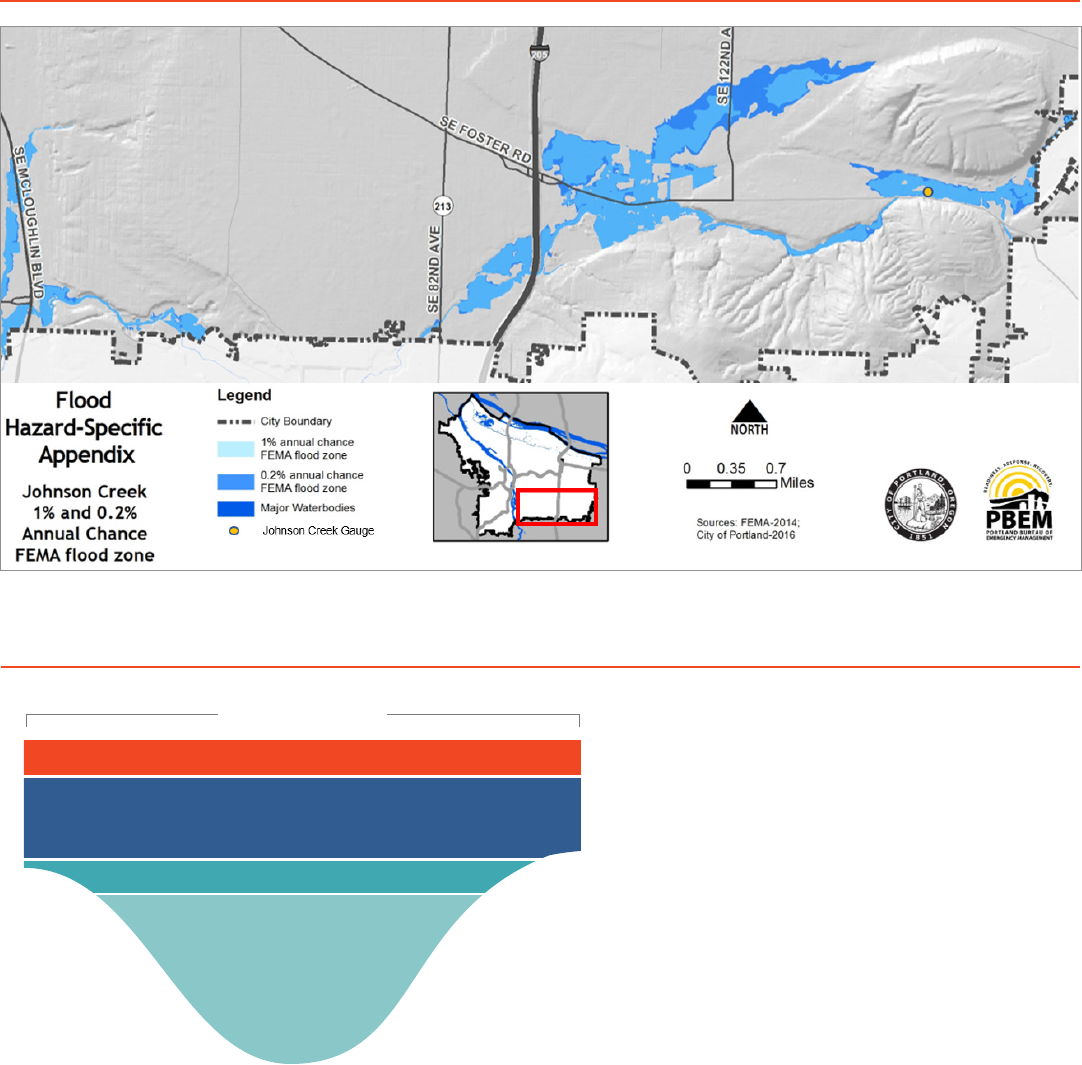
MAP 3 | JOHNSON CREEK 1% AND 0.2% ANNUAL CHANCE FEMA FLOOD ZONE
FIGURE 3 | NWS FLOOD STAGES JOHNSON CREEK
JOHNSON CREEK
Action Stage begins at 10 feet
Flood Stage begins at 11 feet
Major Flood Stage begins at 14 feet

PBEM | Flood Hazard-Specic Appendix Page 6 of 36
Holgate Lake is a groundwater-fed ephemeral lake that
sometimes appears near Johnson Creek between SE
128th and SE 136th Avenue, around SE Long Street when
the water table rises. While it is shown in FEMA’s 1% and
0.2% annual chance ood zones, it is not actually caused
by creek ooding (hence being a separate area in a 1%
annual chance ood). This lake emerges in a residential
area, ooding homes and streets.
Map 3 shows the FEMA 1% and 0.2% annual chance
ood zones for Johnson Creek in Portland, and the
location of the NWS Sycamore gauge near SE Foster
Road, south of Powell Butte. Figure 3 shows the ood
stages (in NWS datum) for Johnson Creek at the
Sycamore gauge.
Columbia River
Like the Willamette, ooding on the Columbia River
is relatively infrequent in Portland, due to dams and
other infrastructure upstream, and the levee system
maintained by Multnomah County Drainage District
(MCDD). Map 4 shows the FEMA 1% and 0.2% annual
chance ood zones for the Columbia River near
Portland, and the location of the NWS gauge near
Vancouver. These ood zones take the levee system
into account, and do not show areas that would ood
should the levees be compromised. In 1948, the
Columbia River crested at 31 feet and broke through
portions of the levees, devastating the city of Vanport.
MAP 4 | COLUMBIA RIVER 1% AND 0.2% ANNUAL CHANCE FEMA FLOOD ZONE
4
Figure is representative and not to scale. “Action Stage” is an additional NWS
notication option.

PBEM | Flood Hazard-Specic Appendix Page 7 of 36
Figure 4 shows the ood stages (in NWS datum) for the Columbia at the Vancouver gauge. As with the Willamette
River, “Flood Stage” (minor ooding) uses the top of bank as a reference, and does not account for the levees, which
also provide ood risk reduction from the Columbia Slough. Floating communities on the Columbia River are at risk in
a major ood event.
FIGURE 4 | NWS FLOOD STAGES COLUMBIA RIVER
MAP 5 | COLUMBIA CORRIDOR LEVEE SYSTEM
5
Figure is representative and not to scale. “Action Stage” is an additional NWS notication option.
LEVEES
South COLUMBIA RIVER North
0.2% chance ood at 27.8 feet
Action Stage begins at 15 feet
Flood Stage begins at 16 feet
Major Flood Stage begins at 25 feet
Moderate Flood Stage begins at 20 feet
1% chance ood at 25.6 feet

PBEM | Flood Hazard-Specic Appendix Page 8 of 36
MCDD maintains its own Flood Emergency Action Plan
(FEAP), which covers MCDD and two other districts
within the city of Portland: Peninsula Drainage Districts
#1 and #2. The FEAP also covers areas outside of
Portland city limits. Elements of this plan are noted
under Concept of Operations. MCDD maintains 27
miles of levees along the Columbia River and Columbia
Slough, which reduce ood risk for more than 12,000
acres of land. This land includes approximately 2,000
landowners, 10% of Multnomah County jobs, the
Portland International Airport, Portland International
Raceway, Columbia South Shore Well Field (Portland’s
backup drinking water supply), the National Weather
Service Portland oce, the Northwest River Forecast
Center oce, and many other regional assets.
Frontline Communities
Certain groups within the city tend to experience
impacts from disasters rst and worst. Some of
these populations include people without shelter,
communities of color, low income populations,
those who do not speak English as a primary
language, and community members with functional
or access needs. Because of their exposure, these
frontline communities require special consideration
during ood response to ensure that they receive
warnings and can take protective actions or access
additional resources if necessary.
ASSUMPTIONS
Dams, levees, and other infrastructure upstream will
operate to reduce ood risk.
The existing ood defense and harbor wall
elevations are adequate to protect the downtown
central business district for a 1% annual chance ood
event without installation of seawall panels.
PBOT’s proposed ood defense plan (including
installation of the seawall) is adequate to protect
the downtown core against a 0.2% annual chance
ood event.
The existing levee systems are adequate to protect
the Columbia Corridor from a 1% annual chance
ood event.
Emergency Coordination Center (ECC) responders
will report from bureaus across the City and bureaus
will make resources and personnel available to
Incident Command.
Landslides and debris ows may occur in the West
Hills or on other steep slopes and divert resources
from the ood ghting response.
Private property owners will take responsibility for
their own ood risk reduction.
A regional command structure may be necessary in
the event of a major ood.
Aid from external partners will be available in the
event of a major ood.
The US Army Corps of Engineers will actively manage
Columbia and Willamette River levels to the degree
possible, and will coordinate with the NWS to
provide advance notice of forecasted river levels.
6
https://www.mcdd.org/what-we-do/emergency-plan/

PBEM | Flood Hazard-Specic Appendix Page 9 of 36
ROLES AND RESPONSIBILITIES
This section outlines key roles and responsibilities specic to ood emergencies. Some bureaus and agencies may
make additional contributions to those described. The roles below do not apply to all ood emergencies, but will
depend on guidelines in the Concept of Operations and the specic needs of the incident. All bureaus must continue
essential City services and assist in the response to and recovery from an incident. Bureaus will need to provide
stang and resources to facilitate the City’s response and recovery goals during and after a ood. The City Emergency
Coordination Center (ECC), which supports incident command from a separate location, may transition to an
Emergency Operations Center (EOC) if the emergency reaches a level of complexity that incident command is better
served by locating in that facility.
PORTLAND BUREAU OF TRANSPORTATION (PBOT)
Provide Incident Command (IC) for any
ood emergencies
Activate Bureau Incident Command Post (BICP)
Coordinate public information for ood emergencies
Coordinate with other bureaus and agencies
Provide policy guidance
Oversee installation of the seawall and placement
of stop log closures
Assist with levee protection
Liaise with public utilities
Document and post information on WebEOC
Initiate placement/removal of barricades or other
trac control devices
PBEM | Flood Hazard-Specic Appendix Page 10 of 36
PORTLAND BUREAU OF EMERGENCY
MANAGEMENT (PBEM)
Act as support bureau for PBOT
Monitor and disseminate weather advisories
and warnings
Disseminate public alerts or warnings of ood
Notify and support Mayor and Disaster Policy
Council (DPC)
Coordinate assistance requests from bureaus
and partners
Activate and support City ECC
Coordinate appropriate ECC stang
Liaise with other governmental agencies and EOCs
Support PBOT Public Information Ocer (PIO)
Document and post information on WebEOC
BUREAU OF ENVIRONMENTAL SERVICES (BES)
Act as support bureau for PBOT
Protect critical BES infrastructure
Monitor Willamette River elevations at Ankeny
Pump Station
Monitor Johnson Creek elevations at the
Sycamore Gauge
Report to appropriate regulatory authorities
as needed
Coordinate with IC
Document and post information on WebEOC
Make personnel and resources available to IC
PORTLAND PARKS AND RECREATION (PP&R)
Act as support bureau for PBOT
Activate BICP if needed
Limit public access to park properties in ood zones
via signage
Enact emergency park closures per PCC 20.12.190
Secure or remove unsafe dock infrastructure
Assist with seawall assembly
Utilize available park rangers to conduct outreach in
impacted areas
Document and post information on WebEOC
Make personnel and resources available to IC
PORTLAND WATER BUREAU (PWB)
Protect Water Bureau assets and critical
infrastructure, including:
Reservoirs
Columbia South Shore Well Field
Bull Run watershed
Document and post information on WebEOC
Make personnel and resources available to IC
PORTLAND POLICE BUREAU (PPB)
Support trac management and detours
Enforce trac regulations and parking restrictions
Document and post information on WebEOC
Make personnel and resources available to IC
PBEM | Flood Hazard-Specic Appendix Page 11 of 36
PORTLAND FIRE & RESCUE (PF&R)
Support ECC activation and operation
Direct PF&R land and marine-based companies
to conduct rapid damage assessments of their
responsible Fire Management Areas (FMAs)
Direct the removal of hazardous materials in danger
of ood impacts
Evacuate and/or rescue threatened occupants and
treat injured victims
PF&R Fireboats will assess all bridge support
infrastructure when conducting rapid damage
assessments and report damage debris clearance
needs to Multnomah County
Assist US Coast Guard (USCG) and Multnomah
County Sheri’s Oce (MCSO) River Patrol Unit
within PF&R scope and capabilities
Communicate with river residents for awareness of
potential dangers
Document and post information on WebEOC
Make personnel and resources available to IC
BUREAU OF DEVELOPMENT SERVICES (BDS)
Coordinate rapid damage assessment of structures
impacted by ood, including posting of buildings
and determining amount of damage
Provide detailed damage assessments as needed
or requested
Assist with coordination of construction project
erosion control removal to control sediment and
manage drainage
Assist property owners and businesses in the
permitting of needed repairs to damaged properties
and/or their demolition
Issue demolition permits to maintain accurate
records of building inventories and proper
documentation within permitting system
Document and post information on WebEOC
Make personnel and resources available to IC
OFFICE OF MANAGEMENT
AND FINANCE (OMF)
Provide training/guidance for tracking
emergency expenditures
Release trained ECC responders to support ECC
Make personnel and resources available to IC
OTHER CITY BUREAUS
Release trained ECC responders to support ECC
Document and post information on WebEOC
Make personnel and resources available to IC
MAYOR AND DISASTER POLICY COUNCIL (DPC)
Participate in required DPC meetings once notied
of a potential large-scale ood
Declare a local emergency
Issue Evacuation Orders in accordance with
Evacuation Annex
Convene press conferences and conduct other
necessary public outreach
JOINT OFFICE OF HOMELESS SERVICES (JOHS)
Coordinate with PBEM prior to closing winter
shelters regarding possible warnings about ood
risk to community members leaving the shelters
Provide guidance and coordination
regarding outreach to potentially impacted
unhoused populations
Coordinate with City of Portland IC
PBEM | Flood Hazard-Specic Appendix Page 12 of 36
MULTNOMAH COUNTY
Emergency Management will coordinate with PBEM
to support response through possible County EOC
activation and deployment of additional resources
as appropriate
Emergency Management will coordinate with City
of Portland IC, ECC and Oregon Oce of Emergency
Management
Sheri’s Oce River Patrol Unit will coordinate with
US Coast Guard and PF&R to monitor river trac and
assist as needed
Department of Community Services Transportation
will coordinate with City of Portland IC regarding
road and bridge closures
Department of County Human Services will
coordinate shelter operations as needed
MULTNOMAH COUNTY DRAINAGE
DISTRICT (MCDD)
Implement Flood Emergency Action Plan
Provide incident management for MCDD,
Peninsula Drainage District #1 and Peninsula
Drainage District #2
Protect ood risk reduction system (levee system
and drainage infrastructure)
Coordinate with US Army Corps of Engineers
Notify PBOT of needed stop log closure installations
Coordinate with City of Portland IC as levee system
subject matter experts and regarding potential
needs for evacuation of leveed areas
PORT OF PORTLAND
Activate Port EOC during ood emergency
Coordinate with MCDD and City of Portland IC
TRIMET
Coordinate with City of Portland IC regarding road
and light rail closures and bus rerouting
OREGON DEPARTMENT OF
TRANSPORTATION (ODOT)
Coordinate with City of Portland IC for road closure
and perimeter control
Provide mutual aid and assistance with
trac control and ow by Region 1 Incident
Response Units
NATIONAL WEATHER SERVICE (NWS)
Conduct ongoing monitoring of ood conditions
Declare ood watches and warnings
Hold teleconferences in the event of
imminent ooding
Coordinate water management actions with US
Army Corps of Engineers to minimize ooding
OREGON EMERGENCY MANAGEMENT (OEM)
If required, activate the State ECC
If required, request Federal aid to support ood
response and recovery eorts
Communicate pertinent information received from
State and Federal agencies to Multnomah County
Emergency Management or the County EOC
Coordinate provision of State and Federal resources
US COAST GUARD (USCG) – SECTOR COLUMBIA
RIVER, STATION PORTLAND
Control trac on both Columbia and
Willamette Rivers
Assist with river search and rescue
Coordinate with City of Portland IC
US ARMY CORPS OF ENGINEERS (USACE)
Administer ood risk reduction projects (e.g. dams)
If requested through Oregon EOC, assist with ood-
ghting resources
Coordinate with MCDD and City of Portland IC

PBEM | Flood Hazard-Specic Appendix Page 13 of 36
CONCEPT OF OPERATIONS
PHASED OPERATIONS
Portland is susceptible to ooding from the Columbia
River, the Willamette River, and Johnson Creek. All three
are aected by regional weather patterns, but often
ood at dierent times, or at dierent levels of severity.
This concept of operations is designed to apply to any
combination of ooding, through a phased approach.
If only Johnson Creek is ooding, the Johnson Creek
Flooding Standard Operating Procedure is the guiding
document. If the Willamette or Columbia River is
ooding, this Appendix is the guiding document.
Unusual Precipitation Considerations
Flooding often occurs with local precipitation to varying
degrees. Moderate precipitation can contribute to river
ooding, and can also generate urban ooding, where
stormwater systems are overwhelmed. During extreme
local precipitation events, additional actions must be
taken. One action that is unique to extreme precipitation
events is the removal of erosion control measures if they
interfere with storm drain function. The identication
of conditions that warrant this action should be
based on BES sta analysis. The communication and
enforcement of this action should be performed by
BDS sta. Specic procedures for this type of event are
under development.
It is important to acknowledge that ooding can also
occur based solely on upstream events, with light or
even no local precipitation. During these incidents,
some of the actions listed below in Table 4 and Table 6
may not be necessary. The Incident Commander, or lead
sta if incident command has not been established, will
make the determination regarding whether activities
listed below are appropriate to the specic ood event.

PBEM | Flood Hazard-Specic Appendix Page 14 of 36
Phase Structure
The phases outlined below reect the expected
impact of ooding and the response required.
Although the headings of minor, moderate, and
major ooding mirror the NWS categories, the gauge
levels are dierent (see Figure 5). NWS levels are
used for stretches of the rivers and apply to multiple
communities. The response phases in this plan
specically address Portland’s ood concerns and the
resources needed to address ood risk.
The maps in this section were developed to provide a
visual estimate of where ooding might geographically
occur during each ood response phase. These
maps use data developed through mathematical
approximations of how Columbia and Willamette
River levels would interact with Portland geography
and are not based on historic ood data, though
they correspond relatively closely. Separate mapping
conducted by USGS is shown to communicate
inundation around Johnson Creek.
If multiple rivers are ooding, the overall phase of
operations will be that of the river with the most
extreme ooding. Floods can develop quickly and
response is often based on forecasts rather than
current conditions, and forecasts will often change
as conditions change. Phases may therefore not
be implemented in order, and later phases should
incorporate earlier response actions if those phases
were skipped. If a gauge level is predicted, actions
noted for a level should be completed by the time
the river reaches that level. Incident command will
determine how these actions are pursued and when
they are initiated based on the specics of the ood
event and how quickly water is rising.

PBEM | Flood Hazard-Specic Appendix Page 15 of 36
FIGURE 5 | RIVER FLOOD STAGE COMPARISONS
Moderate Flood Stage 24.1 feet
Minor Stage 20.1 feet
High water at 15 feet
Historic Flood Stage 31.0 feet
Major Flood Stage 25.7 feet
Action Stage 15 feet
Flood Stage 16 feet
Major Flood Stage 25 feet
Moderate Flood Stage 20 feet
RESPONSE PHASE
(from Table 2)
NWS LEVELS
(from Figure 4)
Action Stage 10 feet
Flood Stage 11 feet
Major Flood Stage 14 feet
Flood Stage 10 feet
High water at 6.5 feet
Major Flood Stage 14 feet
Moderate Flood Stage 11 feet
RESPONSE PHASE
(from Table 2)
NWS LEVELS
(from Figure 3)
Flood Stage 18 feet
Major Flood Stage 28 feet
Moderate Flood Stage 24 feet
Moderate Flood Stage at 23.2 feet
Minor Stage 16.1 feet
High water 15 feet
Historic Flood Stage 33.1 feet
Major Flood Stage 24.1 feet
RESPONSE PHASE
(from Table 2)
NWS LEVELS
(from Figure 2)
Willamette RiverJohnson CreekColumbia River

PBEM | Flood Hazard-Specic Appendix Page 16 of 36
MONITORING
Dierent rivers are monitored by dierent agencies in
anticipation of a ood emergency.
The Willamette River Morrison Gauge will be
monitored by the PBEM Duty Ocer if the gauge is
predicted to reach 15’ within the next 5 days by the
National Weather Service. This monitoring will be
triggered by 14’ actual height on the Willamette or a
predicted 15’ on the Columbia River.
The levee system is visually monitored by MCDD year-
round, with frequent monitoring during a NWS ood
advisory, watch, or warning.
At 17.2’ on the Vancouver Gauge, MCDD will
coordinate with PBEM, Metro, BES, and PWB.
Johnson Creek Sycamore Gauge is monitored daily by
BES Eastside Watersheds sta year-round.
Monitoring becomes more frequent with a
NWS ood advisory, watch or warning.
Any local ood watch or warning will cause PBEM to begin
incident monitoring or shift into Enhanced Operations,
providing monitoring and daily status reports. IC may also
request aerial, on-the-ground, or other monitoring.
TABLE 2 | FLOOD RESPONSE PHASES
FLOOD
RESPONSE PHASE
WILLAMETTE RIVER
GAUGE LEVELS NWS
COLUMBIA RIVER
GAUGE LEVELS NWS
JOHNSON CREEK
GAUGE LEVELS NWS
1 - High Water/Pre-flood
15.0 - 16.0' 15.0 - 20.0' 6.5 - 9'
2 - Minor Flooding
16.1 - 23.1' 20.1 - 24.0' 10'
3 - Moderate Flooding
23.2 - 24.0' 24.1' - 25.6' 11 - 13'
4 - Major Flooding
24.1 - 33.0' 25.7 - 31.0' 14' +
5 - Historical Flooding
33.1' + 31.0' + N/A
6 - Recovery
Receding Receding Receding

PBEM | Flood Hazard-Specic Appendix Page 17 of 36
HIGH WATER/PREFLOODING AND EARLY FLOODING
PHASE 1
PHASE
WILLAMETTE RIVER
GAUGE LEVELS NWS
COLUMBIA RIVER
GAUGE LEVELS NWS
JOHNSON CREEK
GAUGE LEVELS NWS
1
15.0 - 16.0' 15.0 - 20.0' 6.5 - 9'
MAP 6 | PHASE 1 PROJECTED INDUNDATION
TABLE 3 | PHASE 1 RIVER GAUGE LEVELS

PBEM | Flood Hazard-Specic Appendix Page 18 of 36
Early ood conditions can lead to urban ponding/
ooding and aect people and infrastructure within the
banks of rising rivers. Flood response work required in
this phase is generally within the scope of PBOT and
other bureaus’ routine operations. Agencies other than
the City of Portland (e.g. MCDD) may ramp up their
level of response within this phase. As shown in Map 6,
the parts of the city most likely to see overtopped
banks in this phase are near Oaks Bottom and near the
Willamette/Columbia conuence. Areas noted as
“Projected Inundation Before Phase 1” indicate normal
water levels that do not trigger any ood response. If
waters are expected to crest within Phase 1 and then
recede, eorts focus on protecting infrastructure on or
adjacent to the rivers, such as pump stations and docks,
providing warning to people likely to be impacted, and
managing impacts to streets to the degree possible.
If waters are expected to continue to rise, these eorts
are incorporated into longer-term actions, and public
information is geared towards the overall forecast.
Depending on the forecast, PBEM may be at Enhanced
Operations and will create a new incident in WebEOC.
If necessary, PBEM Duty Ocer will convene daily
teleconference calls to enhance situational awareness.
PBOT PIO will coordinate with PBEM and other response
bureau PIOs as needed to provide consistent messaging
to local media and the public regarding water levels,
location of sand bagging supplies, detour routes, any
potential hazards, and the expected timeframe of
potential hazard impacts. If there are any recommended
actions for the public to take, those may also be
included in messaging.

PBEM | Flood Hazard-Specic Appendix Page 19 of 36
TABLE 4 | KEY RESPONSE ACTIONS FOR PHASE 1
PREDICTED
GAUGE LEVEL
NWS
RESPONSE ACTION
WILLAMETTE RIVER
15'
PBEM: Notify other bureaus (PBOT, BES, PP&R) of river conditions. Coordinate with JOHS
and Multnomah County to provide up-to-date sheltering information to agencies directing
unsheltered people away from oodwaters.
15'
PBOT/BES/PP&R: Clear inlets/culverts. Post “high water” signs. May do
some pumping jet/vactor work. Most work at this level is within the scope
of routine operations.
15'
PP&R: Close walkways at both ends of Eastbank Esplanade oating walkway, and store
handrails and benches under Burnside Bridge.
COLUMBIA RIVER
15'
MCDD: Conduct a baseline levee system inspection, and then continue weekly levee
inspections, at minimum. Enter Enhanced Operations. Inspection includes identication of
campers, who will likely be at risk already, and coordination with JOHS. Also contact USACE
for additional information and to discuss potential support from the Portland District. If
resources from USACE are needed, MCDD will request through Multnomah County.
17.2'
MCDD: Enter Partial Emergency Activation if forecasted to rise further. Begin daily
inspections of all levee systems.
17.2'
PBEM: Enter Enhanced Operations if MCDD enters Partial Emergency Activation.
20'
MCDD: Depending on levee performance and forecast, may begin 24-hour surveillance and
Full Emergency MCDD will request assistance and further coordinate with support agencies.
20'
Port of Portland, PWB, BES, PBEM: Engage with MCDD to provide support as able.
JOHNSON CREEK
6.5'
BES: Coordinate with JOHS to provide up-to-date sheltering information to people
directing them away from oodwaters. May post ood risk signs and/or notify campers of
possible risk.
6.5'
PP&R: Rangers may informally notify campers of ood risk.

PBEM | Flood Hazard-Specic Appendix Page 20 of 36
TABLE 5 | PHASE 2 RIVER GAUGE LEVELS
MINOR FLOODING
PHASE 2
MAP 7 | PHASE 2 PROJECTED INDUNDATION
PHASE
WILLAMETTE RIVER
GAUGE LEVELS NWS
COLUMBIA RIVER
GAUGE LEVELS NWS
JOHNSON CREEK
GAUGE LEVELS NWS
2
16.1 - 23.1' 20.1 - 24.0' 10'

PBEM | Flood Hazard-Specic Appendix Page 21 of 36
7
The authority to designate street closures lies with the Trac Engineer and is delegated to
the Incident Commander during operations conducted in accordance with this Appendix.
In Phase 2, rivers may experience minor ooding, and
local rainfall may produce debris ows or landslides
in areas with steep slopes. These additional responses
are also led by PBOT. Map 7 highlights areas in North
Portland where inundation may occur in Phase 2. At
this phase, if not before, PBOT will activate their Bureau
Incident Command Post (BICP), and all bureaus will
coordinate their ood response activities with the
Incident Commander. PBEM will support the BICP with
sta for situational awareness and may ll other Incident
Command System (ICS) roles, if requested.
As oodwaters rise, small-scale evacuations and
associated sheltering may be required. Activation of
any portion of the Evacuation Annex for ood should
consider both forecasted crests and speed of water level
rise. Sheltering will be coordinated with Multnomah
County Emergency Management and Multnomah County
Department of Human Services. Trac control and street
closure needs are likely to increase during this phase.
As with Phase 1, if waters are expected to crest in Phase 2,
response can focus on disseminating information to the
public and protecting infrastructure within the forecasted
water level. If oodwaters are expected to rise beyond
Phase 2, key responses should be incorporated into
longer-term actions. Because oodwaters can rise at
very dierent speeds depending on the situation,
the timing of response will need to adapt to the ood
incident at hand.

PBEM | Flood Hazard-Specic Appendix Page 22 of 36
TABLE 6 | KEY RESPONSE ACTIONS FOR PHASE 2
PREDICTED
GAUGE LEVEL
NWS
RESPONSE ACTION
WILLAMETTE RIVER
16'
PBOT/BES: Bureau ICPs open and functioning.
16'
BOEC: High ood-related call load increases may require additional stang.
16'
PBEM: Shift into Enhanced Operations, if not before.
16.1'
PBOT: Debris removal, problem reports and investigation.
16.1'
PPB: Begin trac control and preplanning for possible evacuations.
16.1'
PF&R HARBOR MASTER: Order the removal of hazardous materials from the danger area,
concentrating on 55-gallon drums. Large tanks should be secured.
23'
PF&R: Small boat docks downtown should be removed.
23'
PBOT: Consider requesting advance assistance from USACE through the state if an
emergency is declared. Discuss the installation of the downtown seawall and extensions
with the DPC if river is forecasted to pass 28.9’, the lowest Harbor Wall elevation.
COLUMBIA RIVER
21.5'
MCDD: Enter Full Emergency Activation and 24-hour levee surveillance, see 20’ actions.
21.5'
PBEM: Enter Partial Activation if MCDD enters full Emergency Activation.
23'
MCDD: Call PBOT Dispatch and request PEN 1 oodwall closure installations.
23'
PBOT: Install closures in PEN 1 oodwall and implement Marine Drive trac and closure
plan, closing N. Marine Drive between I-5 and N. Portland Road to all trac.
23'
PBEM DUTY OFFICER: Activate MCDD Evacuation Annex Attachment, coordinating with
the DPC and/or Unied Command, and MCEM for sheltering. Consider mandatory hazmat
and voluntary additional needs populations evacuation in PEN 1.
JOHNSON CREEK
10'
BES: Review Johnson Creek hydrographs and weather conditions; may discuss with NWS.
Update PBEM regarding conditions.
10'
PBEM: Shift into Enhanced Operations.
10'
PBOT/PBEM/BES PIOs: Coordinate communications on ood preparedness actions and
safety recommendations.

PBEM | Flood Hazard-Specic Appendix Page 23 of 36
TABLE 7 | PHASE 3 RIVER GAUGE LEVELS
MODERATE FLOODING
PHASE 3
PHASE
WILLAMETTE RIVER
GAUGE LEVELS NWS
COLUMBIA RIVER
GAUGE LEVELS NWS
JOHNSON CREEK
GAUGE LEVELS NWS
3
23.2 - 24.0' 24.1 - 25.6' 11 - 13'
MAP 8 | PHASE 3 PROJECTED INDUNDATION

PBEM | Flood Hazard-Specic Appendix Page 24 of 36
In Phase 3, impacts to developed properties are more
likely, along with a signicant increase in landslides
in sloped areas. Map 8 shows the areas most likely to
experience additional inundation from the Willamette
or Columbia during this phase. Maps 8a and 8b show
the projected inundation of Johnson Creek at the
beginning of Phase 3 and the beginning of Phase
4, illustrating the range of inundation in Phase 3. As
impacts increase, coordination and aid from regional
partners becomes essential. The Operations Section
may expand to include geographic branches to address
multiple areas of the city, and the ECC will be moved to
Partial or Full Activation. PBEM will inform the Disaster
Policy Council and Mayor of the situation if they are not
already engaged. The IC may seek direction on critical
infrastructure protection and prioritization of response
eorts, particularly if water levels are forecasted to
rise beyond Phase 3 levels. Continued infrastructure
protections, coordinated public information, small-scale
evacuations, and trac management are the major
focuses of response in this phase.
MAP 8a | JOHNSON CREEK PROJECTED FLOODING AT 11 FEET EARLY PHASE 3
MAP 8b | JOHNSON CREEK PROJECTED FLOODING AT 14 FEET EARLY PHASE 4

PBEM | Flood Hazard-Specic Appendix Page 25 of 36
TABLE 8 | KEY RESPONSE ACTIONS FOR PHASE 3
PREDICTED
GAUGE LEVEL
NWS
RESPONSE ACTION
WILLAMETTE RIVER
23.2'
PBEM: City ECC moves to Partial Activation.
23.2'
PBOT/BES: Initiate 24-hour operations to implement temporary barriers and
improvisations to direct or divert ood waters, remove debris, stabilize slopes, close streets,
and control trac.
24.0'
PBEM: City ECC moves to Full Activation.
24.0'
PBOT: Begin downtown seawall installation and Naito extensions if river is forecasted
to pass 28.9’, the lowest Harbor Wall elevation. Personnel for installation and sandbag
reinforcement may include sta, contracted personnel, and NETs.
COLUMBIA RIVER
24.1'
PF&R HARBOR MASTER: Work with USCG and MCSO River Patrol, and request
additional resources as needed to keep debris from bridges, restrict river trac as
necessary, and to check moorages and residential areas. Assist with evacuation planning
for oating residences.
25.6'
PPB: Conduct trac management on Marine Drive, evacuation planning for Hayden/
Tomahawk Islands, Jantzen Beach, Columbia Slough.
25.6'
MCDD: Request reduced speeds or no trac on Marine Drive along the levee system for
patrolling safety and levee integrity, if not already started. Start Special watch of the PEN 1
railroad embankment.
25.6'
PBOT: Reduce speeds/close Marine Drive, if not yet done.
25.6'
PBEM: Enter Full Activation in anticipation of potential levee failure or overtopping.
JOHNSON CREEK
11'
BES: Recommend applicable park closures and continue to monitor conditions with the
possible addition of aerial photography and eld investigations.
11'
PBEM: Convene a conference call and notify predetermined contacts (see SOP) of
forecasted ood conditions. Coordinate with TriMet and MCEM Duty Ocer.
11'
PIOs: Continue disseminating messages regarding ood safety issuess.
11'
PBOT: Deliver sand and sandbags to designated locations (see SOP for locations).
May assign an IC and appropriate Command Sta. May request ODOT’s variable
message boards.

PBEM | Flood Hazard-Specic Appendix Page 26 of 36
TABLE 9 | PHASE 4 RIVER GAUGE LEVELS
MAJOR FLOODING
PHASE 4
PHASE
WILLAMETTE RIVER
GAUGE LEVELS NWS
COLUMBIA RIVER
GAUGE LEVELS NWS
JOHNSON CREEK
GAUGE LEVELS NWS
4
24.1 - 33.0' 25.7 - 31.0' 14'
+
MAP 9 | PHASE 4 PROJECTED INDUNDATION
PBEM | Flood Hazard-Specic Appendix Page 27 of 36
Phase 4 addresses the highest level of ooding
that Portland’s ood infrastructure is designed to
withstand. Flooding would be widespread along the
rivers, including signicant inundation in the city core,
as shown in Map 9. The northernmost highlighted
area of Map 9 includes two districts under MCDD’s
management, Peninsula Drainage Districts #1 and #2
(PEN 1 and PEN 2), and shows the levee system. The
output that shows this area being inundated during this
phase uses basic LiDAR, and so does not reect actions
taken by MCDD to close gaps through sandbagging,
oodwalls, and other eorts. The southernmost
highlighted area of Map 9 shows the downtown core.
This inset map similarly shows ooding that would likely
occur if no preventative actions, such as the installation
of the seawall panels, were taken.
Both the 1% and 0.2% annual chance ood events
would fall within Phase 4. The historic crest for the
Willamette is 33’ in 1894, prior to our current dam
infrastructure. The 33’ crest is also the design height
of the downtown seawall. The historic crest for
the Columbia River is 31’ in 1948, also prior to the
completion of our current dam infrastructure. The
lowest design elevations for the levees are 26.1’ for
PEN 1, 29.6’ for PEN 2, 31’ for the MCDD west basin,
and 33.6’ for the MCDD east basin. Additionally, the
Columbia Slough has the potential for ooding, and
authorized design elevations for that stretch of the
levee system vary as well. There is less ood data on the
Columbia Slough portion of the system. The historic
crest for Johnson Creek is 15.33’ in 2015, however recent
mitigation eorts led to fewer property impacts from
this ood than earlier, lower oods.
The City ECC would be at Full Activation by Phase 4, with
Incident Command or Unied Command likely providing
command from there. This would transition the ECC to
an EOC, which would prepare citywide Incident Action
Plans, coordinate evacuations, and handle mutual aid
and resource requests, advance planning, citywide
situational awareness, and communication with the DPC.
The City’s emergency declaration process may also be
initiated. PBOT and other bureaus would most likely also
continue to sta BICPs to direct resources in the eld.
Both trained, aliated volunteers and spontaneous,
unaliated volunteers would be expected at this phase,
requiring coordination and specic communication
strategies. A citywide Joint Information Center (JIC)
would be activated.
Signicant evacuations in accordance with the
Evacuation Annex may be required in this phase for
oating communities or levee areas. Other major eorts
in this phase include the installation and assembly of
the downtown seawall, construction of other temporary
oodwalls, protection of BES pump stations and other
sewer/stormwater infrastructure, and sheltering for
displaced residents.

PBEM | Flood Hazard-Specic Appendix Page 28 of 36
TABLE 10 | KEY RESPONSE ACTIONS FOR PHASE 4
PREDICTED
GAUGE LEVEL
NWS
RESPONSE ACTION
WILLAMETTE RIVER
24.1'
PF&R HARBOR MASTER: Work with USCG, MCSO River Patrol and requested additional
resources to keep debris from bridges, restrict river trac as necessary, and check
moorages and oating homes.
24.1'
PPB: May be needed for evacuation planning and execution for South Waterfront, Pearl
District, Oaks Bottom, and/or Sellwood area.
COLUMBIA RIVER
25.7'
MCDD: Construct temporary oodwalls along levee system as necessary.
29.7'
MCDD: Construct temporary oodwalls on top of the levee system in NE PEN 2.
29.7'
MCDD: Mandatory evacuations triggered in leveed areas.
JOHNSON CREEK
14'
PBEM: City ECC moves to Partial or Full Activation.
14'
PBOT: IC coordinates ood ghting, evacuation, or additional alerts as necessary.
14'
MCEM: Establish an emergency shelter for residents displaced by ooding.

PBEM | Flood Hazard-Specic Appendix Page 29 of 36
TABLE 11 | PHASE 5 RIVER GAUGE LEVELS
HISTORIC FLOODING
PHASE 5
PHASE
WILLAMETTE RIVER
GAUGE LEVELS NWS
COLUMBIA RIVER
GAUGE LEVELS NWS
JOHNSON CREEK
GAUGE LEVELS NWS
5
33.1' + 31.0' + N/A
MAP 10 | PHASE 14 PROJECTED INDUNDATION AND 0.2% ANNUAL CHANCE FEMA FLOOD ZONE

PBEM | Flood Hazard-Specic Appendix Page 30 of 36
Should oodwaters rise into Phase 5 levels, the
levees are likely to fail or be overtopped, and the
downtown seawall would also be overtopped, resulting
in extensive damage. While the seawall would be
overtopped early in this phase, the levee area would
be anticipated to inundate after 34’ on the Vancouver
gauge. Signicant evacuations may be required
throughout the metro area with the need for rescues
and attention to life safety issues. At these levels of
ooding, we do not know how much of the city might
be inundated. Particularly with the changing climate,
there is no condent maximum ood event. Map 10
shows all four earlier phases of ood response, and
the additional areas (including Johnson Creek) that are
within the 0.2% annual chance ood zone.
In the event of a ood that reached Phase 5, actions
to be taken are covered in other plans:
Evacuation Annex
Alert and Warning Annex
Coordination, Direction and Control Annex
Mass Shelter Plan (Multnomah County)
The Disaster Policy Council and Mayor will provide
policy direction for response actions. Documentation of
actions, decisions, and expenses is critical for recovery
from such an event. Frontline communities will require
specic attention to maximize life safety. Recovery
planning should begin immediately, in conjunction with
damage assessment and debris management.

PBEM | Flood Hazard-Specic Appendix Page 31 of 36
RECOVERY
PHASE 6
In this phase, oodwaters will crest and start to recede,
and response will transition into recovery. Depending
on the level of damage, recovery may include:
Initial damage assessment in anticipation of a federal
disaster declaration
Deployment of Damage Assessment Teams (DATs)
Debris removal
Repairs by private property owners
Repairs to city-owned facilities or systems
Road repairs
After-action review and reporting
After a major ood event, coordination and rapid
damage assessment will be critical to recovery. BDS is
responsible for determining whether ood-damaged
structures are habitable or safe to enter; they must also
permit demolitions and repairs. PBOT, BES, and PWB
all have infrastructure in the city’s rights-of-way, in
addition to other facilities. Any needed repairs in rights-
of-way will be coordinated among these three bureaus.

PBEM | Flood Hazard-Specic Appendix Page 32 of 36
COMMAND STRUCTURE
The suggested stang in dierent phases for both eld operations and the Emergency Coordination Center are
diagramed on the following pages. This stang plan addresses all sources of ooding, allowing positions to be
eliminated if they are not needed.
FIGURE 6 | PBOT INCIDENT COMMAND POST ORGANIZATION CHART
LEGEND:
INCIDENT COMMAND
(PBOT)
Operations
Section Chief
Columbia
River
Division
Stop Log
Installation
MCDD
Support
Willamette
River Branch
Seawall
Division
North of
Seawall
Division
South of
Seawall
Division
East Side
Division
Other
Flooding
Branch
Johnson
Creek
Division
Landslides
Group
GIS (may be
combined
w/ SitStat)
Time
Unit
Cost
Unit
Planning
Section Chief
SitStat
Logistics
Section Chief
Finance
LIAISON OFFICER
(PBEM)
Transport
City Sta
(PP&R,
BES, WB)
City Sta
Sandbag
Sandbag
Mainenance
Mainenance
Gaps CEI Hub OHSU Tram
Swan
Island
Installation
(Heavy
Equipment)
Installation
(Heavy
Equipment)
Installation
(Heavy
Equipment)
Transport
City Sta
Sandbag
Mainenance
Transport
Trac
Control
Trac
Control
Sullivan’s
Gulch
Sandbag
Supplies
122
nd
Bridge
Structure
Road
Closure
ResourceCleanup
Debris
Storage
Subject
Matter
Experts
BDS
Assessment
Staging
Manager
SAFETY OFFICER
PUBLIC INFORMATION
OFFICER
Documenta-
tion

PBEM | Flood Hazard-Specic Appendix Page 33 of 36
FIGURE 7 | ECC ORGANIZATION CHART
LEGEND:
ECC MANAGER
SAFETY OFFICER
PUBLIC INFORMATION
OFFICER
Operations
Section Chief
Deputy
Ops Chief
Public Works
Branch
Documenta-
tion
Time
Unit
Cost
Unit
Procurement
Comp/
Claims
Planning
Section Chief
Logistics
Section Chief
Finance
LIAISON OFFICER
CITY ATTORNEY’S
OFFICE
PP&R
BDS
PWB
Air Ops
Rapid Needs
Assessment
Advance
Planning
Technical
Specialist
(BES)
BES
Deputy
Logs Chief
Support
Branch
Services
Branch
Supply Unit
Resource
HR
Comms
Food
Message
Center
Ground
Support
SitStat
PPB GIS
PBEM | Flood Hazard-Specic Appendix Page 34 of 36
DIRECTION AND CONTROL
The BEOP addresses overall direction and control for emergencies. For ooding, PBOT is the lead agency. Other
bureaus and agencies have key responsibilities across phases of ood response.
PHASE 1 - HIGH WATER/PRE-FLOOD
Bureaus and agencies operate under routine operations or a bureau IC.
PHASE 2 - MINOR FLOODING, PHASE 3 - MODERATE FLOODING, AND PHASE 4 - MAJOR FLOODING
PBOT IC coordinates ood response with support from other bureaus and the ECC.
PHASE 5 - HISTORIC FLOODING OR EARLIER ACTIVATION OF THE EVACUATION ANNEX
With the activation of the Evacuation Annex, command shifts to Unied Command consisting
of PBOT, PF&R, and PPB.
PHASE 6 – RECOVERY
Recovery activities will shift away from IC/UC.
Recovery from an event short of historic ooding can be managed by individual agencies.
Historic ooding will require recovery eorts that are coordinated community-wide.
PLAN DEVELOPMENT & MAINTENANCE
PBEM is responsible for coordinating the review and update of this plan with PBOT every ve years, or more often, as
necessary. Other bureaus with responsibilities identied in this plan will assist according to the roles described. All
responsible bureaus and collaborating agencies should be familiar with this Appendix and ensure that the content is
consistent with their own agency’s plans and procedures.

PBEM | Flood Hazard-Specic Appendix Page 35 of 36
AUTHORITIES AND REFERENCES
The City assumes no legal responsibility for the implementation of this Appendix.
PORTLAND CITY CODE
Title 15 – Emergency Code
Title 16.10.200.N – Duties of the Trac Engineer
Title 20.12.190 – Emergency Park Closure
REFERENCES
City of Portland. Flood and Landslide Hazard Mitigation Plan: Based on Lessons Learned in February 1996.
October 1996.
City of Portland. Alert and Warning Annex. 2017. www.portlandoregon.gov/pbem/article/352777.
City of Portland. Coordination, Direction and Control Annex. 2017. www.portlandoregon.gov/pbem/article/651278.
City of Portland. Evacuation Annex. October 2017. www.portlandoregon.gov/pbem/article/668061.
City of Portland. Mitigation Action Plan. October 2016. www.portlandoregon.gov/pbem/67578.
City of Portland, Bureau of Planning and Sustainability. “River Gauge Levels.” [map] January 2018. \\cgisle\public\
PBEM\River_Gauge_Levels. (May 2018).
Federal Emergency Management Agency. Basic Emergency Operations Planning: Emergency Operations Basic Plan
Template National Preparedness Directorate. September 2009.
Federal Emergency Management Agency. Flood Insurance Study: City of Portland, Oregon. November 26, 2010.
Federal Emergency Management Agency. National Flood Insurance Program Community Rating System Coordinator’s
Manual. May 4, 2017.
State of Oregon Emergency Management. Incident Annex IA#. Flood (including Dam/Levee Failure). June 2010.

