
PURDUE UNIVERSITY
PRECISION
A G R I C U L T U R E
Implementing Site-Specific Management:
Map- Versus Sensor-Based
Variable Rate Application
Daniel R. Ess, Mark T. Morgan, and Samuel D. Parsons
Agricultural and Biological Engineering Department
Department of
Agricultural and
Biological Engineering
SSM-2-W
PURDUE EXTENSION
Two Approaches to Site-Specific Farming
There are a number of questions that must be answered before establishing a site-
specific, or precision, management program for crop production. Many of those questions
are economic, some are agronomic, and others are technology-related. One important
technology-related question is: “What methods of variable-rate application of fertilizer,
crop chemicals, and seed are available?” This publication is intended to answer that
question while providing a comparison of those methods.
There are two basic methods of implementing site-specific management (SSM) for the
variable-rate application (VRA) of crop production inputs: map-based and sensor-based.
While each method has unique benefits and limitations, some SSM systems have been
developed to take advantage of the benefits of both methods.
The first site-specific management method is based on the use of maps to represent crop
yields, soil properties, pest infestations, and variable-rate application plans. The
map-
based method
can be implemented using a number of different strategies. Crop producers
and consultants have crafted strategies for varying inputs based on: soil type, color and
texture, topography (high ground, low ground), crop yield, field scouting data, remotely
sensed images, and a host of other sources. Some strategies are based on a single
information source while others involve a combination of sources. Regardless of the actual
strategy, the user is in control of the development process.
To develop a plan for variable-rate fertilizer application in a particular field, the map-based
method could include the following steps:
• perform systematic soil sampling (and lab analysis) for the field;
• generate site-specific maps of the soil nutrient properties of interest;
• use some algorithm to develop a site-specific fertilizer application map; and
• use the application map to control a variable-rate fertilizer applicator.
A positioning system is used during the sampling and application steps to continuously
know or record vehicle location in the field. Differentially-corrected Global Positioning
System (DGPS) receivers are the most commonly used positioning devices. The process
of map-based, variable-rate application is illustrated in Figure 1.

PRECISION AGRICULTURE SSM-2-W
2
Figure 1. An illustration of a map-based system for varying crop input application rates.
The second SSM method provides the capability to vary the application rate of crop produc-
tion inputs with no mapping involved. The
sensor-based method
utilizes sensors to measure
the desired properties, usually soil properties or crop characteristics, on the go. Measure-
ments made by such a system are then processed and used immediately to control a variable-
rate applicator (Figure 2). This second method doesn’t necessarily require the use of a DGPS
system. Nor does it require extensive data analysis prior to making variable-rate applications.
Figure 2. An illustration of a sensor-based system for varying crop input
application rates.
Control map generation
mapped data
Variable-rate application
records guidebooks
variable-rate
drive
data
card
controller output
controller
display/processor
DGPS antenna
variable-rate
drive
sensor
controller output
sensor
readings
processor
controller

3
PRECISION AGRICULTURE SSM-2-W
Map-based Technologies
Currently, the majority of available technologies and applications in site-specific farming
utilize the map-based method of sampling, map generation, and variable-rate application. This
method is more popular due to the scarcity of sensors for rapidly monitoring soil and crop
conditions. Also, laboratory analysis is still the most trusted and reliable method for determin-
ing most soil and plant properties.
Once field data have been collected and assigned position coordinates (e.g. latitude and
longitude), mapping is easily performed using a computer program (usually a geographic
information system (GIS) program). Such programs can use mathematical techniques for
“smoothing” or interpolating the data between sampling points. However, some site-specific
practitioners choose to use a constant value for the measured property over each sampling
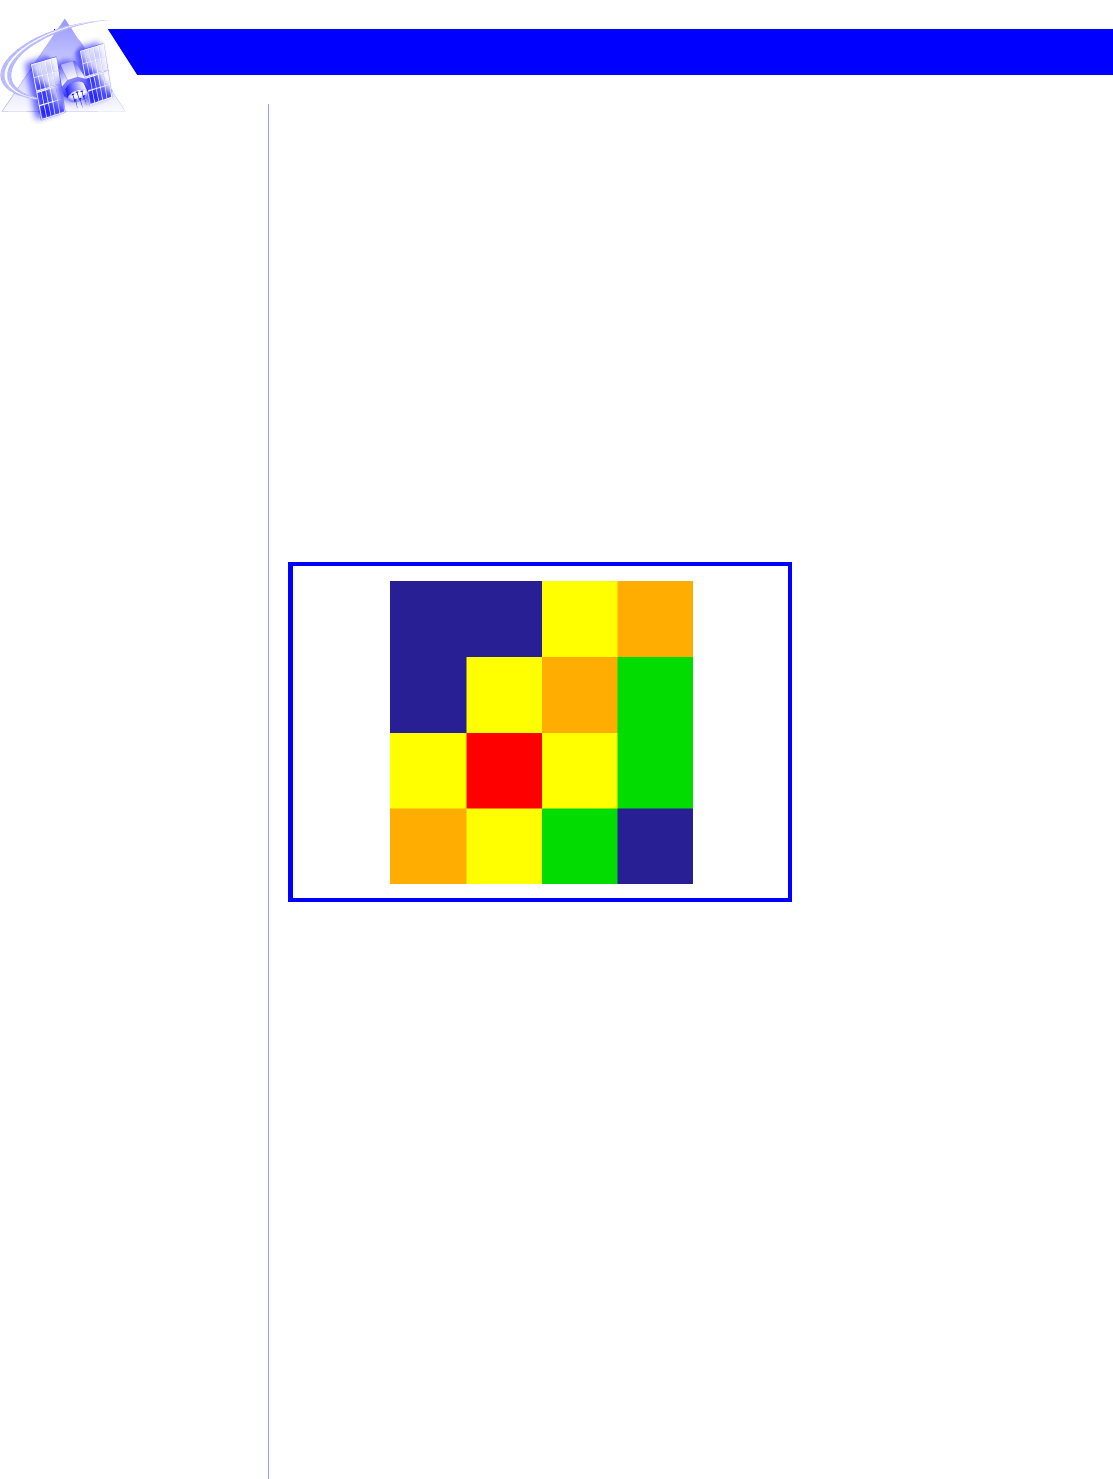
area or grid cell (Figure 3). As illustrated in Figure 3, the level indicated by each grid cell is
determined by analyzing samples collected from the center of each cell. This represents the
common practice of using software to divide a field into a set of imaginary, equal-sized
rectangles or grid cells, identifying the center of each cell, and directing that samples be
collected from the vicinity of each grid cell center.
Figure 3. Two alternatives for representing systematic soil sampling data – the grid map
and the contour map.
Regardless of how data are represented, the mapping facilitates long-term planning and
analysis. It provides an opportunity to make decisions regarding the selection and purchase of
crop production inputs well in advance of their use.
Maps are especially good for collecting and interpreting data for soil properties that do not
fluctuate greatly from year to year. Properties such as organic matter content and soil texture
tend to change quite slowly, if at all. Soil fertility, on the other hand, may change more quickly.
Particular nutrients such as phosphorous and potassium may change from year to year, but
one can probably obtain benefits from sampling only every two to three years. Levels of other
nutrients may vary considerably even during a single season. For instance, the forms and
concentrations of nitrogen in the soil are greatly affected by temperature and moisture condi-
tions and can fluctuate rapidly. Nitrogen is an example of an important soil fertility factor that
#
#
#
#
#
#
#
#
#
#
#
#
#
#
#
#
#
#
#
#
#
#
#
#
#
#
#
#
#
#
#
#
#
#
#
#
#
#
#
#
#
Grid Map of Soil Sampling Data Contour Map of the Same Data
soil sampling
locations
PRECISION AGRICULTURE SSM-2-W
4
doesn’t lend itself to a typical site-specific management program based on soil sampling data
due to delays between sampling and fertilizer application. Nitrogen management approaches
that rely on other, more stable information such as crop yield potential have been developed.
In order to use computer-generated maps, they must be converted to a form that can be
used by a variable-rate applicator. The conversion process is performed using specialized
software that applies user-selected algorithms (mathematical recipes). Algorithms are usually
based on standard fertilizer recommendation formulas. The application map contains applica-
tion rate information for all locations within a field. A rate map such as the one illustrated in
Figure 4 is typically generated by software running on a desktop computer. The application
map is then transferred to a data card that is read by a drive in the in-cab application system
processor, then used by application software acting through a controller onboard an applicator
to deliver the proper rate at each location in the field. Again, a DGPS system must be used to
continuously correlate the vehicle’s location in the field with a coordinate on the map and the
desired application rate for that coordinate.
Figure 4. Example of an application rate map with rates indicated for each grid cell.
Most variable-rate controllers are designed to synchronize the application rate with the
position in the field by “looking ahead” on the map for the next change in rate. This takes into
account the ground speed of the vehicle and the time required to change the rate of product
coming out of the applicator. A fertilizer spreader truck may operate at field speeds exceeding
15 miles per hour. Without the “look ahead” feature, if the applicator took only one second to
respond to a rate change command from the controller, an area at least 22 feet long and as
wide as the spread pattern would be treated at the wrong rate. With the “look ahead” feature
available in map-based application systems, it is not necessary to reduce travel speeds to
accomplish accurate variable-rate applications.
One commercially-available system that utilizes pre-sampling and map-controlled applica-
tion is called Soilection™ (Ag-Chem Equipment Co., Inc., Minnetonka, MN). The system
utilizes an integrated set of hardware and software components from one source to manage a
wide variety of crop production inputs including fertilizers and crop chemicals. Variable rates
of up to 10 different products can be applied by this system in a single pass based on a set of
maps. The Soilection™ system is also capable of generating a record of actual application
rates to produce “as-applied” maps.
#
#
#
#
#
#
#
#
#
#
#
#
#
#
#
#
#
#
#
#
#
#
#
#
#
#
#
#
180 180
180
180
160
160
160
140
140
140
140
140
100
120
120
120

5
PRECISION AGRICULTURE SSM-2-W
While the Soilection™ system utilizes a set of hardware and software products (including the
applicator, controller package) and software, supplied by one company, a number of other
map-based, variable-rate applicators rely on components from different sources. With such
systems, the user must select compatible components to ensure proper function.
One benefit of the map-based method is the knowledge of the needed amounts of chemi-
cals, or inputs, for the operations prior to entering a field. This knowledge can aid in manag-
ing field operations. The multiple sources of data that are necessary to facilitate map-based
applications can also be used in other decision-making processes for a farming operation. A
farm manager using GIS software can examine all yield, soil property, pest, and as-applied
data.
With typical map-based variable-rate application systems, the high cost of the soil analysis
limits the number of samples that a farmer can afford to test. There is currently much discus-
sion on the optimum number of acres represented by each sample and the location of those
samples. The usual practice is to sample a field based on a 2.5-acre grid pattern. Research in
the eastern Cornbelt is showing that 2.5-acre grid data on soil properties is not always repre-
sentative of actual field conditions. This is one limitation of map-based soil fertility data that is
collected using traditional, manual methods. In the next section, we will discuss how sensors
can be used either to help generate application maps or to eliminate the necessity of such
maps altogether.
Sensor-Based Technologies
While knowing how much product will be needed is a benefit of map-based systems,
sensor-based systems hold a significant advantage in sampling density. A typical map-based
application program is based on a single sample or small set of samples from 2.5-acre areas
within a field. A sensor-based system can collect dozens of “samples” from each acre. This
increase in sampling density should produce a more accurate depiction of within-field
variability.
At this point, the major challenge is to develop sensors that will work accurately in field
conditions at realistic working speeds. Sensor-based application systems must be capable of
accomplishing the sensing, data processing, and application rate adjustment steps in one
machine pass. Speed, both in regard to sensing and processing, is a major requirement of
true sensor-based systems. There is lag time between sensing a soil or crop property and
converting the sensor signal to information that can be used by the system to change the rate
of application. Developers of sensor-based systems must synchronize the sensor measure-
ment site with the desired application rate for that same site. In some instances, the sensor
may have to be mounted on the front of the tractor, or applicator truck, to give the variable-
rate controller enough time to adjust the rate accordingly before it passes the sensed location.
In order to effectively accomplish this on-the-go control, the sensors must respond almost
instantaneously to changes in the soil or crop characteristics.
One component of an on-the-go control system that has been developed at Purdue Univer-
sity is a soil organic matter sensor (Figure 5). This sensor is designed to facilitate the vari-
able-rate application of dry soil-applied herbicides and/or blended fertilizer on the go, without
a map. The organic matter sensor consists of a light sensor (photodiode) surrounded by six
light sources (light emitting diodes or LEDs). The light sensor measures the amount of light
reflected by the soil. This reflection signal is related to the amount of organic matter in the
soil. High organic matter content results in dark soil color and a reduction in light reflectance.
Moisture can also affect the sensor but as long as the soil is uniformly moist, the effects
are small.

PRECISION AGRICULTURE SSM-2-W
6
Figure 5. Soil organic matter sensor.
Some technologies for on-the-go sensing and variable-rate control are already on the market.
One such system is the Soil Doctor
®
(Crop Technology, Inc., Houston, TX). The system uses
pairs of ground-engaging rolling electrodes to examine soil type, organic matter, cation ex-
change capacity, soil moisture, and nitrate nitrogen levels in the soil volume between electrode
pairs. By sensing these properties on the go, the need for a positioning system is eliminated
and the data processing is greatly reduced because no maps are required. And, if the operator
desires to record the sensor outputs and use this information for other operations, the system
is capable of interfacing with a GPS receiver and generating site-specific maps.
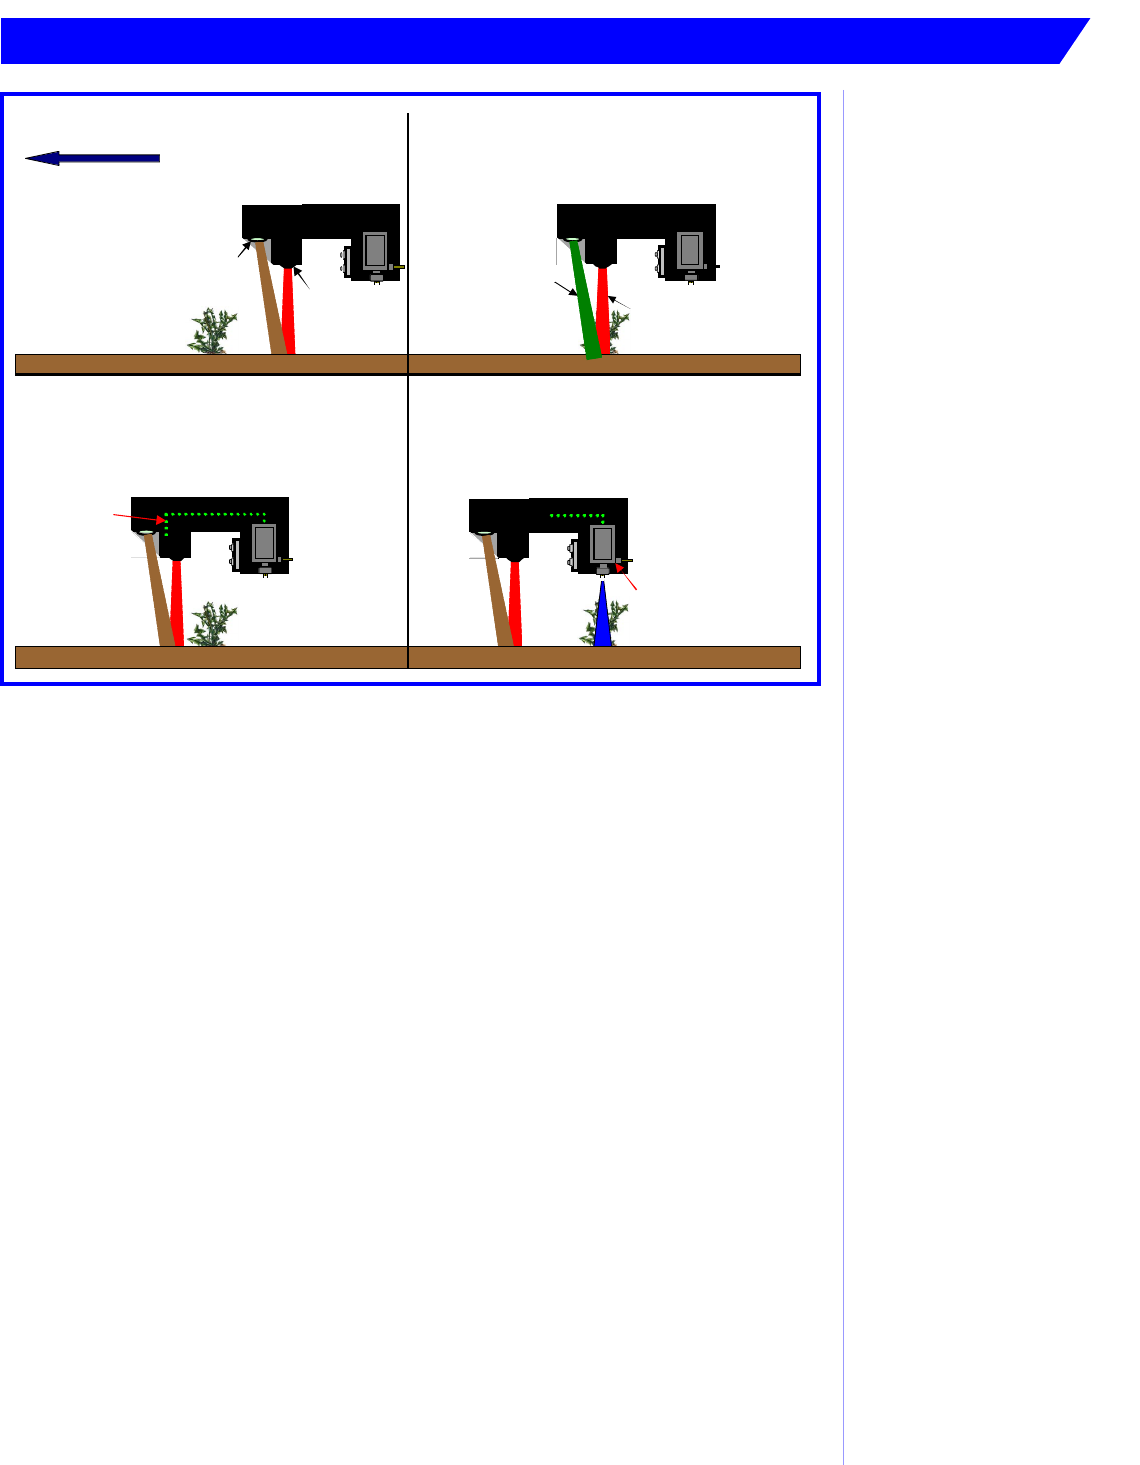
Another commercially-available sensor-based applicator is the WeedSeeker
®
selective spray
system (Patchen, Inc., Ukiah, CA). The WeedSeeker
®
system is built around sensors that
measure light reflectance to distinguish between green weeds and bare soil. Each sensor unit
consists of a light source and an optical sensor (Figure 6). The sensors are mounted on a bar
and aimed at the ground. When a chlorophyll (green) reflectance signal exceeds a threshold
set during calibration by an operator, a signal is sent from a controller to a solenoid-operated
valve to release herbicide. The system is designed to turn on slightly before a weed is reached
and stay on until slightly after a weed is passed. It can operate at travel speeds between three
and ten miles per hour. In areas where weed infestation levels are variable, the unit can
significantly reduce chemical application amounts (compared to uniform, continuous applica-
tions). Since the WeedSeeker
®
is not designed to distinguish between plant types (desirable
crops vs. unwanted weeds), its agricultural use is focused on between-the-row applications in
standing crop or on spot treatment of fallow ground.
light sensor
emitted
light
soil
shank
reflected
light
Cross-Section of the Sensor
light source
bottom view
side view
7
PRECISION AGRICULTURE SSM-2-W
Figure 6. Illustration of the Patchen WeedSeeker
®
during the selective spraying process.
Researchers around the world are actively developing additional sensors for on-the-go soil
property measurements including: nitrate nitrogen, pH, potassium, phosphorous, and soil
texture. Application systems that use variations in plant canopy color as the basis for varying
nitrogen fertilizer application rates are being developed. So are post-emergence sprayers that
can distinguish between weeds and crops. When these research and development efforts
succeed, site-specific farming will become more economical – possibly even automatic.
In the meantime, there are approaches available to take advantage of sensors within a more
traditional map-based variable rate application program. There is at least one sensor-based
tool that takes advantage of a high-rate sampling to create data-dense soil property maps.
Veris
®
technologies (A division of Geoprobe
®
Systems, Salina, KS) manufactures devices that
measure soil electrical conductivity (EC). The company offers vehicle-drawn units that use
rolling electrodes (coulters) as sensing elements and combine EC data with GPS-supplied
position data (Figure 7). Data collected by the units can be used to produce highly-detailed
maps of soil electrical conductivity. EC information can then be related to soil physical charac-
teristics such as texture and topsoil depth. This information can then be used to produce
variable-rate application plans.
12
43
light source
optical sensor
Direction of Travel
emitted light
reflected light
signal
to trigger
sprayer
sprayer
cartridge

PRECISION AGRICULTURE SSM-2-W
8
Figure 7. A Veris
®
soil electrical conductivity mapping system unit.
Summary
Both map- and sensor-based variable-rate application systems are available to the site-
specific farmer. There are also VRA strategies that incorporate aspects of both sensing and
mapping. Each variable-rate application method holds advantages and disadvantages. Strong
points of each system are summarized below:
Advantages of Map-Based Variable-Rate Application
• systems are already available for most crop production inputs
• the user has a database that can be useful for a number of management-related activities
• the user can employ multiple sources of information in the process of formulating a
variable-rate application plan
• the user has significant control regarding the function of such systems because of the
involvement in application rate planning
• field travel speeds need not be reduced
Advantages of Sensor-Based Variable Rate Application
• pre-application data analysis time requirements can be eliminated
• sensors produce far higher data resolution than traditional sampling methods
• no time delay between measurement and application with real-time systems
• systems are self-contained
It is important to match the application system with the objectives of the overall site-specific
management program in which it will be used. Producers should expect an increasing number
of options for both map-based and sensor-based site-specific operations as research and
development efforts continue.
electrical
conductivity
measurement
zone
rolling
electrode
display/processor

9
PRECISION AGRICULTURE SSM-2-W
It is the policy of the Purdue University Cooperative Extension Service, David C. Petritz, Director, that all persons shall have equal opportunity and access to its
programs and facilities without regard to race, color, sex, religion, national origin, age, or disability. Purdue University is an Affirmative Action employer.
This material may be available in alternative formats.
1-888-EXT-INFO
http://www.agcom.purdue.edu/AgCom/Pubs/menu.htm
New 1/01
The information given herein is supplied with the understanding that
no discrimination is intended and no endorsement by the Purdue
University Cooperative Extension Service is implied.
For more information, contact:
Dan Ess, Agricultural and Biological Engineering, phone: (765) 496-3977,
e-mail: [email protected];
Sam Parsons, Agricultural and Biological Engineering, phone: (765) 494-1177,
e-mail: [email protected];
or refer to:
The Precision Farming Guide for Agriculturists
, John Deere Publishing,
Moline, IL. 117 p.
