
Technical Overview
Importance of Data Normalization
Normalization of functional biological data is a key component in the workflow for
performing and/or subsequent analysis of raw data to ensure accurate and consistent
interpretation of results. XF metabolic assays are no different in this aspect, and
some form of normalization is required for most experiments performed. Whether
comparing different cell types, genetic modifications or compound treatments, the
data must be normalized to a common shared parameter for correct comparison.
Normalization of XF assays can be applied on several levels, including cell number,
genomic DNA, and total cellular protein. This document focuses primarily on methods
that use cell number (or a surrogate for cell number) to normalize XF rate data (OCR,
ECAR, PER).
Factors Affecting Cell Density and Cell Proliferation Rates
When preparing for an XF assay, a variety of factors can affect the cell density (num-
ber of cells per well), including: proliferation rate, degree of cell differentiation, rate of
cell death and plating, or cell adherence efficiency.
Proliferation rates are critical as most anchorage-dependent cells require at least an
overnight culture prior to an XF assay, and cell number can change during this culture
period. It is especially important to know the proliferation rate when interventions (e.g.
genetic modifications, chronic drug treatments, etc.) are being introduced, as these
often result in changes in cell growth rates and thus must be taken into consideration
when analyzing and interpreting XF data.
Understanding the growth rate of the cell type of interest may be determined empiri-
cally by charting cell number vs. time. An ideal strategy is to plate the proper number
of cells per well by considering any differences in doubling times among experimental
groups; thus minimizing variations in the cell number across groups at the time of the
XF assay. Any variations in final cell count which cannot be controlled can be normal-
ized by measuring cell number or cellular contents per well. Another important consid-
eration is keeping the culture time between cell seeding and the XF assay constant if
similar types of XF assays are to be performed over a span of days or weeks.
Methods and strategies for
normalizing XF metabolic data to
cellular parameters
Authors
Yoonseok Kam
George W. Rogers
Ned Jastromb
Brian P. Dranka

2
Methods of Normalization
Total Cellular Protein
Normalizing to total cellular protein is relatively quick and
inexpensive, and can be used with almost any standard
microplate reader. Cells are lysed, and typically a portion of
the well content is used for quantitation via Bradford or BCA
protein detection reagents. It is recommended to always
perform a standard protein concentration curve to ensure
accurate quantitation and allow absolute comparison of data
from assay to assay. Figure 1 shows raw OCR and ECAR data
that has been normalized to total cellular protein.
While straightforward, this method makes the implicit as-
sumption that any intervention made to the cells does not
alter total cellular protein content significantly. This normaliza-
tion method can become problematic if treatment of the cells
causes shifts in mitochondrial biogenesis, which can alter the
protein content of the cell, and true differences in activity can
be concealed [1]. Assessing mitochondrial biogenesis is dis-
cussed in more detail below. Normalization using total protein
is also not applicable if there are there significant variations
in the amount of extracellular matrix protein present among
different experimental groups or if plates are coated with
protein containing cellular adherents (e.g. collagen, laminin,
Matrigel
®
).
R
2
= 0.9538
0
2
4
6
0 10000 20000
Protein (µg)
Cell Count
SKOV3
A
0 1 0 2 0 3 0 4 0 5 0
0
5 0
1 0 0
1 5 0
2 0 0
OCR (pmol/min)
OCR Data Normalized OCR Data
ECAR Data Normalized ECAR Data
Time (minutes) Time (minutes)
Time (minutes) Time (minutes)
OCR (pmol/min/
µg protein
)
ECAR (mpH/min)
ECAR (mpH/min/
µg protein
)
0 1 0 2 0 3 0 4 0 5 0
0
1 0
2 0
3 0
4 0
0 1 0 2 0 3 0 4 0 5 0
0
2 0
4 0
6 0
0 1 0 2 0 3 0 4 0 5 0
0
5
1 0
1 5
B C
1.0x10
4
1.5x10
4
2.0x10
4
2.5x10
4
3.0x10
4
Nuclear DNA
In cases where total protein or cell counting may not be
relevant or feasible, nuclear DNA content per well may be
used to normalize XF rate data [2]. This method is based
on the assumption that, unlike certain instances with total
cellular protein described above, nuclear DNA correlates
linearly with cell number. Various fluorescence or colorimetric
dyes that incorporate into dsDNA are typically used to
quantitate nuclear DNA. References [3] and [4] provide a
thorough review of these methods and dyes, including
exemplary data with PicoGreen and CyQuant reagents. As
with a total protein assay, a standard curve using a reference
dsDNA (e.g. Lambda DNA) is recommended to ensure
accurate quantitation and allow absolute comparison of
data sets.
Figure 1. Example of XF data normalization using total cellular protein from SKOV3 cells. Cells were plated at 1x10
4
, 1.5x10
4
, 2x10
4
, 2.5x10
4
, 3x10
4
cells per well in
XF96 tissue culture microplates (n=6), cultured for 24 hours, followed by assessment of basal and stressed OCR and ECAR (stress induced by 1.0 µM oligomycin
+ 0.5 µM FCCP, final, arrows). A) Correlation of cell number counted using the Seahorse XF Imaging and Cell Counting Software using Cytation 1 vs. total cellular
protein values shows a linear relationship. B) Raw OCR and ECAR values for basal and stressed rates at different plating densities. C) OCR and ECAR values for
basal and stressed rates at different plating densities normalized to total cellular protein. (Mean ± SD, n=6)
3
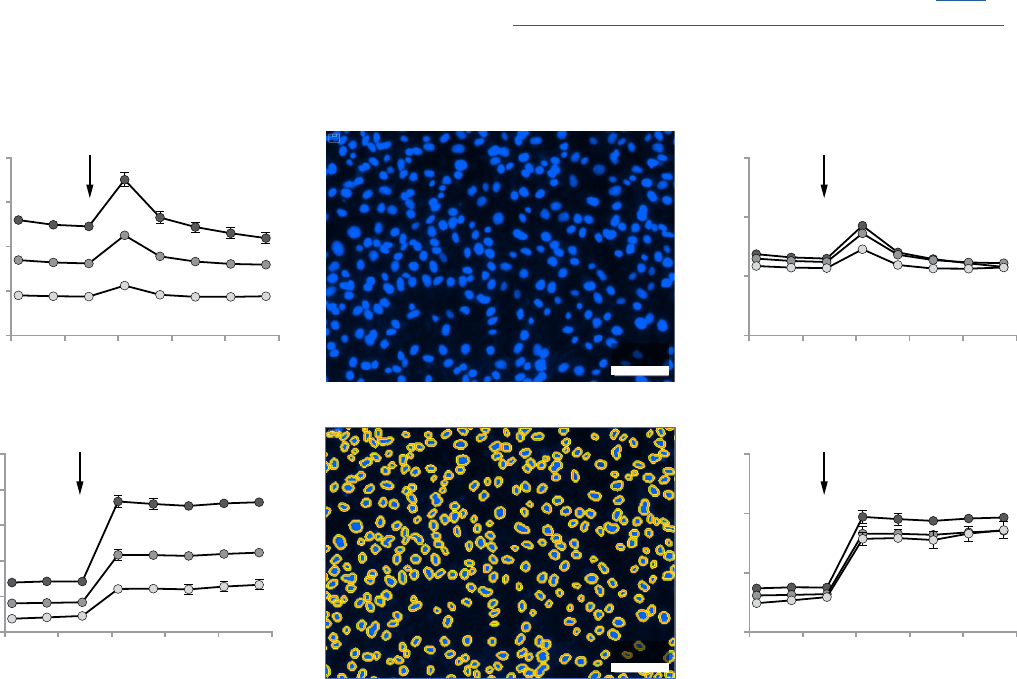
Figure 2. Example of XF data normalization using in situ nuclear staining and in situ cell counting. SKOV3 cells were plated at 1x10
4
, 2x10
4
, 3x10
4
cells per well,
cultured 24 h, subject to the XF Cell Energy Phenotype Test and followed by image analysis. A) Raw OCR and ECAR change with injection (arrows) of oligomycin
+ FCCP (1.0 µM and 0.5 µM final, respectively), including 20 µM Hoechst 33342 (2 µM final). B) Representative images of nuclei fluorescently labeled by Hoechst
33342 (upper panel) and nuclei identified and outlined using the Seahorse XF Imaging and Cell Counting Software with the Cytation 1 (lower panel). C) OCR and
ECAR normalized by in situ nuclear staining cell counts (Mean ± SD, n=4).
0 1 0 2 0 3 0 4 0 5 0
0
5 0
1 0 0
1 5 0
2 0 0
0 1 0 2 0 3 0 4 0 5 0
0
1 0
2 0
3 0
4 0
5 0
0 1 0 2 0 3 0 4 0 5 0
0
5
1 0
1 5
0 1 0 2 0 3 0 4 0 5 0
0
1
2
3
A B C
In situ Staining
Nuclear Segmentation
OCR (pmol/min)
Time (minutes)
Time (minutes)
Time (minutes)
Time (minutes)
OCR (pmol/min/
1000 Cells
)
ECAR (mpH/min)
ECAR (mpH/min/
1000 Cells
)
OCR Data Normalized OCR Data
ECAR Data Normalized ECAR Data
100µm
100µm
The most robust normalization method for XF metabolic rate
data involves counting of cells in each well of the microplate
via direct imaging of the cells or imaging stained nuclei.
Both imaging methods rely on dedicated high-throughput,
automated imaging instruments. A number of imaging
systems may be used for counting cells directly post XF
assay, including the BioTek Instruments' Cytation 1, which
may be used for both direct cell counting and counting
nuclear stained cells.
Imaging and quantifying cell number using a cell permeable
nuclear stain has advantages over direct cell imaging in
that the workflow is simpler (e.g. no requirement to fix cells)
and can be automated with no need to prepare reference
samples. Because direct counting of cells is mediated by
microscopic image capture followed by image analysis, it is
best applied when cells are well-dispersed and show clear
defined morphology (e.g. A549 or SKOV3). This method is
better for less-well dispersed cells, or those with clustered
morphology (e.g. MCF7). In addition, the non-destructive
nature of this protocol makes it compatible with other
downstream analyses, such as measuring total protein, PCR
or immunostaining. Note that cell permeable nuclear dyes
may be injected directly onto the cells in situ via an injection
port on the XF cartridge, or can be applied post XF assay if all
four injection ports are used.
Figure 2 shows an example of in situ nuclear staining
and segmentation ysing the Seahorse XF Imaging and
Cell Counting Software with the Cytation 1, then used
for normalization of XF Cell Energy Phenotype Test data
using SKOV3 cells. Figure 3 shows further examples of
normalization using three different cell types varying in
morphology and nuclear size.
More detailed aspects of these imaging/normalization
methods, including workflows and comparative examples,
may be found at: “Normalization of Agilent Seahorse XF Data
by In-situ Cell Counting Using a BioTek Cytation 5” (http://
www.agilent.com/cs/library/applications/5991-7908EN.pdf).

4
A B C
Figure 3. Example of XF data normalization using in situ nuclear staining of HT-29 (A), MCF7 (B), and RAW264.7 (C) using the Seahorse XF Imaging and Cell
Counting Software with the Cytation 1. Cells were seeded at 1x10
4
, 1.5x10
4
, 2x10
4
, 2.5x10
4
, 3x10
4
cells per well for HT-29 and MCF7, and at 1.5x10
4
, 2.8x10
4
,
3.0x10
4
, 3.8x10
4
, 4.5x10
4
cells per well for RAW264.7 in XF96 tissue culture microplates and cultured for 24h. XF Cell Energy Phenotype Test Kit performed with
injection of oligomycin + FCCP (1.0 µM and 0.5 µM final, respectively) including 20 µM Hoechst 33342 (2.0 µM final). XF Energy Maps generated by Seahorse XF
Cell Energy Phenotype Report Generator are compared before (upper panels) and after (lower panels) normalization (Mean ± SD, n=6).
Special Cases:
- Non-proliferative cells: including primary and/or post-
mitotic cells that are cultured for a period of time, but do
not replicate (e.g. cortical neurons, neonatal rat ventricular
myocytes, brown adipocytes, differentiated iPSCs, etc.[5,
6]). Typically, cells are counted before seeding into XF Tis-
sue Culture Microplates to provide an initial value. Howev-
er, it is recommended to perform some relevant method of
normalization post-XF assay to account for any potential
loss of cells due to detachment or loss of viability over the
time course of the culture.
- Acutely attached cells: some cells or XF applications
require cells to be acutely adhered, usually via centrifuga-
tion, to the XF Tissue Culture Microplate, (e.g. the T cell
Activation Assay http://seahorseinfo.agilent.com/acton/
fs/blocks/showLandingPage/a/10967/p/p-00c1/t/page/
fm/1 ). In these cases, quantitative cell counting before the
assay is typically performed and a known number of cells
is introduced into each well. Again, it can still be valuable
to perform a post assay assessment of well content to
account for any potential loss of cells due to detachment
during the assay.
- Normalization of 3D samples, such as spheroids, may
be based on size or volume of the sample. Spheroids are
typically grown in a separate vessel, beginning with several
hundred to several thousand cells. While more difficult to
assess by total protein, nuclear DNA or cell count, using
geometric parameters such as spheroid diameter, total
spheroid volume may be calculated and used as a normal-
ization parameter [7].
- Isolated Mitochondria or Synaptosomes: use of isolated mi-
tochondria or synaptosomes in the XF instruments requires
quantifying the sample protein content prior to the XF assay
and seeding an optimized amount. In these case, post-as-
sessment of the mitochondrial or synaptosomal protein, and
thus normalization, is typically not required [8, 9].

5
Choosing the Most Relevant Normalization Method
The initial choice of normalization method often begins with the type of sample being analyzed. The scheme below illustrates a
decision-making process for choosing an optimal method. The normalization techniques described here each have their respective
advantages and disadvantages, and no single normalization method is universally applicable for every experimental design and
subsequent analysis.
No
Cells in 2D
monolayer
- Cell counting by
imaging
b)
- Protein measurement
c)
- gDNA measurement
- Manual counting after
cell dissociation
- Data Analysis via Wave
- Data interpretation by
Report Generator(s)
a) Agilent Seahorse microplate-compatible cell
imaging and analysis system
b) Non-destructive; the other method is still
applicable
c) Excluded when noncellular protein is
included (e.g. ECM protein)
Yes
Spheroid?
Isolated
mitochondria?
No
- Protein assay prior to
XF Assay
- Diameter or volume
measurement
- Nuclear acid
measurement
Yes
Yes
End
Yes
Cell image
analysis
system
a)
available?
- Protein measurement
c)
-
gDNA measurement
- Manual counting after
cell dissociation
No
Start
In many cases, more than one normalization method can be applied. However, any method quantifying cell number based on cel-
lular metabolism (e.g. MTT assay, total ATP level) is not recommended as XF assays are specifically designed to measure cellular
metabolism, and thus a normalization technique independent of metabolic function should be applied. Table 1 below provides key
advantages and disadvantages of the normalization methods presented above:
Normalization Method Advantages Disadvantages
Total Cellular Protein
- Inexpensive
- Compatible with most plate readers
- Sample transfer can introduce error
- Incompatible with ECM coated plates
- Cells destroyed to obtain protein
- Incompatible if there are changes in mitochondrial biogenesis
Genomic DNA
- Compatible with most fluorometric plate readers
- Sample transfer can introduce error
- Incomp atile with multi-nucleated cells
- Cells destroyed to obtain nuclear DNA
Cell Imaging
- Most direct method of obtaining cell and/or nuclei counts
- No processing after XF assay
- Cells remain viable for downstream applications
- Compatible with ECM coated plates
- Requires dedicated cell counting instrumentation
Note that central to any normalization method used is the assumption that a linear relationship exists between cell number and
signal being measured; the amount of analyte on a per cell basis remains unchanged. This assumption, though, is not always valid.
For example, a cell that has increased metabolic activity via mitochondrial biogenesis will have a higher OCR on a per-cell basis,
however, this difference in respiration may be underestimated or even concealed if total cellular protein was the normalization
method applied. As stated above, if mitochondrial biogenesis is suspected, total cellular protein should not be used for XF assay
data normalization, but rather genomic DNA, or preferably, cell number.

6
Cell Number vs. Cell Viability
Another important aspect to consider when normalizing XF
data is the relationship between cell number and cell vi-
ability, i.e. what percentage of the cells in each well or treat-
ment group are viable? This becomes especially important
when orthogonal measurements of cell proliferation and/or
cytotoxicity are used in conjunction with XF data. If measur-
ing cell viability is required, it is critical to use a method that
is not affected by acute treatments with any XF assay kit
reagents, which can inhibit mitochondrial and/or glycolytic
function. In particular, this includes viability assays dependent
on cellular NAD(P)H oxidoreductases, such as MTT and MTS
assays. Caution should also be exercised if measuring total
cellular ATP levels as a proxy for cell viability/proliferation, as
recent investigation has demonstrated discrepancies when
correlating cellular ATP (and MTT) to absolute cell numbers
[10]. Alternative viability assays, including the MultiTox-Fluor
Cytotoxicity Assay, are compatible with XF assays reagents
and may be used post-XF assay to obtain the ratio of live to
dead cells. Note that cell viability is most often expressed as a
relative ratio or percent, and thus the absolute number of cells
must be measured for accurate normalization of XF data.
Additional Consideration for Normalization
As described above, there are cases in which certain methods
of normalization should not be applied to XF data. These situ-
ations are often related to changes in mitochondrial number/
mass per cell (i.e. mitochondrial biogenesis v. mitophagy),
changes in expression of mtDNA encoded proteins and/or
stoichiometry of mitochondrial electron transport and oxida-
tive phosphorylation complexes (and even complex subunits)
with respect to each other.
In these scenarios, total cellular protein should not be used for
normalization, as important differences in cell biology could
be masked. Use of cell counting and/or gDNA are applicable
in these instances. If changes in mitochondrial number/
mass are suspected, measuring relative changes in mtDNA
or mtDNA : nDNA ratio via qRTPCR are applicable orthogonol
verification methods [1, 11]. In these cases where mitochon-
drial mass/number changes, it is suggested to have a positive
control of mitochondrial biogenesis (e.g. treatment of cells
with AICAR, metformin, etc. [12]) to establish the dynamic
range and sensitivity of cellular and mitochondrial responses.
Detecting changes in relative amounts or stoichiometry of
ETC/OxPhos complexes may be assessed by immunoblots of
several electron transport chain proteins standardized to one
or more cytoplasmic proteins [13, 14].
Apply Normalization in Wave and Using the
Baseline Button:
The Wave software used to view XF data has a built in “Baseline”
feature that transforms absolute XF rate data to a relative (%)
scale. Most often, the baseline is set to the rate just prior to the
first injection. Baselining data is most appropriate when attempt-
ing to minimize slight well to well differences in rate due to varia-
tions in cell seeding or proliferation, and is helpful to visualize
changes in rates from acute treatments/injections.
The Normalization function in the Wave software provides a
simple method to apply normalization data to the measured
rate data (OCR, ECAR, PER). To use the normalization func-
tion, an independent assessment of the plate wells for cell
number, protein concentration, DNA content is required as
discussed above.
To normalize data in Wave, three components are used:
– Normalization Values (required): The numeric data gener-
ated from the independent assessment of the well (cell
count, protein concentration, DNA content).
– Normalization Unit (required): This alphanumeric field de-
scribes the units to which the data are to be normalized. It
comprises the unit of measure of the normalization values
(such as “cells”, “mg”, “ng”, and so forth).
– Normalization Scale Factor: This number determines what
value the rate data will be scaled to. Default is 1 and adjust-
ment is optional.
Please see: https://www.agilent.com/cs/library/usermanu-
als/public/S7894-10000_Rev_B_Wave_2_4_User_Guide.pdf
for further details and information on applying normalization
values in Wave.
This feature should not be considered a substitute for
normalization, however, as critical information may be lost
upon transformation (Fig. 4). Consideration should be taken
regarding data presentation and the ability to compare results
among laboratories, thus reporting of absolute normalized
values is encouraged. For these reasons, the Baseline feature
should be used only for initial comparison of groups that have
exact same conditions at start of the assay, and a relevant
method of absolute normalization should be applied.

7
0 15 30 45 60 75
0
100
200
300
400
500
A B
Time (minutes)
5 x 10³
1 x 10⁴
2 x 10⁴
3 x 10⁴
OCR (pmol/min)
OCR (%)
Cell Seeding
Number
0 15 30 45 60 75
0
100
50
150
200
230
300
Time (minutes)
References
1. Liu, T.F., et al., Sequential actions of SIRT1-RELB-SIRT3
coordinate nuclear-mitochondrial communication during
immunometabolic adaptation to acute inflammation and
sepsis. J Biol Chem, 2015. 290(1): p. 396-408.
2. Lorenz, C., et al., Human iPSC-Derived Neural Progenitors
Are an Effective Drug Discovery Model for Neurological
mtDNA Disorders. Cell Stem Cell, 2017. 20(5): p. 659-674.
e9.
3. Quent, V.M.C., et al., Discrepancies between metabolic
activity and DNA content as tool to assess cell prolifera-
tion in cancer research. Journal of Cellular and Molecular
Medicine, 2010. 14(4): p. 1003-1013.
4. Silva, L.P., et al., Measurement of DNA concentration as a
normalization strategy for metabolomic data from adherent
cell lines. Anal Chem, 2013. 85(20): p. 9536-42.
5. Divakaruni, A.S., et al., Inhibition of the mitochondrial pyru-
vate carrier protects from excitotoxic neuronal death. J Cell
Biol, 2017. 216(4): p. 1091-1105.
6. Divakaruni, A.S., et al., Thiazolidinediones are acute,
specific inhibitors of the mitochondrial pyruvate carrier.
Proceedings of the National Academy of Sciences, 2013.
110(14): p. 5422-5427.
7. Jiang, L., et al., Reductive carboxylation supports redox ho-
meostasis during anchorage-independent growth. Nature,
2016. 532: p. 255.
8. Choi, S.W., A.A. Gerencser, and D.G. Nicholls, Bioenergetic
analysis of isolated cerebrocortical nerve terminals on a
microgram scale: spare respiratory capacity and stochastic
mitochondrial failure. J Neurochem, 2009. 109(4): p. 1179-
91.
9. Rogers, G.W., et al., High Throughput Microplate Respira-
tory Measurements Using Minimal Quantities Of Isolated
Mitochondria. PLOS ONE, 2011. 6(7): p. e21746.
10. Chan, G.K.Y., et al., A Simple High-Content Cell Cycle Assay
Reveals Frequent Discrepancies between Cell Number and
ATP and MTS Proliferation Assays. PLOS ONE, 2013. 8(5):
p. e63583.
11. Yamamoto, H., et al., Amla Enhances Mitochondrial Spare
Respiratory Capacity by Increasing Mitochondrial Biogen-
esis and Antioxidant Systems in a Murine Skeletal Muscle
Cell Line. Oxidative Medicine and Cellular Longevity, 2016.
2016: p. 11.
12. Beeson, C.C., G.C. Beeson, and R.G. Schnellmann, A high
throughput respirometric assay for mitochondrial biogen-
esis and toxicity. Anal Biochem, 2010. 404(1): p. 75-81.
13. Monterisi, S., et al., PDE2A2 regulates mitochondria mor-
phology and apoptotic cell death via local modulation of
cAMP/PKA signalling. eLife, 2017. 6.
14. Wiley, S.E., et al., Wolfram Syndrome protein, Miner1,
regulates sulphydryl redox status, the unfolded protein
response, and Ca2+ homeostasis. EMBO Mol Med, 2013.
5(6): p. 904-18.
Figure 4. Absolute vs. Baselined OCR data: Panel A shows absolute OCR with a correlation of respiration rate to cell number. Panel B shows that for each cell
density, responses to XF Cell Stress Test compounds are approximately equivalent, however information regarding differences in OCR with respect to seeding
density is lost upon transformation with the Baseline feature.

